Abstract
A significant obstacle in evaluating mitigation strategies for flaring and venting in the upstream oil and gas industry is the lack of publicly available data on the chemical composition of the gas. This information is required to determine the economic value of the gas, infrastructure and processing requirements, and potential emissions or emissions credits, all of which have significant impact on the economics of such strategies. This paper describes a method for estimating the composition of solution gas being flared and vented at individual facilities, and presents results derived for Alberta, Canada, which sits at the heart of the Western Canadian Sedimentary Basin. Using large amounts of raw data obtained through the Alberta Energy Resources Conservation Board, a relational database was created and specialized queries were developed to link production stream data, raw gas samples, and geography to create production-linked gas composition profiles for approximately half of the currently active facilities. These were used to create composition maps for the entire region, to which the remaining facilities with unknown compositions were geographically linked. The derived data were used to compute a range of solution gas composition profiles and greenhouse gas emission factors, providing new insight into flaring and venting in the region and enabling informed analysis of future management and mitigation strategies.
Accurate and transparent determination of environmental impacts of flaring and venting of gas associated with oil production, and potential benefits of mitigation, is severely hampered by the lack of publicly available gas composition data. In jurisdictions within the Western Canadian Sedimentary Basin, frameworks exist for regulating and trading carbon offset credits but current potential for mitigation is limited by a lack of standardized methods for calculating CO2 equivalent emissions. The composition and emission factor data derived in this paper will be useful to industry, regulators, policy researchers, and entrepreneurs seeking statistically significant and openly available data necessary to manage and mitigate upstream flaring and venting activity and estimate greenhouse gas impacts.
Introduction
In the energy and petrochemical industries, excess or unwanted flammable gases are often disposed of by flaring or venting. Flaring is the process of combusting the gases in an open-atmosphere flame, and provides a means of disposing of flammable gases in a cost-effective manner. If stable combustion of surplus gas is not possible, for instance if the flow rates are too low or too intermittent, or if the heating value of the gas is too low to sustain combustion, or if the gases are deemed uneconomic to recover and regulations permit, the gases are instead vented, meaning they are simply released to atmosphere. The U.S. Energy Information Administration, based on reports from individual countries, estimates that global flaring and venting totaled 122 billion m3 in 2008 (CitationU.S. Energy Information Administration, 2008). By contrast, examination of visible light images captured by orbiting satellite suggests that global flaring alone exceeds 139 billion m3 annually, and that these volumes have been relatively stable over the past 15 yr (CitationElvidge et al., 2009). Vented gas is not as readily detected and to the authors' knowledge, accurate estimates of global venting volumes do not exist. However, for the case of Alberta, Canada, a mature oil- and gas-producing region with extensive pipeline infrastructure, a recent analysis of production data shows venting volumes similar to flared volumes as well as a trend toward proportionally greater amounts of venting as more heavier oils are produced (CitationJohnson and Coderre, 2011).
The majority of global flaring and venting occurs during upstream production of oil and gas resources. The production of conventional oil is nearly always accompanied by the production of flammable gases, even when no gas is initially present in the reservoir. This is because the hydrocarbons are contained in subsurface geological formations under high pressure, which allows for volatile chemical species to equilibrate and dissolve in the formation liquids. When these liquids are produced and brought to the surface, the pressure acting on them is reduced from formation to atmospheric, causing these dissolved gases to come out of solution. These evolved gases are commonly referred to as solution gas. The term associated gas is perhaps even more commonly used, although in general associated gas is understood to refer to the combination of solution gas and gas that exists separately from the oil at reservoir conditions. In the upstream oil and gas industry, solution gas is the source for the majority of all flaring and venting activity that takes place.
From an air emissions management perspective, the practice of flaring and venting is a concern due to the scale at which it takes place. In addition to carbon dioxide (CO2), an important greenhouse gas, flares can produce airborne pollutants such as particulate matter in the form of soot (CitationJohnson et al., 2011; CitationMcEwen and Johnson, 2012), unburned fuel and carbon monoxide (CitationJohnson et al., 2001; CitationJohnson and Kostiuk, 2000) (especially if the heating value of the flare gas is low (CitationJohnson and Kostiuk, 2002), and potentially other by-products of incomplete combustion (CitationStrosher, 2000). When the raw flare gas contains hydrogen sulfide (H2S), the major pollutant sulfur dioxide (SO2) is also produced. Although direct venting of gas precludes combustion related emissions, from a greenhouse gas (GHG) perspective, venting of high-methane-content gas associated with petroleum production is even worse. This is because methane (CH4) has a 100-yr global warming potential that on a mass basis is 25 times more potent than CO2 (CitationSolomon et al., 2007).
Predicting impacts of flaring and venting on a broader scale requires knowledge of gas compositions being flared and vented. Also, the viability of any potential mitigation strategies such as collection of gas into pipelines or the use of the gas to generate heat and electricity are highly dependent on chemical composition of the gas, especially in terms of energy and H2S content. The lack of statistically significant, published data on compositions of flared and vented associated gas is thus a significant impediment to engineering analysis of impacts and mitigation options. Successful regulation and trading of carbon offset credits from flaring and venting mitigation projects are further hampered by a lack of consistently applied and transparently derived greenhouse gas (GHG) emission factors. The objective of this paper is to address this gap in knowledge through comprehensive analysis of available production and reservoir data for a significant petroleum production region of the world. The derived results are subsequently used to estimate a range of gas-composition-based emission factors to predict greenhouse gas emissions from flaring and venting activities.
Petroleum production in the Western Canadian Sedimentary Basin
The Western Canadian Sedimentary Basin (WCSB) is a vast geological formation of sedimentary rock that spans several western Canadian provinces, bordered by the Rocky Mountains to the west and the Canadian Shield to the east. The bulk of Canada's oil and gas resources lie within this basin, including the vast quantities of oil sands that place Canada's proved oil reserves third highest in the world, behind Saudi Arabia and Venezuela (CitationBP, 2011). More than 97% of Canada's proven reserves are in the form of oil sands deposits, whereas conventional reserves in the WCSB account for nearly 2% (CitationNational Energy Board, 2007). However, conventional sources in the WCSB account for a much greater fraction of current production. In 2009, roughly 3% of global oil production was sourced from the WCSB, of which approximately half (55%) originated from oil sands deposits (CitationBP, 2011; CitationNational Energy Board, 2009). The province of Alberta sits at the heart of the WCSB, and is a mature and very active oil and gas production region. Alberta is by a wide margin the largest producer of oil in gas in Canada, accounting for roughly 68% of Canada's 2008 crude oil and equivalent production and 76% of gross natural gas production (CitationStatistics Canada, 2010).
Upstream flaring and venting in Alberta, Canada
Much of the conventional oil in Alberta is produced from smaller-volume wells connected to “battery” sites, i.e., surface facilities in which reservoir fluids, including solution gas, are separated and measured. Oil and bitumen batteries in Alberta produced nearly 15 billion m3 of solution gas in 2008 (CitationEnergy Resources Conservation Board [ERCB], 2010), the latest year for which data were available. The large majority (95.3%) was conserved, meaning that it was either used onsite as fuel or directed into natural gas pipelines for processing and sale. The remainder was disposed of by flaring or venting. Although 4.7% is a relatively small fraction of the total amount of solution gas produced, it still represents a significant volume of gas, which totaled 687 million m3 in 2008 (CitationJohnson and Coderre, 2011). Upstream flaring and venting from all sources in Alberta totaled 1.11 billion m3 in 2008 (CitationERCB, 2010), or approximately 0.9% of the 122 billion m3 global flaring and venting estimate from the U.S. Energy Information Administration (CitationU.S. Energy Information Administration, 2008).
The body that regulates the upstream oil and gas industry in Alberta is the Energy Resources Conservation Board (ERCB). ERCB's Directive 60 contains guidelines for the decision-making process pertaining to solution gas conservation options that industry operators are required to follow (CitationERCB, 2006). Whereas ERCB Directive 007 mandates that operators submit monthly production reports through the Petroleum Registry of Alberta (PRA) (CitationERCB, 2007), Directive 60 further specifies that “volumes of gas greater than or equal to 0.1 103 m3/month (adjusted to 101.325 kPa(a) and 15°C) that is flared, incinerated, or vented” are to be included (CitationERCB, 2006). However, the composition of the gas being flared or vented is not included in these reports.
Origins and production of solution gas
A discussion of solution gas composition begins with some background and basic hydrocarbon reservoir terminology. According to the generally accepted organic theory, hydrocarbons were formed when sediments including organic matter were buried by geological shifts, and subjected to intense temperatures and pressures over periods of geological time (CitationDandekar, 2006). These combined factors converted the organic matter to the fluids found in reservoirs today, and converted the sand, mud, and silt sediments to rock. Hydrocarbon fluids, being less dense than water, were displaced upwards through porous and permeable rock, until they either breached the surface or were trapped by an impermeable layer of rock (called a cap rock) that prevented further upward migration. However, the pores in the rock are small enough that surface wettability and capillary forces prevent complete segregation of the fluids. Thus, hydrocarbon reservoirs consist of porous and permeable rock, the pore space of which is filled with mixtures of water, oil, and gas phases, partially segregated to form a gradient of fluid saturations (i.e., the fraction of pore space filled with each fluid phase) from primarily gas just underneath the cap stone, to primarily oil further down, to primarily water toward the bottom.
The composition of solution gas can vary considerably, comprising differing mixtures of light hydrocarbon species (primarily alkanes such as methane), nonflammable gases such as nitrogen and carbon dioxide, and toxic impurities such as hydrogen sulfide (H2S). H2S content has a particularly significant impact on the economics of flaring and venting mitigation. As specified in the Alberta Pipeline Act (CitationProvince of Alberta, 2005), gas with more than 10 mol/kmol (i.e., 1% by volume) H2S is designated “sour” (as opposed to “sweet”). Sour gas is handled and regulated separately from sweet gas and has different infrastructure requirements, meaning that it must be directed to specialized sour gas pipelines and processing facilities before entering a sales gas line. It should be noted that in practice, several different H2S content thresholds for defining sour gas are also common. For example, the Alberta Oil and Gas Conservation Act (CitationProvince of Alberta, 2011) and Directive 60 (CitationERCB, 2006) define sour gas simply as gas “containing” H2S. Other ERCB guidelines tend to differentiate sour sites based on potential release rates of sulfur, rather than by raw volume concentrations of H2S in the gas stream (CitationERCB, 2011a, Citation2008).
Therefore, to evaluate the economics of any potential mitigation strategies and to determine the GHG contributions of solution gas flaring and venting, the composition of the gas must first be determined. This is problematic in that the composition often goes unmeasured, particularly at smaller production facilities. This paper presents a strategy for assigning estimated solution gas compositions to production facilities in the WCSB. The derived results were used to determine volume- and site-weighted solution gas composition ranges, and to calculate GHG emission factors for flaring and venting activities under a range of scenarios. In addition, separate maps for flared and vented solution gas in the province of Alberta were developed to assess the geographic distribution of gas compositions within the province. These new data enable proper estimation of environmental impacts and support quantitative evaluation of mitigation strategies for upstream flaring and venting activities in the WCSB. Finally, the methodology developed herein could be usefully applied to other mature oil- and gas-producing regions of the world.
Methodology
defines key terms used in oil production at batteries in Alberta. An oil field, or simply a field, refers to the surface area above an underground hydrocarbon reservoir. A pool refers to the hydrocarbon reserve itself, whether a geological pool, which refers to an actual underground geological hydrocarbon-containing formation as discussed above, or a comingled pool (sometimes also called an administrative pool), which describes some combination of geological pools that are tapped by an individual well. The term “administrative pool” is primarily used for production accounting purposes.
Figure 1. An illustration of hydrocarbon reservoir terminology.
In the simplistic representation seen in , a battery is present in a field, and produces from three wells. Well 1 and Well 2 produce from Pool 1 and Pool 2, respectively, which are each distinct geological pools. Well 3 produces from both Pool 1 and Pool 2; this combination would then be assigned a separate administrative pool code.
Industry-reported monthly production data from more than 18,000 oil and bitumen batteries in the province of Alberta, spanning the years 2002–2008, were obtained in collaboration with the ERCB. These data are a raw form of the ERCB ST-60 series reports available for public purchase (CitationERCB, 2011b) and are the basis of the volumetric production and battery location data used in this work. Also obtained through the ERCB were a large number (60,000+) of gas samples from wells attached to nonconfidential pools, which contained molar fractions of 13 chemical groups including hydrocarbons by carbon content (C1, C2, C3, IC4, NC4, C5, C6, C7+), combustible nonhydrocarbon species (H2, H2S), as well as noncombustibles (He, N2, CO2). Similarly, these data are a raw form of the “Individual Well Gas Analysis Data” files available for public purchase (CitationERCB, 2011b). These gas analyses originate from industry-supplied reports to the ERCB, and although they do not contain details of the specific analysis procedures used, it is understood that they are almost exclusively obtained using gas chromatography with extracted samples, and are reported with a mole fraction precision of 0.0001 as per ERCB Directive 017 (CitationERCB, 2011a). Given the reported precision of the gas samples, overall uncertainties in the present analysis will be dominated by site-to-site variability, which is presented in terms of percentile limits and considered in more detail in the results section. Finally, the ERCB provided production stream data for nearly 9000 nonconfidential batteries, which link those batteries to the reservoirs from which they produce via numeric field and pool identification codes, including the proportions of production attributed to each pool for multi-well batteries (see ). These linkages are continually updated as production patterns change, and the data considered in the present analysis reflect linkages in place in June 2008. All data were merged into a large relational database created to analyze results using scripted queries.
To meet the key objectives of estimating battery-specific and volume-weighted average compositions of gas flared and/or vented in the province, several pieces of information needed to be connected. Because the available gas analysis data contained only limited location information (i.e., each gas analysis identified a pool code and sometimes a field code, but was otherwise not attached to a specific location), the most direct way to link a gas sample to a specific battery (and its known geographic location) was through the production stream data. These production stream data contained a numeric identification code for the field in which each battery was located (rather than specific location information such as latitude and longitude) and one or more code numbers for the pool(s) (i.e., hydrocarbon reservoir(s)) from which it produced. Coupled with battery specific production data (which included location data and monthly volumes of gas flared and/or vented), composition of gases being flared and/or vented could be determined and directly linked with gas volumes.
Preliminary analysis revealed that of the 60,000+ gas samples available, only a small subset could be matched for both the field and pool codes associated with any particular battery. However, given the geological time scales the fluids had to equilibrate within a pool, it was deemed reasonable to assume that solution gas compositions (as opposed to liquid compositions) would not vary significantly within a single geological pool, and available gas samples for a given pool could be averaged. Indeed, for geological pools with multiple samples, half had standard deviations in C1 concentration of less than 5.2% of the mean value within the pool, and 75% of the pools had standard deviations in C1 of less than 8.3% of the mean. Similarly, half of all administrative/comingled pools with multiple samples had standard deviations in C1 concentration of less than 5.6% of the mean and 75% had standard deviations less than 8.6% of the mean. This compares to a standard deviation of C1 concentration of 9.7% of the mean for all available gas samples, and 10% among the means for each pool. Thus, although the limits of available data necessitated neglecting spatial and temporal variations in gas composition within a pool, the analysis suggests that this is a reasonable assumption for an aggregate analysis. Although this would be a relevant source of uncertainty in attempting to assign gas compositions to individual batteries, the data further suggest that uncertainties in C1 mole fraction of less than 0.05 would be typical.
To further verify the validity of this approach, statistical analysis using Levene's test for equality of variances was completed to compare the variations among gas samples from a single pool with variations among all gas samples. Calculations were performed for each of the three pools with the most available data (i.e., two geological pools with 323 and 337 available gas samples, and one administrative pool with 2529 available gas samples), and results easily showed that the differences among the variances were statistically significant. Thus, multiple samples within a common pool had statistically less variation than the set of all gas samples, and it was reasonable to combine them for the purpose of the aggregate analysis.
Under this assumption, two batteries located in different fields but producing from the same pool would be expected to have similar solution gas compositions, and production stream data could then be linked to gas samples by matching only the pool codes within the database. Because most pools had multiple available corresponding gas samples, the impact of any solution gas variability within the pools was further minimized in the aggregate analysis.
Of the 60,000+ gas samples obtained through the ERCB, approximately 8500 distinct pools (whether geological or comingled/administrative) were represented, indicating that the gas from many pools had been sampled multiple times. With respect to comingled pools, using available data reported to ERCB, there is unfortunately no satisfactory method to determine the proportions produced from each geological pool within a comingled pool, or even whether those proportions would remain constant over time. Gas compositions from comingled pools were therefore similarly assigned the arithmetic average of all associated composition samples. Once the compositions of individual geological and comingled/administrative pools were identified, solution gas composition profiles were then assigned to individual batteries using available production stream information, weighted by the fraction of production attributed to each pool. This method allowed composition profiles to be directly assigned to roughly 6000 separate batteries.
For the remaining facilities, in the absence of additional gas samples, compositions were estimated based on geographic location. Gas composition maps were created by first overlaying a spatial grid on the province with elements that measured 0.15° latitude by 0.2° longitude such that they were approximately square over Alberta's latitudes. The average composition of each element was determined as the arithmetic mean of the available composition profiles from any facilities within that element. The grid size was chosen to be much smaller than the typical pool dimension, and as small as possible while still enabling the available data to be extended to regions without available measurements using filtering techniques as described below. Based on analysis of the distances between batteries connected to the same pool, the median and average pool sizes (i.e., the horizontal dimension of the pool) were ∼90 and ∼145 km or ∼4–7 times larger than the grid element size.
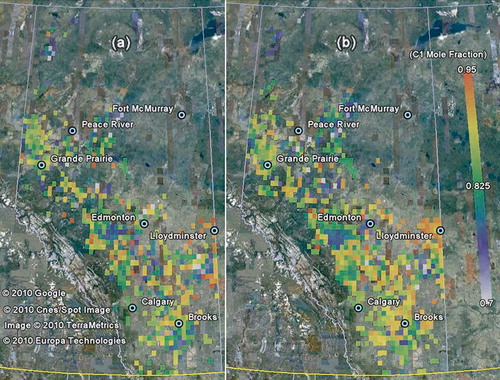
Because regulatory distinction is made between flared and vented gas, separate composition maps were generated using data for facilities that have reported venting activity and facilities that have not (i.e., those that exclusively flare). This distinction was made under the assumption that average compositions of gas vented and flared could be expected to be different. For example, because of the extreme toxicity of H2S, one would expect to find the vented gas had lower average H2S concentrations relative to flared gas. The resulting maps for C1 (methane) concentration are shown in for (a) exclusively flaring batteries and for (b) batteries reporting any amount of venting.
Figure 2. Map showing binned C1 concentrations at (a) exclusively flaring batteries and (b) batteries that reported any amount of venting (i.e. batteries that vent exclusively as well as batteries reporting both flaring and venting.)
The data shown in were then smoothed and extended into grid elements without assigned compositions through the application of spatial low-pass filters. Digital low-pass filters provide a method of smoothing that reduces noise in an array of data while largely maintaining its integrity (CitationAcharya and Ray, 2005). Such tools are commonly used in digital image processing to remove noise, and work by assigning a value to each individual element (or pixel) based on the values of the surrounding elements (CitationAcharya and Ray, 2005). The number and position of the surrounding elements to consider are defined by the filter kernel, with larger kernels leading to greater degrees of smoothing, and hence loss of high-frequency data. Different filter types are primarily identified by the operation used to assign a value to a cell. Common examples include mean and median filters, which replace the value of the cell being filtered with either the mean or median value of all elements within the kernel (including itself). The use of mean filtering was chosen because it offers low-pass smoothing while preserving the constraint that the component fractions must sum up to unity. Although mean filtering is commonly used when differences in neighboring cells are due to random noise rather than from separate sources (as is nominally the case here, where different batteries would be producing from different well(s) that may be drawing from different proportions of pools), for the grid scale at which the filter was applied (which is ∼4–7 times smaller than the relevant scale of a typical pool as noted above), compositions variations can be considered random for the purposes of interpolation. Potential effects of this averaging procedure are further considered in the results section below.
When implementing the filtering operation for interpolation, a kernel size of 3 × 3 was chosen, such that only the values held by each element's immediate neighbors were considered. Two sequential passes were made over the entire province to fully encompass the necessary interpolation area. Each battery with an unmeasured composition was then assigned the appropriate average composition of the grid element in which it was located, and using different source data depending on whether that battery predominantly flared or vented. The resulting spatial concentration profiles are presented with the results.
Results
Based on the approaches outlined above, the solution gas composition of each oil or bitumen battery in Alberta active in 2008 was determined either by direct linkage to gas analyses for pools tied to that battery, or by geographic proximity to other batteries that were themselves linkable to measured pool composition data and segregated by flaring or venting activity. Of all the batteries active in 2008, slightly more than half were directly linkable to pool gas samples. Considering only the subset of batteries that reported flaring and venting in 2008, again slightly more than half these (representing slightly less than half of the total volume of gas flared or vented) were directly relatable to measured pool composition data. The proportions of flared and vented volumes directly linkable to pool composition data were less even. Roughly two-thirds of gas flared in 2008 could be linked with pool gas samples, compared with only a quarter of the vented gas. This difference is considered further below.
shows mean gas composition profiles at sites with linked samples compared with sites where composition data were interpolated from maps, with error bars to represent the 10th and 90th percentile concentration values for each component gas species. The inset graph shows histograms of H2S concentrations for the two categories. Overall, the solution gas compositions being flared or vented are heavily dominated by methane (note the broken vertical axis on the figure necessary to plot mole fractions of methane alongside mole fractions of other species). Although subsequent figures reveal noticeable variability among sites and across regions of the province, the 10th and 90th percentile limits in suggest that the variability is confined within a reasonably narrow range of the mean compositions (mole fraction variation of <±0.067 for C1 and <±0.024 for all other species). provides a detailed statistical summary of the composition data shown in , aggregated from all active batteries in the province that reported flaring and/or venting between 2002 and 2008. These data are further segregated to calculate separate composition profiles for batteries that exclusively flared and batteries that reported any amount of venting. For each case the mean, 10th percentile, and 90th percentile component fractions and gross heating values (GHVs) are shown.
Figure 3. Mean composition profiles for data linked to samples and interpolated (geographically linked) from maps. Note the broken vertical axis to permit plotting of methane concentrations alongside concentrations of other species. Error bars represent 10th and 90th percentile values for each species. Inset graph shows histograms of H2S concentration for both groups.
Table 1. Summary of composition profiles as assigned to oil and bitumen batteries in Alberta
On average, the interpolated profiles shown in closely match the directly linked profiles, with mean mole fraction deviations of less than 0.01 for most species. The interpolated samples do show a slight (+0.027 mole fraction) shift toward greater C1 concentrations compared with the directly linked samples, which is consistent with the larger proportion of vented gas represented by this category, predominantly from heavy oil production. On the other hand, the inset H2S histogram in reveals a slight bias towards higher H2S contents within the 0–1% mole fraction range at sites with compositions assigned via interpolation, even though the larger full figure shows a negligibly small decrease in the overall mean H2S concentration at these same sites. This is most likely an effect of spatially smoothing the inherently high-frequency H2S data (i.e., the raw H2S data in particular show sharp geographic variations). Although this effect appears to be limited to values below the sour threshold of 10 mol/kmol (CitationProvince of Alberta, 2005), this does indicate a potential bias toward falsely labeling some interpolated sites as sour. However, within the context of the overall mean H2S concentration remaining constant after interpolation, this effect can be considered conservative both from a health perspective and in terms of potential mitigation costs (because sour gas processing equipment is typically more expensive than sweet). As is stressed throughout this paper, it is therefore crucial that nonaggregate (i.e., site-by-site) evaluation of mitigation options be informed by accurate site-specific measurements of solution gas composition.
The maps shown in represent the smoothed geographical distribution of C1 concentration, H2S concentration, and the gross heating value of solution gas throughout the province of Alberta, segregated by batteries that flared exclusively versus those that reported any amount of gas venting activity. As noted above, this distinction was made because it is reasonable to assume that gas that is vented as well as flared might logically be different from gas that is flared exclusively, especially with respect to content of toxic H2S.
Figure 4. Map showing smoothed C1 concentrations at (a) exclusively flaring batteries and (b) batteries that reported any amount of venting.
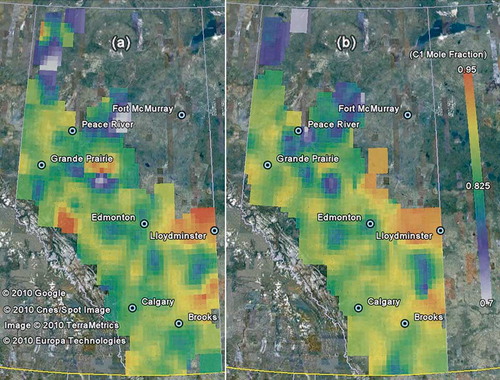
Figure 5. Map showing smoothed H2S concentrations at (a) exclusively flaring batteries and (b) batteries that reported any amount of venting.
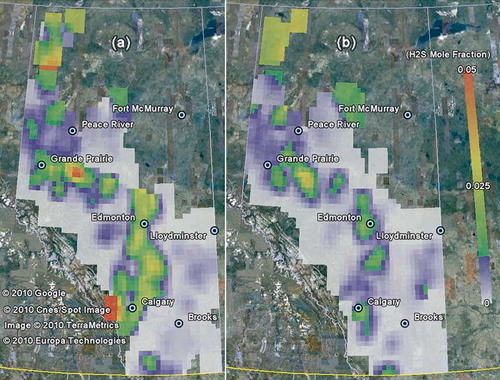
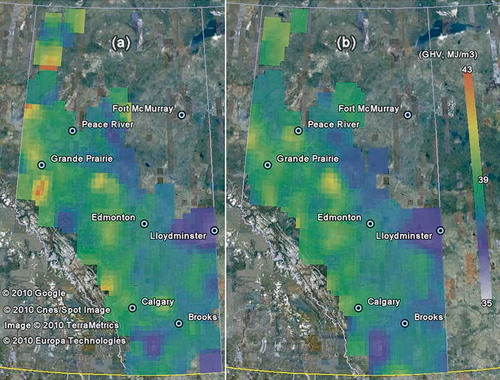
Figure 6. Map showing smoothed gross heating values (GHV) at (a) exclusively flaring batteries and (b) batteries that reported any amount of venting.
Several broad trends are apparent from these distributions. Methane concentrations, seen in , are generally higher near the city of Lloydminster, where predominantly heavier oils are produced, and lower in the northwest of the province. These differences also correspond with the relative amounts of flaring and venting in these areas, where much greater proportions of venting are correlated with the heavier oil production in the Lloydminster region (CitationJohnson and Coderre, 2011). Given the greater proportion of samples linked to flaring sites than venting ones, this implies proportionally fewer measurement-linked gas compositions in the Lloydminster region, and the results for this region therefore rely particularly heavily on geographical linking.
Higher H2S concentrations are noted near the cities of Edmonton, Calgary, Grande Prairie, and in the northwest region of the province, whereas low concentrations are seen near Lloydminster, Brooks, and in the mid-west of the province. (Note that the H2S maps seen in use different color contours than the other figures to highlight the “sour” threshold of 10 mol/kmol.) As expected, this figure also shows that H2S concentrations are generally lower in gas that is vented as well as flared, although in some cases it appears nonnegligible. However, as discussed above, a smaller proportion of vented gas is linked to measurements, and the significant impacts that such small quantities of H2S have on mitigation options further necessitates measurements on a case-by-case basis.
Gross heating values seen in are reasonably well distributed throughout the province, with lower values seen near Lloydminster and in the area south of Calgary and Brooks. From , net or lower heating values (LHVs) would be lower in all cases by approximately 3.5–4 MJ/m3. It is noted that the heating values of solution gas flared at upstream sites are consistently well above the 20 MJ/m3 minimum LHV threshold for permitted flaring as specified in ERCB Directive 60 (CitationERCB, 2006), and thus well above the range of heating values shown to lead to poor flare conversion efficiencies (CitationJohnson and Kostiuk, 2000, Citation2002). There appears to be little difference between the heating values of gas that is flared or vented.
Calculation of greenhouse gas emission factors
Greenhouse gas emission factors can be determined from composition of the gas being either flared or vented. As discussed above, and assuming ideal stoichiometric combustion, flaring the gas results in oxidation of any carbon atoms present in the fuel to produce CO2. This is expressed by the generalized hydrocarbon combustion reaction shown as Equationeq 1:
From inspection of Equationeq 1, the number of moles of CO2 produced by the flare depends only on the carbon content of the raw flare gas. Therefore, a mole of methane (CH4) produces 1 mole of CO2, a mole of ethane (C2H6) produces 2 moles of CO2, and so on. Considering also any CO2 present in the raw flare gas, the total number of moles of CO2 emitted () per mole of raw flare gas (
) can be calculated as in Equationeq 2, where
is the mole fraction of species i in the raw flare gas and the C7+ category is conservatively assumed to contain only C7 species.
Emission factors for vented gas depend only on the concentrations of GHGs present in the fuel, namely methane (C1) and CO2. Some C2-C4 species can also be considered GHGs, as they have been implicated as having indirect warming effects; however, the magnitude of these effects are small compared with that of methane (particularly so given their comparatively small concentrations in solution gas) and are subject to significant uncertainties (CitationSolomon et al., 2007). The potential indirect GHG contributions of these species have thus been omitted. In this case, a GHG emission factor for venting () can be determined according to Equationeq 4, where
is the mass-based global warming potential factor of methane, and all other variables are determined as above:
Categorized flaring and venting emission factors are reported in , assuming 100-yr time horizons for the cited GWP values (CitationSolomon et al., 2007). In practice, however, the combustion efficiency of flares is dependent on many factors, such as cross-wind speed, gas exit velocity, flare exit diameter, composition of the gas, and steam assist rate (when relevant) (CitationJohnson and Kostiuk, 2000, Citation2002; CitationMcDaniel, 1983; CitationPohl et al., 1986; CitationSiegel, 1980). To better reflect real-world conditions, emission factors were also calculated in for cases of nonideal combustion. For this calculation, it was assumed that unburned gases retained their initial compositions; that is, the emission factor for a flare with 98% efficiency is a linear combination of 98% flaring and 2% venting. This scenario inherently assumes that inefficiencies are dominated by stripping of unburned fuel (CitationJohnson et al., 2001).
Table 2. Summary of GHG emission factors in tonnes of CO2 equivalent per 103 m3 of solution gasFootnote a evaluated on a 100-yr horizon derived using data from all batteries, from batteries reporting any amount of venting batteries, or from batteries that flared exclusively
Finally, the GWP of methane as published by the Intergovernmental Panel on Climate Change (IPCC) (CitationSolomon et al., 2007) has seen some revision between publication cycles. In the most recent assessment report, AR4, the 100-yr horizon GWP value is 25, whereas in AR2 the value was 21 (CitationSolomon et al., 2007). Even more recent analysis (CitationShindell et al., 2009), in which direct and indirect effects of aerosol responses to oxidant changes associated with methane emissions are also considered, suggests that actual 100-yr horizon GWP values for methane may be 10–40% higher than the AR4 value. Nevertheless, due to legacy issues and legal frameworks, some government bodies continue to require the use the methane GWP value from AR2 (despite the fact that these data are currently more than 15 yr out of date). Recognizing this reality, emission factors for venting were separately derived using both AR4 and AR2 GWP values and included in to extend its potential applicability. For the emission factors derived for flaring, the variation associated with using different GWP values was not significant (there is no difference if 100% carbon conversion efficiency is assumed), so only the most recent IPCC GWP value for methane was considered.
Although GWP values are most commonly quoted assuming a 100-yr time horizon, this is not universally the best choice. For short-lived climate forcers such as CH4, which has a steady-state lifetime in the atmosphere of about 9 yr (CitationPrinn et al., 2005), the 100-yr time frame understates the opportunity for near-term climate forcing reductions (CitationShindell et al., 2009). Unlike emissions of CO2, which once released may persist in the atmosphere for centuries, mitigation of CH4 emissions would lead to near-term reductions in atmospheric concentrations and consequent climate forcing within 10–20 yr (CitationHansen et al., 2000; CitationMontzka et al., 2011). compares mean GHG emission factors for flaring and venting calculated using 20- and 100-yr time horizons. These results show that near-term climate forcing impacts from venting are much more severe than for flaring. Conversely, this difference illustrates a significant opportunity for near-term mitigation of climate forcing, and shows how substitution of flaring for venting leads to a factor of ∼20 reduction in CO2 equivalent emissions per unit volume of solution gas over a 20-yr time horizon.
Table 3. Comparison of Mean GHG emission factors for flaring and venting evaluated over 20- and 100-yr time horizonsFootnote a derived using data from all batteries, from batteries reporting any amount of venting batteries, or from batteries that flared exclusively
Estimation of GHG emissions from flaring and venting in Alberta
In 2008, 5945 batteries in Alberta reportedly flared or vented solution gas. Flaring activity was reported by 2360 of these batteries, totaling 305 × 106 m3 of gas flared. Conservatively assuming ideal combustion and using the 100-yr time horizon emission factor derived for exclusively flaring (i.e., nonventing) sites, this implies GHG emissions totaling 0.664 Mt of CO2 equivalent from solution gas flaring at upstream battery sites. Venting activity, reported by 4263 batteries, totaled a similar raw gas volume of 382 × 106 m3. The GHG impact of venting, however, was an order of magnitude greater at 5.74 Mt. The combined total 2008 GHG emissions from solution gas flaring and venting at battery sites in Alberta was thus found to be at least 6.41 Mt. GHG emissions from all upstream flaring and venting sources in Alberta (i.e., including additional flaring during well-tests and at gas plants, etc., which raised total flare and vent volumes to 1.11 billion m3 in 2008 [CitationERCB, 2010]) were approximately 7.64 Mt in 2008. Finally, assuming that the provincial average flaring emission factor is reasonably representative of associated gas worldwide, the estimated global total of 139 billion m3 of gas flared as determined by satellite imagery (CitationElvidge et al., 2009) translates to an annual emission of 292 Mt of CO2 equivalent. Given the lack of detailed information on global venting volumes in the literature, for the purpose of making a very rough estimate, if venting trends in Alberta could be considered representative of worldwide activity, then the GHG contribution of worldwide associated gas venting would be on the order of 2 Gt of CO2 equivalent. Although the uncertainty inherent in this type of gross estimate should not be understated, GHG emissions of this magnitude would represent significant source globally (∼5% of the world total of 38.75 Gt in 2005) (Climate Analysis Indicators Tool; CitationWorld Resources Institute, 2011). Uncertainties in sources of this potential magnitude highlight the need for closer analyses of industry-reported data and ultimately for better direct flow and composition monitoring of flared and vented gas streams globally, and are a further example of the challenges faced in reconciling bottom-up global GHG reporting with top-down estimates derived from atmospheric measurements (CitationWeiss and Prinn, 2011).
Conclusions
A method has been developed to estimate the composition of the solution gas produced at each of the 13,144 oil and bitumen batteries in the province of Alberta that reported flaring or venting activity between January 2002 and December 2008. Measured gas samples from specific sources were tied to geographic location through production facilities, and this information was then used to estimate the compositions of nearby sites lacking measured samples. For this most significant production region within the Western Canadian Sedimentary Basin, analysis revealed that gas flared and vented has reasonably consistent composition with a site-weighted mean methane concentration of 85.8%, with 10th and 90th percentile concentrations of 78.6% and 92.0%, respectively. Heating values were also found to be well above the 20 MJ/m3 minimum limit linked in regulation to poor flare combustion efficiencies. Composition variations are apparent across the region, with higher-methane-content gas linked with heavy oil-producing regions in particular. Greenhouse gas emission factors were derived under various scenarios, assuming different composition ranges and different assumed flare combustion efficiencies. For a reference case assuming 100% flare conversion efficiencies, GHG emissions from flaring and venting at batteries in Alberta were determined to amount to 6.41 Mt in 2008, and 7.64 Mt including all reported upstream flare and vent sources. Applying these emission factors globally, the 139 billion m3 of flaring estimated from satellite data would equate to 292 Mt of GHG emissions annually. The derived data and methods can be used in efforts to quantify and manage flaring and venting emissions and to better assess mitigation opportunities.
Acknowledgments
This project was supported by Natural Resources Canada CanMET Energy (project manager: Michael Layer), and would not have been possible without the invaluable support and cooperation of James Vaughan, Jim Spangelo, Jill Hume, Harvey Halladay, and Jim Dilay of the Alberta Energy Resources Conservation Board (ERCB).
References
- Acharya , T. and Ray , A.K. 2005 . Image Processing: Principles and Applications , Hoboken , NJ : Wiley-Interscience .
- BP. 2011. BP Statistical Review of World Energy, June 2011 www.bp.com/statisticalreview (http://www.bp.com/statisticalreview) (Accessed: 13 August 2011 ).
- Dandekar , A.Y. 2006 . Petroleum Reservoir Rock and Fluid Properties , Boca Raton , FL : CRC Press .
- Elvidge , C.D. , Ziskin , D. , Baugh , K.E. , Tuttle , B.T. , Ghosh , T. , Pack , D.W. , Erwin , E.H. and Zhizhin , M.A. 2009 . Fifteen year record of global natural gas flaring derived from satellite data . Energies , 2 : 595 – 622 . doi: 10.3390/en20300595
- Energy Resources Conservation Board . 2006 . Directive 060: Upstream Petroleum Industry Flaring, Incinerating, and Venting , Calgary , Alberta : Alberta Energy Resources Conservation Board .
- Energy Resources Conservation Board . 2007 . Directive 007: Volumetric and Infrastructure Requirements , Calgary , Alberta : Alberta Energy Resources Conservation Board .
- Energy Resources Conservation Board . 2008 . Directive 056: Energy Development Applications and Schedules , Calgary , Alberta : Alberta Energy Resources Conservation Board .
- Energy Resources Conservation Board . 2010 . ST60B-2010: Upstream Petroleum Industry Flaring and Venting Report , Calgary , Alberta : Alberta Energy Resources Conservation Board .
- Energy Resources Conservation Board . 2011a . Directive 017: Measurement Requirements for Oil and Gas Operations , Calgary , Alberta : Alberta Energy Resources Conservation Board .
- Energy Resources Conservation Board . 2011b . Guide 01: 2011 Catalogue: Publications, Maps, and Services , Calgary , Alberta : Alberta Energy Resources Conservation Board .
- Hansen , J. , Sato , M. , Ruedy , R. , Lacis , A. and Global , O.V. 2000 . Warming in the twenty-first century: An alternative scenario . Proc. Natl. Acad. Sci. U. S. A. , 97 : 9875 – 9880 . doi: 10.1073/pnas.170278997
- Johnson , M.R. and Coderre , A.R. 2011 . An analysis of flaring and venting activity in the Alberta upstream oil and gas industry . J. Air. Waste Manage. Assoc. , 61 : 190 – 200 . doi: 10.3155/1047–3289.61.2.190
- Johnson , M.R. and Coderre , A.R. 2012 . Opportunities for CO2 equivalent emmissions reductions via flare and vent mitigation: A Case study for Alberta, Canada . Int. J. Greenhouse Gas Control. , 8 : 121 – 131 . doi: 10.1016/j.ijggc.2012.02.004
- Johnson , M.R. , Devillers , R.W. and Thomson , K.A. 2011 . Quantitative field measurement of soot emission from a large gas flare using sky-LOSA . Environ. Sci. Technol. , 45 : 345 – 350 . doi: 10.1021/es102230y
- Johnson , M.R. and Kostiuk , L.W. 2000 . Efficiencies of low-momentum jet diffusion flames in crosswinds . Combust. Flame , 123 : 189 – 200 . doi: 10.1016/S0010–2180(00)00151–6
- Johnson , M.R. and Kostiuk , L.W. 2002 . A parametric model for the efficiency of a flare in crosswind . Proc. Combust. Inst. , 29 : 1943 – 1950 . doi: 10.1016/S1540-7489(02)80236-X
- Johnson , M.R. , Wilson , D.J. and Kostiuk , L.W. 2001 . A fuel stripping mechanism for wake-stabilized jet diffusion flames in crossflow . Combust. Sci. Technol. , 169 : 155 – 174 . doi: 10.1080/00102200108907844
- McDaniel , M. 1983 . Flare Efficiency Study , 133 Research Triangle Park , NC : U.S. Environmental Protection Agency .
- McEwen , J.D.N. and Johnson , M.R. 2012 . Black carbon particulate matter emission factors for buoyancy driven associated gas flares . J. Air. Waste Manage. Assoc. , 62 ( 3 ) : 307 – 321 . doi: 10.1080/10473289.2011.650040
- Montzka , S.A. , Dlugokencky , E.J. and Butler , J.H. 2011 . Non-CO2 greenhouse gases and climate change . Nature , 476 : 43 – 50 . doi: 10.1038/nature10322
- National Energy Board . Canada's Energy Future-Reference Case and Scenarios to 2030 . NE23-15/2007E . 2007 . Calgary, Alberta: National Energy Board
- National Energy Board. 2009. Estimated production of Canadian crude oil and equivalent. http://www.neb-one.gc.ca/clf-nsi/rnrgynfmtn/sttstc/crdlndptrlmp rdct/stmtdprdctn-eng.html (http://www.neb-one.gc.ca/clf-nsi/rnrgynfmtn/sttstc/crdlndptrlmp rdct/stmtdprdctn-eng.html) (Accessed: 1 September 2011 ).
- Pohl , J.H. , Lee , J. , Payne , R. and Tichenor , B.A. 1986 . Combustion efficiency of flares . Combust. Sci. Technol. , 50 : 217 – 231 . doi: 10.1080/00102208608923934
- Prinn , R.G. , Huang , J. , Weiss , R.F. , Cunnold , D.M. , Fraser , P.J. , Simmonds , P.G. , McCulloch , A. , Harth , C. , Reimann , S. , Salameh , P. , Doherty , S. O , Wang , R.H.J. , Porter , L.W. , Miller , B.R. and Krummel , P.B. 2005 . Evidence for variability of atmospheric hydroxyl radicals over the past quarter century . Geophys. Res. Lett. , 32 : 2 – 5 . doi: 10.1029/2004GL022228
- Province of Alberta . 2005 . Pipeline Regulation , Alberta Regulation 91/2005 .
- Province of Alberta . 2011 . Oil and Gas Conservation Act , Alberta Regulation 151/71 .
- Shindell , D.T. , Faluvegi , G. , Koch , D.M. , Schmidt , G.A. , Unger , N. and Bauer , S.E. 2009 . Improved attribution of climate forcing to emissions . Science , 326 : 716 – 718 . doi: 10.1126/science.1174760
- Siegel , K.D. 1980 . Degree of conversion of flare gas in refinery high flares , 192 Germany : Fridericiana University Karlsruhe . Ph.D. dissertationKarlsruhe
- Solomon , S. , Qin , D. , Manning , M. , Chen , Z. , Marquis , M. , Averyt , K.B. , Tignor , M. and Miller , H.L. , eds. 2007 . IPCC xxx , 996 Cambridge, UK, and New York , , USA : Cambridge University Press .
- Statistics Canada . 2010 . Energy Statistics Handbook , 57 – 601 . XOttawa , ON : Minister of Industry .
- Strosher , M.T. 2000 . Characterization of emissions from diffusion flare systems . J. Air. Waste Manage. Assoc. , 50 : 1723 – 1733 .
- U.S. Energy Information Administration . 2008 . International Energy Statistics xx – xx .
- Weiss , R.F. and Prinn , R.G. 2011 . Quantifying greenhouse-gas emissions from atmospheric measurements: A critical reality check for climate legislation . Phil. Trans. R. Soc. A , 369 : 1925 – 1942 . doi: 10.1098/rsta.2011.0006
- World Resources Institute . 2011 . Climate Analysis Indicators Tool (CAIT). Version 8.0 , Washington , DC : World Resources Institute .