Abstract
This paper is based on the results of three air quality studies conducted in Buenos Aires in Berlin, and in German spas between 2003 and 2007. A high comparability of results was ensured by using the same sampling techniques and analytical methods. Total particle sampling was achieved by active sampling of fine (PM2.5) and passive sampling of coarse particles ≥2.5 µm and giant particles ≥10 µm. The highly absorbing, black, predominantly carbonaceous particles (BC) of fine particle samples were determined by measuring the total light attenuation of filter samples and interpreting the extinction value as black carbon. The difference between the gravimetric total mass concentration of the PM2.5 samples and the BC is defined as the transparent, mostly mineral fine fraction. In coarse/giant particle samples the mean gray value was determined by means of automated light microscopy with subsequent single-particle analysis. “Opaque” particles were separated from the “transparent” particle fraction by applying a grey value threshold level. Microscopic measurement of individual particles was employed to establish the size distribution of the coarse and giant fraction. Due to different health effects, the separate detection of these components is suggested. Decline functions of particles are given, possibly providing useful information for a more detailed specification of the local particle distribution, and for a better estimate of the individual exposure. Atmospheric dispersal of particles was found effected mainly by source characteristics. An increased, spatially largely constant level of fine transparent particles in Berlin indicates a particle plume originating from photochemical processes. Buenos Aires, in contrast, is characterized by a lower background level of fine transparent particles but is considerably affected by fine black particles from diesel emissions and by a higher resuspension of coarse/giant transparent, mainly soil particles.
Mini-volume and passive sampling combined proved to be suitable for measuring total particles by collecting fine, coarse, and giant particles. This approach allows the acquisition of highly space-resolved data on a weekly basis. A method was employed to calculate a size-fractionated particle concentration from passive samples. The results from three air quality studies using this method demonstrate that the black/opaque and transparent particles distinguished differ considerably in spatial distribution, not only due to varying atmospheric residence. Estimates of the exposure of humans, therefore, have to consider the different effects of rural and urban conditions, and differences between regional climates.
Introduction
Atmospheric particulate matter (PM) is of considerable concern due to its possible adverse effects to humans. Epidemiologic studies demonstrated that PM levels are associated with health risks, hospitalizations, and even mortality, due not only to respiratory but also to cardiovascular diseases (CitationCesaroni et al., 2008; CitationClark et al., 2010; CitationFilleul et al., 2005; CitationKatsouyanni, 2001; CitationMiller et al., 2007; CitationSamet et al., 2000; CitationSchwarz, 1999; CitationZanobetti et al., 2000). A study in three European countries revealed that about 6% of annual deaths could be attributed to PM air pollution (CitationKünzli et al., 2000). Abatement strategies of particle pollution should particularly focus on those PM sources responsible for evidenced health effects.
Several epidemiologic studies comparing the relative effects of different sources suggest that combustion particles, in particular soot, are of more importance than mineral particles (CitationLaden et al., 2000). However, reliable conclusions are often complicated by the lack of representative data. The spatial distribution and involved sources responsible for the health effects are often not sufficiently known in order to develop targeted abatement strategies. A better understanding of small-scale variations of PM is needed for a reliable estimate of the individual exposure.
Fine particles are expected to be of higher risk for humans, because it can be assumed that these particles penetrate more deeply into the breathing system (CitationWHO, 2003, Citation2004; CitationWichmann and Peters, 2002). This assumption is mainly based on the statistical findings of epidemiologic studies. However, it cannot be ruled out that statistics are affected by a limited representativeness of air quality data available. Therefore, it is argued by several authors that the higher correlation of fine particles with health effects is partly due to the more homogeneous distribution of this fraction in contrast to coarse particles, so that actually occurring health effects of coarse particles may be hidden (CitationLipfert and Wyzga, 1995). It is proposed, therefore, to consider the coarse particle fraction in health studies to a greater extend (CitationOstro et al., 1999; CitationWHO, 2004).
As a first approximation, the atmospheric dispersal of particles is a function of their atmospheric residence time. However, also the pattern of local sources, atmospheric conditions, and the properties of particles emitted have an influence. The real exposure to particle concentration in general and to certain components in particular, therefore, can hardly be deduced from total particle concentration only. An estimate of the exposure becomes even more complicated if only data from a stationary monitoring network are available. The air quality studies mentioned earlier provided spatially and compositionally data of higher resolution in order to investigate small-scale variations, especially expected for coarse particles.
Due to traffic as the primary particle source in cities, the variation of transparent and black/opaque particles was investigated in the range of busy roads in different urban environments. As a novelty, the investigation focuses on the full size range including PM2.5 particles, coarse particles between 2.5 and 10 µm, and even giant particles greater than 10 µm in diameter. The mass concentration of all particle samples was determined. The particles in the fine mode where distinguished between transparent and black particles. The particles in the coarse/giant mode were distinguished between transparent and opaque particles.
In the coarse/giant mode additionally the size distribution of the particles was provided. (For more information about the analyzing methods see the Methods section.)
Database
This paper is based on the data provided by studies in Buenos Aires, in Berlin, and in German spas conducted between 2003 and 2007. The measuring periods of these study area are listed in .
Table 1. Measuring periods
The design of these studies was identical with regard to the setup of the measuring sites, the technique of particle sampling, and the methods of particle analysis. The selected sampling techniques provided the collection of a fine (PM2.5), a coarse (2.5 to 10 µm), and a giant fraction (>10 µm) of atmospheric particles.
The sampling sites were arranged to provide samples, representing a highly frequented road (traffic), a site not directly affected by traffic emissions (“backyard”), and a site representing urban background conditions.
Population of the investigation areas
| • | Buenos Aires (city partnership since 1994), capital of Argentina. The Federal District, part of Gran Buenos Aires, has a population of about 3 million people. In total, the urban district of Gran Buenos Aires has a population of more than 13 million people (2009) and is classified as a megacity. More than one-third of the Argentinean population lives in Gran Buenos Aires. | ||||
| • | Berlin (city partnership since 1994), capital of Germany. Its population of 3.4 million (2008) amounts to less than 5% of the German population. | ||||
| • | German spas, rural communities in Germany representing rural background conditions. Two subgroups are formed from a total of 14 spas: six small towns with a population between 10,000 and 35,000 people, and eight villages with a population of less than 10,000 people. | ||||
Population data are summarized in .
Table 2. Population of the investigation areas
In both cities, road traffic is the major source of air pollution. Air pollution in Buenos Aires originates from about 1 million cars, 200,000 trucks, and 15,000 buses circulating in the urban district (CitationSmichowski et al., 2004). Despite a population of only one-fourth, in comparison to Gran Buenos Aires, the same number of cars circulates in Berlin, but only 75,000 trucks and 2,000 buses. This shows that heavy transport ranges over a considerably lower level in comparison to Buenos Aires. On the other hand, Berlin is located in a country with a much denser population and with the considerably higher motorization of about 510 cars per 1000 people (CitationAmt für Statistik Berlin Brandenburg, 2001; CitationUmweltbundesamt, 2010). The motorization in Argentina is about 200 cars per 1000 people.
Buenos Aires is located at the south side of the Rio de la Plata. The water expanse of the Rio de la Plata between Argentina and Uruguay extends about 40 km to the north without any permanent particle sources. The water area additionally acts as a particle sink. Due to the distance of at least 320 km from the Atlantic and the freshwater influx of the Rio Paraná, the salinity of the Rio de la Plata is below 1 g/kg (ppt) (CitationFramiñan and Brown,, 1996; CitationGiménez et al., 2005). A sea salt aerosol, therefore, can only be expected during synoptic episodes with a strong easterly current directly transporting sea air from the Atlantic. To the south of Buenos Aires there is thinly populated, primarily agricultural land. To the west and the east there are only a few smaller cities along the Rio de la Plata. Thus, the air pollution in Buenos Aires can be attributed mostly to local emissions. The regional background concentration, therefore, corresponds to a “clean air” level (CitationTarela and Perone, 2002).
These geographic conditions of Buenos Aires differ considerably from the situation of the Berlin area and in particular from rural conditions in German spas. Instead, the conditions in Central Europe are characterized by a regional particle plume (CitationViana et al., 2008). This plume arises from a photochemical particle formation of precursor gases such as nitrogen dioxide and gaseous hydrocarbons, released by traffic and industrial emissions. The spatial distribution of particles in Buenos Aires can therefore be expected to differ from that in Berlin. On the other hand, we may suppose that the urban conditions of Buenos Aires and Berlin will—due to different source conditions—differ considerably from rural conditions in German spas (categorizing, see capture 3). Furthermore, regional differences between Central Europe and South America may become apparent due to the difference in climate.
Definitions
Size classes of particles
In this paper, the size given of fine particles refers to the aerodynamic equivalent diameter dae according to the PM2.5 convention. The coarser particles are defined by the equivalent volume diameter dvol, which is the diameter of a sphere having the same projected area as the particle in question. The size range of dvol ≥ 2.5 µm is additionally divided into a coarse range with dvol <10 µm and a giant range with dvol ≥ 10 µm. The term “giant” is used according to CitationNoll and Pilat (1971), who defined particles in the range 5–100 µm radius as “giant.” The presented concentration data of giant particles contain particles within the range 10 < dvol ≤ 34 µm. The size distribution of coarse and giant particles is given for particles within the range 2.5 µm ≤ dvol < 160 µm.
A relation between the aerodynamic equivalent diameter dae and the equivalent volume diameter dvol is given by Equationeq (1) in CitationHinds (1982),
Thus definitions of fine particles on the one hand and coarse and giant particles on the other, as used here in the following, are not directly comparable except for spherical particles (χ = 1) and unit density ρp = 1 g/cm³.
Optical classification of particles
Microscopic images of coarse/giant particles typically show a low-absorbing, more or less transparent component and a highly absorbing opaque component. Single-particle measurement of the mean gray value was used to determine this opaque component in coarse particle samples. For details see the Methods section. The classification of particles and the calculation of the corresponding mass have been described by CitationSchultz (1993,1994), CitationSchultz et al. (1999), and in the German Guideline for Ambient Air Measurement CitationVDI 2119 (2011).
The content of black particles in PM2.5 samples was optically determined by measuring the light attenuation and interpreting total extinction as a gauge for black carbon (BC) according to CitationBallach et al. (2001). For more details also see the Methods section. The fraction of fine transparent particles was then obtained by subtracting the BC content from the total PM2.5 mass.
On this basis, particulate matter was defined as follows:
| • | “Transparent fine,” mainly from photochemical processes (secondary aerosol) typically composed of nitrates and sulfates. | ||||
| • | “Black fine,” mainly combustion products (soot) containing highly absorbing black carbon (BC). | ||||
| • | “Transparent coarse,” minerals (mainly soil particles) or biological particles (mainly fungal spores or plant debris). | ||||
| • | “Opaque coarse,” decreasingly consisting of combustion particles, for example, fly ash and increasingly rubber fragments from tire wear. | ||||
| • | “Transparent giant,” minerals (mainly soil particles) or biological particles (mainly pollen, plant debris). | ||||
| • | “Opaque giant,” nearly exclusively from tire wear. | ||||
Detailed information on the origin and specification may be found, for example, in:
| 1. | In CitationBalasubramanian and Qian (2003), CitationChen et al. (2003), CitationBell et al. (2007), and CitationQuerol et al. (2001) for fine particles. | ||||
| 2. | In CitationWilson and Shuh (1997), CitationSchultz et al. (1999), CitationMaykut et al. (2003), and CitationHüglin et al. (2005) for coarse particles. | ||||
| 3. | In CitationNoll and Pilat (1971), CitationSchultz (1993), and CitationSchultz (1994) for giant particles. | ||||
Traffic-related offset
The linear regression of paired values of the particle concentration measured at a “backyard” site (x) and a traffic site (y) usually shows an offset “b” for x = 0. This offset can be interpreted as the additional particle load found at the traffic site due to the direct impact of traffic emissions including particulate car exhausts and particle resuspension from road surfaces, as well (see ).
Figure 1. Paired concentration values from sites of different characteristics and the traffic related offset “b” deduced from the corresponding regression line.
The relation is defined by the equation
where y is the concentration at traffic related sites, x is the concentration at “backyard” sites, a is the slope, and b is the offset.
Study Design
The sampling sites are grouped in sets of three sites, each characterized by different source conditions and the distance to a nearby main road (Tables ). The source conditions of the sampling sites chosen were uniformly classified by the following scheme:
Table 3. Measuring sites at Buenos Aires
Table 4. Measuring sites at Berlin
Table 5. Measuring sites in German spas with population >10,000 (spa towns)
Table 6. Measuring sites in German spas with population <10,000 (spa villages)
| 1. | “Traffic,” downtown sites, mainly influenced by the car emissions of a nearby road. | ||||
| 2. | “Backyard,” downtown sites, shielded against direct traffic emission by a row of houses and/or trees or bushes. | ||||
| 3. | “Urban background,” peripheral sites located in an open area and only influenced by diffusive emissions from various sources upwind of the station. | ||||
The sites (1) and (2) were always chosen as “twin” sites with an average distance of about 200 m ().
Figure 2. Map of Germany with the location of Berlin and the German spas involved in this study.
Methods
Particle sampling
Coarse/giant particles
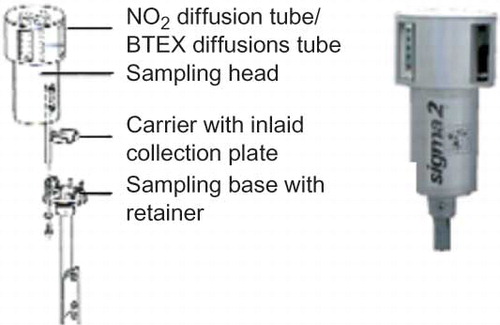
Atmospheric particles of dvol > 2.5 µm were sampled with the passive sampling device Sigma-2. The Sigma-2 sampler consists of a tube and a cap on top (see ). Both parts, cap and tube, show four windows each. These windows are arranged at the same level but twisted against one another, preventing the passage of ambient air and providing protection from precipitation. The housing functions as a stilling chamber, so that settable particles entering the interior will settle in calm air on a sticky collection plate at the bottom of the tube. The highly transparent plates are suitable for optical single particle analysis. A more detailed description of the technique is given in VDI 2119 (2011).
Figure 3. Sedimentation sampler Sigma-2 for coarse/giant particle sampling.
Fine particles
Fine particles of dae< 2.5 µm aerodynamic diameter were sampled from ambient air with a mini-volume sampler equipped with a size-selective air inlet according to the PM2.5 convention (see ). Atmospheric particles passing this inlet were separated on a glass-fiber filter suitable for gravimetric analysis of total particle mass and optical analysis of elemental carbon according to CitationBallach et al. (2001). The flow rate was 200 L/hr.
Figure 4. Mini-volume sampler for PM2.5 sampling.
Sampling period
The sampling period for both fine and coarse/giant particle sampling was 1 week. In these intervals the exposed collection filters and plates were regularly removed and exchanged by unloaded filters and unloaded plates. The fine and coarse/giant particle samples were sealed in dust-tight boxes and shipped to the German Meteorological Service laboratories in Freiburg, Germany, for subsequent particle analysis.
Particle analysis and calculation of results
Coarse/giant particles
Exposed collection plates were analyzed by automated light microscopy. For imaging, a motorized ZEISS Axioplan microscope was used. Objective magnification was chosen at 20×. The microscope was coupled with the IMATEC image processing system Digitrace. The images (see as an example) were recorded by a high-resolution CCD camera providing information at 2580 × 1936 pixels. Deposited particles were automatically focused by the PRIOR Scientific autofocus system. A fully automated microscopy was achieved by the computer-controlled Märzhäuser scanning stage.
Figure 5. Scanning light microscope image of particles collected at the Universidad de Flores during the week 23/2006: (a) particle sample of the traffic related site, (b) particle sample of the “backyard” site.
This instrumentation provided the automatic measurement of the projected area (geometric equivalent diameter) and of the optical density (mean gray value) of individual coarse particles. From these data a size fractionated number deposition rate and a mass deposition rate of total coarse particles was determined. The particle mass was calculated, assuming a spherical shape and a unit density of 1 g cm-3 for all particles deposited. Subsequently, the particle concentration was calculated by approximating the particle deposition velocity in the interior of the sampler by the terminal settling velocity according to Stokes's law (CitationHinds, 1982). Finally, the single particle data were used to discriminate between low-absorbing mineral or biological particles (transparent) and highly absorbing mostly carbonaceous (opaque) particles. Deposited, by definition “opaque,” particles were separated from the “transparent” particle fraction by applying a gray value threshold level. This threshold level was experimentally established by means of manually operated single-particle measurements, guided by an experienced microscopist.
The particle concentration was calculated for certain intervals. The numerical concentration data presented in the following refer to size ranges of 2.5–10 (coarse) and 10–34 µm (giant). Size distributions, on the other hand, are presented for the size range between 2.5 and 160 µm.
Fine Particles
The mass concentration of particles of dae ≤ 2.5 µm (PM2.5) was gravimetrically determined by weighing filters prior and after sampling with the mini-volume sampler MiniVS. Before weighing, the filters were equilibrated for 2 weeks in an air-conditioned weighing chamber at a definite air temperature of 22 ± 0.1°C and a relative air humidity of 40 ± 1.0%. This treatment achieved the almost constant weight of filters.
After gravimetric analysis, the black carbon content was determined by the immersion technique after CitationBallach et al. (2001). For this purpose, punches of 5 mm in diameter were taken and embedded by an immersion liquid of n d20° = 1.52, matching both the refractive index of the glass-fiber filters and most mineral and biological particles. Through this approach the light attenuation measured is almost entirely due to the absorption of highly absorbing components, mainly consisting of elemental carbon. Light attenuation of loaded and blank filters was measured by the Specord 50 spectrometer of Analytik Jena Ltd, Germany. From these data, the BC concentration was calculated by using an analysis function given also by CitationBallach et al. (2001).
Results and Discussion
Regional variations
The statistical features of the fine, coarse, and giant particle concentrations are presented in and The statistics of the particle burden are displayed in box plots, which are set up so as to account for the different study areas and site characteristics. The bottom and top of the boxes represent the 25th and the 75th percentiles. The horizontal bar inside gives the arithmetic mean. The outside vertical whiskers show the 5th and 95th percentiles. The presentation distinguishes between transparent and black/opaque particles.
Figure 6. The concentration of transparent particles in Buenos Aires, in Berlin, and in German spas separately for spa towns and spa villages.
Figure 7. Concentration of black (PM2.5) and opaque (coarse and giant) particles in Buenos Aires, in Berlin, and in German spas separately for spa towns and spa villages.
These box plots show a decrease of particle concentration as a function of population with highest values in Buenos Aires and lowest at the spa village. An exception is given by the transparent fraction of PM2.5. The mean concentration of fine transparent particles in Buenos Aires clearly ranges below that of Berlin and surprisingly almost corresponds to that of the German spas. The comparably low level in Buenos Aires is probably due to a missing regional particle plume (CitationReich et al., 2009). Such a plume is formed over Central Europe, most frequently because of durable anticyclonic and dry weather conditions (CitationQuerol et al., 2001; CitationWolf-Benning et al., 2009). In comparison to Berlin, Buenos Aires seems to profit from a lower large-scale emission level due to the lower population rate of the surrounding area and a lower motorization rate that is only one-third of Germany's.
On the other hand, local emissions seem of much higher importance in Buenos Aires. In comparison with Germany, a higher particle level at first is evident for the transparent coarse/giant particles. This presumably reflects an elevated resuspension of mineral particles, which is favored by the dry winter conditions. The most remarkable local effect in Buenos Aires is shown by the high level of fine black particles (BC). In Germany, BC particles obviously do not show a corresponding difference between sites close to and distant from roads. This can be explained by generally higher particle emissions of diesel cars in Buenos Aires. BC in PM2.5 can serve as an indicator of diesel emissions (CitationHoek et al., 2002; CitationKinney et al., 2000; CitationRoemer and Wijnen, 2001). In Buenos Aires the huge number of diesel-driven buses and trucks can be considered as the major source of these particles. Existing regulations seem to be of little effect on busses. One problem may be the age of the vehicle pool.
Time-based information is given as examples in terms of the course of fine black and giant opaque particle concentration as shown in and During the whole measuring period the already-mentioned increased BC in Buenos Aires was observed compared to Berlin and the German spas. The similar conditions in Argentina and Germany with regard to giant opaque particles may be explained by the comparable strength of the involved source in both countries, that is, tire wear. No regulations exist for these particles because their release technically can hardly be controlled, so far.
Figure 8. Annual course of concentration of fine black particles (BC).
Figure 9. Annual course of concentration of giant opaque particles (10–34 µm).
By a comparison of the black/opaque particle concentration between traffic and background sites, another interesting effect becomes evident. In this context, it has to be noted that for this comparison urban background sites and “backyard” sites were banded together into one group. The ratio of the two remaining site groups ranges between 1.7 and 2.0 for BC in the fine particles and between 1.7 and 4.3 for the opaque giant particles (), indicating again the more homogeneous dispersal of fine particles. This ratio increases with the decrease in population by trend. This effect can be explained by the lower number of corresponding anthropogenic particle sources in rural areas.
Table 7. Statistical features of particle concentration measured
Identification and assessment of particle sources
Size distribution
Particle sources are characterized by the specific size distribution of particles released. Mechanically generated particles show a maximum of mass concentration in the coarse mode (CitationHinds, 1982). In contrast, particles originating from combustion or photochemical processes show a maximum of size distribution in the fine range. With growing distance from the source and with increasing atmospheric residence time, the maximum will move toward larger particle sizes in the PM2.5 fraction due to particle growth by accumulation. The maximum in the coarse range, on the other hand, will move toward smaller sizes due to particle losses by deposition.
Particle sizing by light microscopy provided the common size distribution of coarse and giant particles. Corresponding size distributions refer to particles in the size range between 2.5 to 160 µm in geometric diameter. The graphs in and represent the size distribution of transparent and opaque particles sampled in the urban area of Buenos Aires (Universidad de Flores) and Berlin (Friedrichstraße), in a spa town of about 13,000 inhabitants, and at a small spa village of about 1000 inhabitants. The sites chosen at these places have the characteristics of traffic, “backyard,” and urban background as specified earlier.
Figure 10. Size distribution of coarse and giant transparent particles in the urban area of Buenos Aires and of Berlin and under rural conditions at two representative German spas. The scale of the y-axis was differently chosen corresponding to occurring concentration: (a) Universidad de Flores; (b) Berlin, downtown; (c) spa town; (d) spa village.
Figure 11. Size distribution of coarse and giant opaque particles in the urban area of Buenos Aires and Berlin and under rural conditions at two representative German spas. The scale of the y-axis was differently chosen corresponding to occurring concentrations: (a) Universidad de Flores; (b) Berlin, downtown; (c) spa town; (d) spa village.
The size distributions of these locations show the expected differences in particle concentration level and in shape of the size distribution. As a typical finding, the size distribution of both cities show a maximum in mass concentration around 20 µm, thus indicating the impact of particle resuspension from paved surfaces, for example. In the spa village, this resuspension is only shown for opaque particles at the traffic site, suggesting tire abrasion as the locally most important source (CitationMarcazzan et al., 2001).
The similarities between the big cities, on the other hand, disappear if the size distributions of coarse opaque particles are compared (). The size distribution of opaque particles in Buenos Aires shows only one peak, while the distributions of Berlin show two peaks and no clear decrease toward smaller particles. The reason probably is the impact of opaque particle sources in addition to traffic. As a major source, residential heating in winter can be assumed in Central Europe. However, an increased level of BC (black particles in PM2.5) in Berlin compared to Buenos Aires, which was expected from the shape of the size distribution (), was not confirmed by the PM2.5 measurement. Instead, Berlin and even more the German spas show a lower total BC content than Buenos Aires ( and ). The higher BC values in Buenos Aires suggest the diesel emissions as the major source.
In conclusion, the shape of established size distributions can provide valuable information about involved sources. One striking example is given by opaque giant particles. They are almost entirely originating from tire wear and can be used as a unique tracer for traffic emissions (CitationPerez et al. 2010; CitationSchultz, 1993).
Transparent particles, mostly mineral ones, are released by wind suspension (natural) and indicated by human activities like traffic (anthropogenic). The shape of size distributions from urban and rural conditions, therefore, was not expected to differ markedly. Actually, there is a difference. Rural spas, for example, do not show such a pronounced resuspension peak for transparent particles, at least offside roads, whereas in Berlin and particularly in Buenos Aires this peak is detectable at all sites, even at a greater distance from roads. The reason probably is the generally higher particle resuspension in urban areas due to a higher percentage of paved surfaces. Paved surfaces are highly prone to wind erosion mobilising deposited mineral dust.
Traffic-induced offset
Traffic emissions can be considered as the main particle source in urban areas. Black/opaque particles can serve as a tracer of these emissions. For an estimate of local traffic emissions, the traffic-related offset of particle concentration was determined. This offset was extracted from the regression analysis of paired values of the particle concentration measured in parallel, at the traffic site (y) and at a co-located site at an adjacent “backyard” (x). The offset on the ordinate at x = 0 is interpreted as the traffic-induced excess of particle concentration. For better understanding a graph is given in the Definitions section.
is a graph presenting the averages of traffic-induced offset values calculated for Buenos Aires, Berlin, and German spas. The presentation immediately shows the difference between transparent and black/opaque particles, with clearly higher values for the latter. The reason for this difference, in the fine and coarse as well as in the giant range, probably is the almost exclusive origin through traffic emissions, whereas the transparent particles can originate both from anthropogenic and from natural sources. Due to contributing natural sources, the traffic-induced offset of transparent particles appears lower and, in addition, shows a smaller increase with particle size, thus reflecting the more spatial distribution of transparent particles, both in the coarse and the fine fraction.
Figure 12. Traffic-related offset of transparent (fine, coarse, and giant) particles as well as black (PM2.5) and opaque (coarse and giant) particles at chosen traffic sites of the different investigation areas in relation to corresponding “backyard” sites.
Beyond that, the offset values show a clear dependency on particle size. The lowest offset value occurs in the fine particle fraction. The more diffusive source conditions of transparent particles and the higher atmospheric residence time of their fine fraction result in a lower offset in contrast to black particles, irrespective of the investigation area. In contrast, the black particles show significantly higher offset values. This can be explained by the linear character of traffic emissions. As expected, the highest offset is shown by the giant particles, and here in particular by the opaque ones, which mainly consist of tire particles.
The highest by far offset value is found in rural spas. This effect is probably due to the existence of only one significant source of traffic emissions, that of through traffic. The lack of any further important traffic emissions brings about a rapid decline of particle concentration aside of through roads.
Decline of traffic emissions
Based on the particle concentration measured at traffic sites and the corresponding “backyard” and background sites, the relative decline of the emissions was calculated. The decline is presented as the percentage of particle concentration at the “backyard” and background sites in relation to the corresponding traffic site (100%).
In and the decline of transparent and black/opaque particle concentration is presented for the fine and coarse particle fraction. The numerical data are summed up in .
Table 8. Relative decline of pollution at sites not directly affected by traffic (“backyard” and background sites) in comparison to a neighboring road (traffic site) in Buenos Aires, in Berlin, and in German spas including both spa towns and spa villages
Figure 13. Relative decline of black (PM2.5) and transparent (PM2.5) particles shown in the upper row as well as opaque (coarse) and transparent (coarse) particles shown in the lower row at sites not directly affected by traffic (“backyard” site) as function of the distance (class) to a nearby main road (traffic site) in Buenos Aires, in Berlin, and in German spas (spa towns and spa villages).
Figure 14. Relative decline of PM2.5 and coarse particles, with black (PM2.5) and opaque (coarse) particles shown in the upper row and transparent PM2.5 and transparent coarse particles shown in the lower row at sites not directly affected by traffic (“backyard” sites) as function of the distance (class) to a nearby main road (traffic site) in Buenos Aires, in Berlin, and in German spas (spa towns and spa villages).
For direct comparison, the decline curves of transparent/black/opaque and fine/coarse particles, respectively, are arranged in one graph ( and ). These presentations show that the decline varies considerably, depending on the investigation areas. The corresponding decline functions are given in . The course of the decline was expected to be primarily a function of the particle size (fine, coarse, giant) and of composition (transparent, black/opaque). The decline was anticipated to be more marked for coarse particles and less so for the fine particles, and also greater for the black/opaque than for the transparent particles.
Table 9. Equations of best-fit curves for the relative decline of particles at sites not directly affected by traffic (“backyard” site) as a function of the distance (class) to a nearby main road (traffic site) in Buenos Aires, in Berlin, and in German spas including both spa towns and spa villages
Comparison of transparent and black/opaque particles
The comparison actually shows a quicker decline for black/opaque than for transparent particles, both for fine and for coarse particles, irrespective of the investigation area (). However, there are clear deviations. The difference between Berlin and Buenos Aires in the fine particle fraction is remarkable. The difference in decline between both components is great in Berlin and nearly negligible in Buenos Aires. The rural spas in Germany range in the middle. The situation in Berlin is very probably due to the high background concentration of fine transparent particles, while the fine black particles significantly decrease, indicating local traffic as the main source. In Buenos Aires, in contrast, both components show a rapid decline, indicating the effect of only local sources.
In the coarse particle fraction, conditions are somehow inverted. In Buenos Aires, the only small decline of transparent probably is the result of a high background concentration due to natural resuspension. The German spas show similar figures also indicating a relatively high natural dust burden in the background, too.
Comparison of fine and coarse particles
Next, the decline of fine and of coarse particles is compared (). The comparison shows considerable differences again depending on the area investigated. The expected faster decline of coarse particles is found in Berlin only, for both black/opaque and transparent particles. In the German spas there are no differences between the size fractions of black/opaque and of transparent particles; the decline curves rather overlap each other. In Buenos Aires, the fine particles, in contrast, show a faster decline. This surprising finding applies to transparent particles in particular. This probably is due to the apparent lack of a particle plume on the one hand, and to the increased resuspension of coarse particles on the other hand. This again indicates an effect of the dry conditions in Buenos Aires, particularly in winter, and a corresponding, spatially uniform burden of mineral dust.
Implications for an estimate of individual particle exposure
The differences found regarding the behaviour of fine, coarse, and giant particles, as well as the transparent and black/opaque component, most likely have an important influence on estimates regarding the effect of the exposure of individuals to particle pollution. This aspect is of particular importance when health studies are based only on the particle data of a stationary sampling network. Basically, fine particle (PM2.5) concentration can be expected to be spatially more representative than the concentration of coarse particles as a result of their longer atmospheric residence time. However, the study demonstrates that source characteristics and climate factors, too, should be taken into consideration when estimating the effect of an individual particle exposure.
Conclusions
From the findings presented the following conclusions can be drawn:
| - | An overview of effective particle sources in the urban environment was achieved by parallel sampling of fine, coarse, and giant particles. | ||||
| - | Light-microscopic single-particle analysis of coarse and giant particles allows the fast discrimination of transparent and opaque particles as the major components. | ||||
| - | Light-microscopic measurement of individual particles provided the data to establish separate size distributions of transparent and opaque particles. | ||||
| - | From the enhanced, widely uniform level of fine transparent particles in Berlin, the formation of regional particle plumes by photochemical processes can be deduced. | ||||
| - | Buenos Aires, in contrast, is characterized by a lower background level of fine transparent particles almost comparable to that of German spas. | ||||
| - | Local air quality of Buenos Aires, on the other hand, shows an increased level of fine black particles due to the diesel emissions and of coarse mineral particles from the resuspension of soil particles. | ||||
| - | The decline functions given may be useful for a better estimate of the spatial particle distribution and the individual particle burden in epidemiologic studies. | ||||
| - | The segregation of fine and coarse/giant and of transparent and black/opaque particles is believed to provide important information for an air quality assessment and seems to be meaningful for health studies. | ||||
Acknowledgments
This work is based on the results of research projects funded by the German Science Foundation (DFG) grants EN 138/14 and SCH 1515/2 and by the German Spa Association (Deutscher Bäderverband). The authors gratefully acknowledge the financial support of these projects by these institutions. Furthermore, the authors thank Marlén Müller, Humboldt-Universität zu Berlin, for conducting and supervising the particle sampling at Buenos Aires and providing the precipitation data; Mathieu Fricker, German Meteorological Service, Freiburg, for supervising the sampling and carefully carrying out the analysis; Marcelina Arkouli, Universität Stuttgart, for scientific and practical help during the field work in Buenos Aires; and Argentine project partners at Buenos Aires:
| • | Prof. Lic. Laura Dawidowski, Comisión Nacional de Energía Atómica for scientific and technical support. | ||||
| • | Prof. Dr. Ana Maria Faggi de Lenz, Facultad de Ingeniería Ecológica, Universidad de Flores for scientific and practical help in particle sampling. | ||||
| • | Prof. Dr. Ana Graciela Ulke, Instituto de Meteorología, Universidad de Buenos Aires for scientific advice in the field of local and regional meteorology. | ||||
The authors thank the Servicio Meteorológico Nacional de Argentina for providing the climate data of Buenos Aires. The following institutions in Buenos Aires permitting the installation and operation of the particle samplers on their property: Hospital Alemán, Universidad de Flores, Aguas Argentinas, and Servicio Meteorológico Nacional de Argentina.
References
- Amt für Statistik Berlin Brandenburg 2001, Die kleine Berlin-Statistik. 2011. http://www.statistik-berlin-brandenburg.de/produkte/KleineStatistik/aP_KleineStatistik_ DE_2011_BE.pdf (http://www.statistik-berlin-brandenburg.de/produkte/KleineStatistik/aP_KleineStatistik_ DE_2011_BE.pdf)
- Balasubramanian , R. and Qian , W.-B. 2003 . Comprehensive characterization of PM2.5 aerosols in Singapore . J. Geophys. Res. , 108 ( D16 ) : AAC 7–1 – 7–17 . doi: 10.1029/2002JD002517
- Ballach , J. , Hitzenberger , R. , Schultz , E. and Jaeschke , W. 2001 . Development of an improved optical transmission technique for black carbon (BC) analysis . Atmos. Environ. , 35 : 2089 – 2100 . doi: 10.1016/S1352-2310(00)00499-4
- Bell , M.L. , Dominici , F. , Ebisu , K. , Zeger , S.L. and Samet , J.M. 2007 . Spatial and temporal variation in PM2.5 chemical composition in the United States for health effects studies . Environ. Health Perspect. , 115 : 989 – 995 . doi: 10.1289/ehp.9621
- Cesaroni , G. , Badaloni , C. , Porta , D. , Forastiere , F. and Perucci , C.A. 2008 . Comparison between various indices of exposure to traffic-related air pollution and their impact on respiratory health in adults . Occup. Environ. Med. , 65 ( 10 ) : 683 – 690 . doi: 10.1136/oem.2007.037846
- Chen , A.L.-W. , Chow , J.C. , Doddridge , B.G. , Dickerson , R.R. , Ryan , W.F. and Mueller , P.K. 2003 . Analysis of a summertime PM2.5 and haze episode in the mid-atlantic region . J. Air Waste Manage. Assoc. , 53 : 946 – 956 . doi: 10.1080/10473289.2003.10466240
- Clark , N. , Demers , P. , Karr , C. , Koehoorn , M. , Lencar , C. , Tamburic , L. and Brauer , M. 2010 . Effect of early life exposure to air pollution on development of childhood asthma . Environ. Health Perspect. , 118 ( 2 ) : 284 – 290 .
- Filleul , L. , Rondeau , V. , Vandentorren , S. , Moual , N.L. , Cantagrel , A. , Annesi-Maesano , I. , Charpin , D. , Declercq , C. , Neukirch , F. , Paris , C. , Vervloet , D. , Brochard , P. , Tessier , J.-F. , Kauffmann , F. and Baldi , I. 2005 . Twenty five year mortality and air pollution: Results from the French PAARC survey . Occup. Environ. Med. , 62 : 453 – 460 . doi: 10.1136/oem.2004.014746
- Framiñan , M.B. and Brown , O.B. 1996 . Study of the Río de la Plata turbidity front, Part 1: Spatial and temporal distribution . Cont. Shelf Res. , 16 ( 10 ) : 1259 – 1282 . doi: 10.1016/0278-4343(95)00071-2
- Giménez , L. , Borthagaray , A.I. , Rodríguez , M. , Brazeiro , A. and Dimitriadis , C. 2005 . Scale-dependent patterns of macrofaunal distribution in soft-sediment intertidal habitats along a large-scale estuarine gradient . Helgol Mar. Res. , 59 : 224 – 236 . doi: 10.1007/s10152-005-0223-9
- Hinds , W.C. 1982 . Aerosol Technology , New York : John Wiley & Sons .
- Hoek , G. , Meliefste , K. , Cyrys , J. and Lewné , M. 2002 . Spatial variability of fine particle concentrations in three European areas . Atmos. Environ. , 36 : 4077 – 4088 . doi: 10.1016/S1352-2310(02)00297-2
- Hüglin , C. , Gehrig , R. , Baltensperger , U. , Gysels , K. , Monn , C. and Vonmont , H. 2005 . Chemical characterisation of PM2.5, PM10 and coarse particles at urban, near-city and rural sites in Switzerland . Atmos. Environ. , 39 : 637 – 651 . doi: 10.1016/j.atmosenv.2004.10.027
- Katsouyanni , K. 2001 . Confounding and effect modification in the short-term effects of ambient particles on total mortality: Results from 29 European cities within the APHEA2 project . Epidemiology , 12 ( 5 ) : 521 – 531 . doi: 10.1097/00001648-200109000-00011
- Kinney , P.L. , Aggarwal , M. , Northridge , M.E. , Jansen , N.A.H. and Shepard , P. 2000 . Airborne concentrations of PM(2.5) and diesel exhaust particles on harlem sidewalks: A community-based pilot study . Environ. Health Perspect. , 108 ( 3 ) : 213 – 218 . doi: 10.2307/3454436
- Künzli , N. , Kaiser , R. , Medina , S. , Studnicka , M. , Chanel , O. , Filliger , P. , Herry , M. , Horak , F. , Puybonnieux-Texier , V. , Quénel , P. , Schneider , J. , Seethaler , R. , Vergnaud , J.-C. and Sommer , H. 2000 . Public-health impact of outdoor and traffic-related air pollution: A European assessment . Lancet. , 356 ( 9232 ) : 795 – 801 . doi: 10.1016/S0140-6736(00)02653-2
- Laden , F. , Neas , L.-M. , Dockery , D.W. and Schwartz , J. 2000 . Association of fine particulate matter from different sources with daily mortality in six U.S. cities . Environ. Health Perspect. , 108 ( 10 ) : 941 – 947 . doi: 10.1289/ehp.00108941
- Lipfert , F.W. and Wyzga , R.E. 1995 . Air pollution and mortality: Issues and uncertainties . J. Air Waste Manage. Assoc. , 45 : 949 – 966 . doi: 10.1080/10473289.1995.10467427
- Marcazzan , G.M. , Vaccaro , S. , Valli , G. and Vecchi , R. 2001 . Characterisation of PM10 and PM2.5 particulate matter in the ambient air of Milan (Italy) . Atmos. Environ. , 35 : 4639 – 4650 . doi: 10.1016/S1352-2310(01)00124-8
- Maykut , N.N. , Lewtas , J. , Kim , E. and Larson , T.V. 2003 . Source apportionment of PM2.5 at an urban improve site in Seattle, Washington . Environ. Sci. Technol. , 37 ( 22 ) : 5135 – 5142 . doi: 10.1021/es030370y
- Miller , K.A. , Siscovick , D.S. , Sheppard , L. , Shepherd , K. , Sullivan , J.H. , Anderson , G.L. and Kaufman , J.D. 2007 . Long-term exposure to air pollution and incidence of cardiovascular events in women . N. Engl. J. Med. , 356 ( 5 ) doi: 10.1056/NEJMoa054409
- Noll , K.E. and Pilat , M.J. 1971 . Size distribution of atmospheric giant particles . Atmos. Environ. , 5 : 527 – 540 . doi: 10.1016/0004-6981(71)90063-1
- Ostro , B.D. , Hurley , S. and Lipsett , M.J. 1999 . Air pollution and daily mortality in the Coachella valley, California: A study of PM10 dominated by coarse particles . Environ. Res. , 81 ( 3 ) : 231 – 238 . doi: 10.1006/enrs.1999.3978
- Perez , N. , Pey , J. , Cusack , M. , Reche , C. , Querol , X. , Alastuey , A. and Viana , M. 2010 . Variability of particle number, black carbon, and PM10, PM2.5, and PM1 levels and speciation: influence of road traffic emissions on urban air quality . Aerosol Sci. Technol. , 44 : 487 – 499 .
- Querol , X. , Alastuey , A. , Rodrìgez , S. , Plana , F. , Ruiz , C. , Cots , N. , Massegué , G. and Puig , O. 2001 . PM10 and PM2.5 source apportionment in the Barcelona Metropolitan area, Catalonia, Spain . Atmos. Environ. , 35 : 6407 – 6419 . doi: 10.1016/S1352-2310(01)00361-2
- Reich , S.L. , Robledo , F. , Gomez , D. and Smichowski , P.G. 2009 . Air pollution sources of PM10 in Buenos Aires City . Environ. Monitor. Assess. , 155 : 191 – 204 . doi: 10.1007/s10661-008-0428-x
- Roemer , W.H. and Wijnen , J.H.V. 2001 . Differences among black smoke, PM(10) and PM(1.0) levels at urban measurement sites . Environ. Health Perspect. , 109 ( 2 ) : 151 – 154 . doi: 10.2307/3434768
- Samet , J.M. , Dominici , F. , Curriero , F.C. , Coursac , I. and Zeger , S.L. 2000 . Fine particulate air pollution and mortality in 20 U.S. cities, 1987–1994 . N. Engl. J. Med. , 343 ( 24 ) : 1742 – 1749 . doi: 10.1056/NEJM200012143432401
- Schultz , E. 1993 . Size-fractionated measurement of coarse black carbon particles in deposition samples . Atmos. Environ. , 27A ( 8 ) : 1241 – 1249 . doi: 10.1016/0960-1686(93)90250-3
- Schultz , E. 1994 . Size fractionated determination of black carbon particles in airborne dust originating from highway traffic . Sci. Tot. Environ. , 146 ( 147 ) : 289 – 296 . doi: 10.1016/0048-9697(94)90248-8
- Schultz , E. , Alessandro , M. and Endlicher , W. 1999 . A two years air pollution survey in Gran Mendoza, Argentina – analysis, spatial distribution and seasonal variations of traffic related pollutants . MERIDIANO—Revista De Geographia. , 7 : 102 – 118 .
- Schwarz , J. 1999 . Air pollution and hospital admissions for heart disease in eight U.S. counties . Epidemiology , 10 ( 1 ) : 17 – 22 .
- Senatsverwaltung. 2006. Mobilität der Stadt - Mobilitätsentwicklung. Senatsverwaltung, Amt für Statistik Berlin-Brandenburg, (Amtliche Bevölkerungsfortschreibung), LABO Berlin, Kraftfahrzeugwesen.
- Smichowski , P.G. , Darío , R. , Dawidowski , L.E. , Giné , A. , ánchez , C. S and Reich , S.L. 2004 . Monitoring trace metals in urban aerosols from Buenos Aires city. determination by plasma-based techniques . J. Environ. Monit. , 6 : 286 – 294 . doi: 10.1039/b312446k
- Tarela , P. and Perone , E. 2002 . Air Quality Modeling of the Buenos Aires Metropolitan Area http://www.scribd.com/doc/1872482/Environmental-Pro tection-Agency-argentinafinalreport
- Umweltbundesamt. 2010 http://www.umweltbundesamt-daten-zur-umwelt.de/umweltdaten/public/theme.do?nodeIdent=2332 (http://www.umweltbundesamt-daten-zur-umwelt.de/umweltdaten/public/theme.do?nodeIdent=2332)
- VDI 2119 Draft. 2011. Ambient air measurement—Passive sampling of coarse dust for characterising single particles and calculating the size-fractionated mass concentration. Berlin: Beuth Verlag www.vdi.de/2119 (http://www.vdi.de/2119)
- Viana , M. , Kuhlbusch , T.A.J. , Querol , X. , Alastuey , A. , Harrison , R.M. , Hopke , P.K. , Winiwarter , W. , Vallius , M. , Szidat , S. , Prévôti , A.S.H. , üglin , C. H , Bloemen , H. , åhlin , P. W , Vecchim , R. , Miranda , A.I. , Kasper-Giebl , A. , Maenhautp , W. and Hitzenberger , R. 2008 . Source apportionment of particulate matter in Europe: A review of methods and results . J. Aerosol Sci. , 39 ( 10 ) : 827 – 849 . doi: 10.1016/j.jaerosci.2008.05.007
- World Health Organization. 2003. Health aspects of air pollution with particulate matter, ozone and nitrogen dioxide. Bonn, Germany: World Health Organization http://www.euro.who.int/document/e79097.pdf (http://www.euro.who.int/document/e79097.pdf)
- World Health Organization . June 2004 . Health aspects of air pollution—Results from the WHO Project “Systematic review of health aspects of air pollution in Europe.” , June , World Health Organization .
- Wichmann , E.-H. and Peters , A. June 2002 . Ultrafine particles: Characterization, health effects and pathophysiological mechanisms , June , Rochester , NY : U.S. EPA Particulate Matter Center Report .
- Wilson , W.E. and Shuh , H.H. 1997 . Fine and coarse particles: Concentration relationship relevant to epidemiological studies . J. Air Waste Manage. Assoc. , 47 ( 12 ) : 1238 – 1249 . doi: 10.1080/10473289.1997.10464074
- Wolf-Benning , U. , Draheim , T. and Endlicher , W. 2009 . Spatial and temporal differences of particulate matter in Berlin . Int. J. Environ. Waste Manag. , 4 ( 1–2 ) : 3 – 16 .
- Zanobetti , A. , Schwartz , J. and Dockery , D.W. 2000 . Airborne particles are a risk factor for hospital admissions for heart an d lung disease . Environ. Health Perspect. , 108 ( 11 ) : 1071 – 1077 . doi: 10.1289/ehp.001081071