Abstract
As part of the 2010 Van Nuys tunnel study, researchers from the University of Denver measured on-road fuel-specific light-duty vehicle emissions from nearly 13,000 vehicles on Sherman Way (0.4 miles west of the tunnel) in Van Nuys, California, with its multispecies Fuel Efficiency Automobile Test (FEAT) remote sensor a week ahead of the tunnel measurements. The remote sensing mean gram per kilogram carbon monoxide (CO), hydrocarbon (HC), and oxide of nitrogen (NOx) measurements are 8.9% lower, 41% higher, and 24% higher than the tunnel measurements, respectively. The remote sensing CO/NOx and HC/NOx mass ratios are 28% lower and 20% higher than the comparable tunnel ratios. Comparisons with the historical tunnel measurements show large reductions in CO, HC, and NOx over the past 23 yr, but little change in the HC/NOx mass ratio since 1995. The fleet CO and HC emissions are increasingly dominated by a few gross emitters, with more than a third of the total emissions being contributed by less than 1% of the fleet. An example of this is a 1995 vehicle measured three times with an average HC emission of 419 g/kg fuel (two-stroke snowmobiles average 475 g/kg fuel), responsible for 4% of the total HC emissions. The 2008 economic downturn dramatically reduced the number of new vehicles entering the fleet, leading to an age increase (>1 model year) of the Sherman Way fleet that has increased the fleet's ammonia (NH3) emissions. The mean NH3 levels appear little changed from previous measurements collected in the Van Nuys tunnel in 1993. Comparisons between weekday and weekend data show few fleet differences, although the fraction of light-duty diesel vehicles decreased from the weekday (1.7%) to Saturday (1.2%) and Sunday (0.6%).
On-road remote sensing emission measurements of light-duty vehicles on Sherman Way in Van Nuys, California, show large historical emission reductions for CO and HC emissions despite an older fleet arising from the 2008 economic downturn. Fleet CO and HC emissions are increasingly dominated by a few gross emitters, with a single 1995 vehicle measured being responsible for 4% of the entire fleet's HC emissions. Finding and repairing and/or scrapping as little as 2% of the fleet would reduce on-road tailpipe emissions by as much as 50%. Ammonia emissions have locally increased with the increasing fleet age.
Introduction
The United States' love affair with the automobile has produced a myriad of both positive and negative consequences. As vehicle densities grew in many cities during the 20th century, so did concern about vehicle emissions. That concern resulted in rules and regulations that have contributed to reducing new vehicle emissions to very low levels. This in turn has helped to measurably improve urban air quality throughout the United States (CitationU.S. Environmental Protection Agency [EPA], 2008).
The University of Denver's introduction of an on-road vehicle emission measurement system coincided with a vigorous debate surrounding the disagreement between the then current vehicle emission computer models and emission measurements collected in a roadway tunnel in Van Nuys, California, in 1987 (CitationIngalls, 1989; CitationIngalls et al., 1989). The disagreements between the models and the on-road tunnel measurements could only be reconciled when the skewed nature of on-road vehicle emissions, caused by a few gross emitters, was taken into account (CitationHarley et al., 1993; CitationKnapp, 1994; CitationPierson et al., 1990). The changes incorporated into the models generally improved their abilities to model on-road emission data (CitationPierson et al., 1996).
It has been more than a decade since the last tunnel study and vehicle emission model intercomparison has taken place in the United States. In that time period California has updated its vehicle emission model several times and the EPA has released a brand new vehicle emission model (CitationCalifornia Environmental Protection Agency, 2010; CitationEPA, 2010). As part of the latest intercomparison, researchers from the University of Denver remotely measured vehicle tailpipe emissions on Sherman Way in Van Nuys, California, in advance of emission measurements in the Van Nuys tunnel (CitationFujita et al., 2012). This paper compares some of the statistical results from the measurement of individual vehicles, not available from the tunnel measurements that estimate the emissions of a fleet of vehicles.
Experimental Methods
The Fuel Efficiency Automobile Test (FEAT) remote sensor developed at the University of Denver was used in this study and has been extensively described in the literature (CitationBurgard et al., 2006a, Citation2006b). The instrument consists of a nondispersive infrared (NDIR) component for detecting carbon monoxide (CO), carbon dioxide (CO2), and hydrocarbons (HC), and a pair of dispersive ultraviolet (UV) spectrometers for measuring oxides of nitrogen (NOx; nitric oxide [NO] and nitrogen dioxide [NO2]), sulfur dioxide (SO2), and ammonia (NH3). The source and detector units are positioned on opposite sides of the road in a bistatic arrangement. Colinear beams of infrared (IR) and UV light are passed across the roadway into the IR detection unit, and are then focused onto a dichroic beam splitter, which serves to separate the beams into their IR and UV components. The IR light is then passed onto a spinning polygon mirror, which spreads the light across the four infrared detectors: CO, CO2, HC, and reference. The UV light is reflected off of the front surface of the dichroic mirror and is focused onto the end of a quartz fiber bundle that is attached with a Sub Miniature A fiber optic connector onto the side of the detector unit. The quartz fiber bundle is divided in two bundles carrying the UV signal to the two spectrometers. One spectrometer is aligned between 200 and 227 nm and measures NO, SO2, and NH3. The second spectrometer measures only NO2 via absorption bands around 438 nm.
The remote sensor measures vehicle exhaust gases as a ratio to exhaust CO2. The ratios are converted into fuel-specific emissions of grams of pollutant per kilogram of fuel by carbon balance after doubling the HC/CO2 ratio to account for tailpipe emitted carbon that has been lost due to the poor quantification of certain HC species by NDIR absorption (CitationBurgard et al., 2006a; CitationSinger et al., 1998). By doubling the HC/CO2 ratio, the fuel-specific HC emissions reported by FEAT are comparable to a measurement reported with a flame ionization detector. Quality assurance calibrations were performed as dictated in the field by the atmospheric conditions and traffic volumes using three certified gas mixtures (Scott Specialty Gases, Longmont, CO) containing 6% CO, 0.6% propane, 6% CO2, 0.3% NO, and 0.04% SO2 in nitrogen; 0.05% NO2 and 15% CO2 in air; and 0.1% NH3 with 0.6% propane in nitrogen. These calibrations account for day-to-day variations in instrument sensitivity and variations in ambient CO2 levels.
A freeze-frame video image of the license plate of each vehicle was recorded along with the emission measurements. The license plate information was used to obtain nonpersonal vehicle information from the California registration records. In addition to emission measurements, a pair of parallel infrared beams (Banner Industries, Minneapolis, MN) 6 feet apart and approximately 2 feet above the roadway was used to measure the speed and acceleration of the vehicles.
Results and Discussion
Vehicle emission measurements were collected for 4½ days, from Thursday, August 12, to noon Monday, August 16, 2010, generally between the hours of 8:30 a.m. and 4:00 p.m. in the 16600 block of Sherman Way. Sherman Way is a divided six-lane surface street in Van Nuys, California. The middle lane, of the three eastbound lanes, was closed for approximately 2.5 blocks before the monitoring location, forcing traffic into the innermost and outside lanes. The instrument was set up just east of Whitaker Avenue to monitor across a single eastbound lane (0° slope) that was closest to the curb. This location is approximately 0.4 miles west of the Van Nuys Airport tunnel. License plates that appeared to be in state and readable were matched against the State of California Department of Motor Vehicles records to obtain the vehicle make and model year. The remote sensor attempted 14,691 emission measurements on passing vehicles and recorded valid emission measurements that ranged between 14,008 readings for CO and 13,714 valid NO2 measurements. The final database contained 12,963 records with make and model year information and valid measurements for at least CO and CO2. Most of these records also contain valid measurements for HC, NO, SO2, NH3, and NO2 as well and can be found at www.feat.biochem.du.edu.
summarizes the fuel-specific median and mean emissions with standard errors of the mean, mean percentile, fractional contribution of emissions for each species top 1%, measurement success rate, fleet age, and mean driving parameters for the data set. We have assumed a fuel carbon fraction of 0.85 for all of the gram per kilogram calculations to maintain consistency with the reported tunnel measurements (CitationFujita et al., 2012). The standard error of the means has been calculated from the distribution of the daily means. The reported HC emissions include an adjustment to the HC distribution zero point to compensate for any site-specific systematic offsets (CitationBishop and Stedman, 2008). The 10-ppm offset for this data set was estimated from calculating the HC mode and means of the newest model year vehicles, assuming that these vehicles emit negligible levels of HC, and using the smallest value. NOx emissions have been calculated by converting the measured g NO/kg into g NO2/kg and summing with the measured g NO2/kg emissions. SO2 emissions were statistically indistinguishable from zero and are not reported. The percent emission contribution of the top 1% have been calculated using all of the measurements but the statistic also holds if calculated using just unique vehicles. These calculations included diesel-powered vehicles, which accounted for approximately 1.3% of the measurements.
Table 1. Summary of emissions, measurement specifics, and observed driving mode
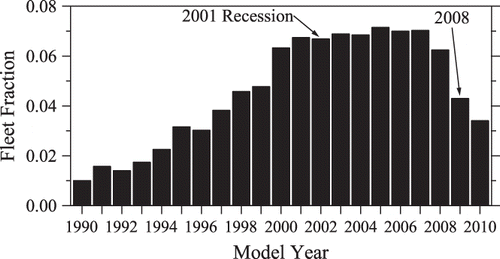
displays the Sherman Way fleet distributed by model year for 1990 and newer vehicles. The 1989 and older models not graphed account for an additional 3.5% of the fleet. The 2001 recession is not detectable in this data set, unlike previous measurements in San Jose and Fresno, California, where new car sales were noticeably reduced (CitationBishop et al., 2010). However, the 2008 economic downturn is striking in the lack of 2009 models found in-use, with a more than 40% drop from prerecession levels. The 2010 models will also end up with a large reduction, although we doubt that they were fully accounted for at the time of these measurements. Measurements in March of 2008 in nearby West Los Angeles (S. La Brea Avenure and I-10) found a fleet average age of 7.5 yr (that has changed little since our first measurements in 1999 when the fleet was 7.8 yr old) to compare with the average age of 9.4 yr for the Sherman Way fleet (CitationBishop and Stedman, 2008; CitationBishop et al., 2010). Measurements collected on Sherman Way at the Van Nuys Airport tunnel in the 1993 and 1995 studies reported estimated average fleet ages of 7.6 and 11.5 yr (CitationFraser and Cass, 1998; CitationGertler et al., 1997). On the other side of the Los Angeles Basin near Riverside, average fleet ages of 7.4, 7.5, and 7.3 yr were observed in data collected in 1999, 2000, and 2001, respectively (CitationBishop and Stedman, 2008). Although it is difficult to accurately gauge the total extent of the age increase of the on-road fleet caused by the 2008 recession, it appears to be at least one model year older. Because all tailpipe emissions generally increase with age, this will have a negative effect on fleet emissions, likely interrupting the downward trend in measured fleet emissions.
Figure 1. The measured Sherman Way fleet fraction versus model year for 1990 and newer models. The 1989 and older vehicles make up 3.5% of the total fleet. The 2001 recession is not detectable in this data set, whereas the 2008 downturn is quite striking in its magnitude and has rapidly aged the vehicle fleet.
is a Venn diagram depicting the relationships among the highest-emitting CO, HC, and NO vehicles in the measured fleet during the experiment. In the Venn diagram, all areas including the rectangle are drawn to scale, according to the total number of remote sensing readings. During the 4½ days of remote sensing measurements, there were 12,929 valid measurements for which CO, HC, and NO were measured and are represented by the area of the large rectangle. The area within each of the three circles represents the number of readings that were responsible for producing 50% of each of the three pollutants' total gram per kilogram emissions. Half of the total measured CO, HC, and NO were produced by only 2.3%, 1.8%, and 5.0%, respectively, of the total 12,929 measurements. As reported previously, some of these measurements were produced by the same vehicle that passed by the remote sensor on different occasions. The total area within all three circles, which is only 8% of all measurements, is responsible for 61%, 72%, and 54% of the measured CO, HC, and NO, respectively.
Figure 2. Amount of overlap among remote sensing measurements responsible for highest 50% of observed CO, HC, and NO. Values shown are the percentage of measurements found within each segment of the 12,929 total measurements constituting the figure. Total area outside of circles, but contained within the drawn rectangle, is 92% of all measurements. All areas within the rectangle shown in this figure are drawn to scale.
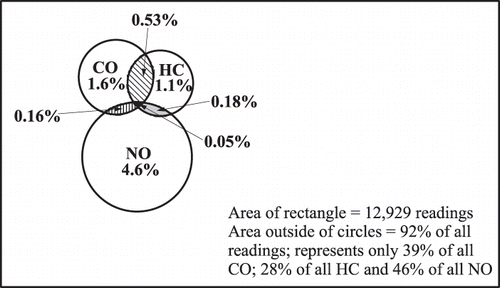
The size of the circles also shows that the degree of pollution skewness is greatest for HC and CO. The largest amount of overlap among highest polluters is between CO and HC, where 76 measurements of the 536 total are among the highest half of measured CO and HC. Only seven observations were found within the highest half of all three measured pollutants. The average model years of the vehicles with highest CO, HC, and NO measurements are 1990.9, 1994.2, and 1995.0, respectively.
The emission distributions for CO and HC are extremely skewed, as evidenced by the emission contribution of the top 1% of the measurements and the large differences between the median and mean emission values (see ). This has been driven by the continued emission reductions of newer models, but more importantly by their low malfunction rates, enabling these low initial emissions to persist for many more years than previous models (CitationBishop and Stedman, 2008). The emission levels for gross emitters has also declined over time but their contribution to the total keeps growing, with the percent of total emissions from the top 1% of measurements tripling from less than 10% in the late 1980s to the low 30% for this data set.
Contrary to some reports, gross emitters are not difficult to find through the use of remote sensing, although they constitute only a small percent of the fleet (CitationMacArthur et al., 2009). Two examples of these vehicles are a 1995 Buick and a 1986 Toyota pickup. The Buick was measured three times during the campaign and averaged 242 g CO/kg and 419 g HC/kg, which are not dissimilar from mean emissions measured from two-stroke snowmobiles in Yellowstone Park in 1999 (CitationBishop et al., 2001). The three measurements from this vehicle constitute only 0.02% of the total measurements but account for 0.29% of the total CO and an astounding 4% of the HC. The Toyota pickup is an interesting gross emitter for entirely different reasons. Although its single measurement of 880 g CO/kg easily puts it in the top 1% for CO emissions, what really distinguishes this vehicle is that it had been 2.5 yr (November 2007) since it last passed a California Smog Check emission test. State records show a failed test in 2009, although the vehicle had a valid registration according to California Department of Motor Vehicles records, a practice that has finally caught the attention of state regulators (CitationAustin et al., 2009; CitationDepartment of Consumer Affairs and Bureau of Automotive Repair, 2011). This vehicle received a passing Smog Check certificate at a test station just 5 hr after our measurement was made. We can only hope that the owner made good use of those 5 hr and properly repaired the vehicle.
Although fleet turnover has helped to eliminate the majority of the CO nonattainment areas in the United States, the current 8-hour ambient ozone standard continues to pressure states such as California to reduce fleet HC and NOx emissions beyond the current levels. With on-road gross emitters accounting for an ever-growing percentage of the total HC emissions, they continue to be the 800-pound gorilla in the room that regulators continue to ignore. This data set shows that by finding, repairing, and/or scrapping only the highest-emitting 2% of the fleet, half of the tailpipe HC emissions would be eliminated.
Just to the east of our measuring location on Sherman Way is a tunnel that goes under the runway at the Van Nuys Airport. CitationIngalls et al. (1989) measured gram per mile emission factors for CO, HC, and NOx in the fall of 1987 (but did not measure CO2); Fraser and Cass measured gram per liter emission factors for CO, HC, and NH3 in the fall of 1993; and the Desert Research Institute conducted a more detailed emission study in 1995 (CitationFraser and Cass, 1998; CitationGertler et al., 1997; CitationPierson et al., 1990). compares the reported emission rates from these previous studies along with the newest tunnel measurements collected in 2010 with the on-road remote sensing results of this study (CitationFujita et al., 2012). Mass ratios of CO/NOx and HC/NOx are reported instead of molar ratios to maintain consistency with the Ingalls et al. data (CitationPierson et al., 1990). Total HC emissions are reported for all of the studies except the newest tunnel data where only nonmethane HC (NMHC) data are available.
Table 2. On-road remote sensing emissions compared with reported historical values collected at the Van Nuys Airport tunnel
The remote sensing mean gram per kilogram CO, HC, and NOx measurements are 8.9% lower, 41% higher, and 24% higher than the 2010 tunnel measurements, respectively. The remote sensing CO/NOx and HC/NOx mass ratios are 28% lower and 20% higher than the comparable tunnel ratios. The comparisons between the remote sensing HC (exhaust-only) and tunnel NMHC measurements are made more complex because the tunnel measurements include evaporative emissions but leave out methane emissions that the remote sensor includes. The remote sensing NOx emissions are higher than the overall tunnel measurements despite the fact that they do not include emissions from the few percent of heavy-duty diesel trucks with elevated exhausts. The use of a sampling site 0.4 miles west of the tunnel and sampling a week prior to the tunnel measurements, combined with any driving mode differences caused by the lane restrictions, likely contributes to some of these differences. The historical comparisons with the remote sensing data show large reductions in CO (88% from 1993), HC (82% from 1993), and NOx (63% from 1995) emissions along with reductions in the CO/NOx and HC/NOx mass ratios (65% for CO/NOx and HC/NOx from 1987). These reductions are not necessarily linear because all species have been decreasing though not necessarily at the same rate; yet it should be noted that the HC/NOx mass ratio appears to have changed little since 1995.
The 2010 remote sensing ammonia mean of 0.59 ± 0.02 g/kg is a statistically significant increase of 17% since 1993; however, the fleet measured in 1993 was estimated to only have 76% of the fuel burned in the tunnel by vehicles equipped with three-way catalysts (a necessity for NH3 production). If we assume that the ammonia emissions would linearly scale to a fleet fully equipped with three-way catalytic convertors, adding the additional 24% to the 1993 study results in a new total of 0.62 g/kg, very similar to the 2010 measurements. Recently Kean et al. documented NH3 emissions decreasing at the Caldecott tunnel by 38% ± 6% since 1999 (CitationKean et al., 2009). The history of NH3 emissions in the Van Nuys area is insufficient to speculate whether the reductions observed at the Caldecott tunnel should be uniformly expected or are specific to that location. In addition, the lack of multiple measurements in 1993 makes any assessment of that measurement's uncertainty impossible. However, the increased age of the Sherman Way fleet as previously discussed likely has at least slowed any decrease.
Previous freeway on-ramp measurements of NH3 in San Jose, Fresno, and West Los Angeles, California, in March of 2008 resulted in NH3 means of 0.49 ± 0.02, 0.49 ± 0.01, and 0.79 ± 0.02 g/kg, respectively, compared with this study's mean of 0.59 ± 0.02 g/kg (CitationBishop et al., 2010). The higher mean observed at the West Los Angeles site was attributed to the more aggressive driving mode at the West Los Angeles site (mean vehicle-specific power [VSP] of 12.2), which is a traffic light–controlled entrance to I-10. compares the mean NH3 emissions by vehicle age (the same model years are ∼2.5 yr older at Sherman Way) for this study and the three 2008 California measurement sites. Vehicle age has been defined as the fractional measurement year minus the vehicle model year. The error bars plotted are standard errors of the mean calculated using the daily means for each model year. The age comparison assumes that there are few if any differences between the technologies and emission standards of the similarly aged vehicles; however, the Sherman Way data do contain more scatter due to fewer measurements. shows that for the sites with the most similar driving modes (San Jose mean VSP of 14.7, Fresno mean VSP of 6.4, and Sherman Way mean VSP of 6.2), the data look similar within the measurement noise, with the exception of the three newest model years from Sherman Way. They remain at higher NH3 values and those differences account for about half of the differences in the means between Sherman Way, San Jose, and Fresno. Although NH3 emissions are known to be driving mode dependent, there is not an obvious explanation for the elevated emissions of the newest model year vehicles on Sherman Way (CitationHuai et al., 2003). The other half of the difference with San Jose and Fresno means is caused by the increased age of the Sherman Way fleet, which has shifted the vehicle distribution to higher NH3 emissions.
Figure 3. Mean g NH3/kg emission versus vehicle age for the Sherman Way data (filled triangles) compared with three California sites measured in March of 2008. Vehicle age has been defined as the difference between the fractional measurement year and the vehicle model year. The error bars plotted are standard errors of the mean calculated using the daily model year means and all of the emission values have been calculated assuming a fuel carbon fraction of 0.85.
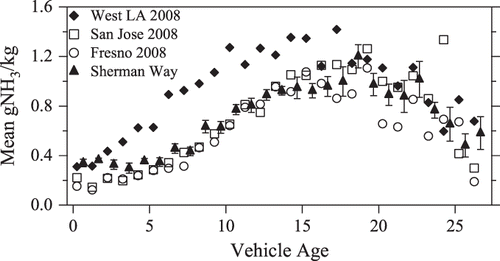
We believe that the reason the observed NH3 emissions first increase and then decrease as a function of vehicle age is the product of two counteracting factors, catalyst reducing efficiency and overall NOx emissions. For the newest vehicles, the catalyst is very efficient at reducing a large fraction of the small engine-out NOx emissions into NH3. As the vehicle ages, engine-out NOx increases, but reducing efficiency remains high enough to allow NH3 to also continue to increase. However, after about 20 yr, catalyst reducing efficiency begins to wane, and a decreasing fraction of the elevated engine-out NOx is converted to NH3, leading to its decreasing levels.
Differences in the fleet composition of weekday and weekend traffic have been implicated in many metropolitan areas as being a driver for differences in ozone precursor levels (CitationBlanchard et al., 2008). compares the mean emission values between the weekday (Thursday, Friday, and Monday morning) and weekend (Saturday and Sunday) measurements. Standard errors of the mean can only be calculated for the weekday data and have been calculated from the daily means. The weekend traffic was slightly older (0.4 model years) and slightly higher emitting for CO and HC, although not statistically significant with this small sampling. Traffic volume on Sherman Way was essentially identical on a per-hour basis for each grouping. The fraction of diesel vehicles was higher on weekdays (∼1.7%) than on the weekend days (1.2% on Saturday and 0.6% on Sunday). Sunday had the lowest mean NOx emissions for the five measurement days of 3.6 g NOx/kg.
Table 3. Emission comparison for the weekday and weekend data
Conclusions
As part of the 2010 Van Nuys tunnel study, researchers from the University of Denver acquired on-road fuel-specific emission data from nearly 13,000 light-duty vehicles on Sherman Way in Van Nuys, California, with its multispecies FEAT remote sensor. The remote sensing mean gram per kilogram CO, HC, and NOx measurements are 8.9% lower, 41% higher, and 24% higher than the tunnel measurements, respectively. The remote sensing CO/NOx and HC/NOx mass ratios are 28% lower and 20% higher than the comparable tunnel ratios. HC comparisons are complicated because the remote sensor reports only exhaust HC, whereas the tunnel measurements include evaporative emissions but do not include methane emissions. The remote sensing NOx emissions are higher than the overall tunnel measurements despite the fact that they do not include emissions from the few percent of heavy-duty diesel trucks with elevated exhausts. The use of a sampling site 0.4 miles west of the tunnel and sampling a week prior to the tunnel measurements, combined with any driving mode differences caused by the lane restrictions, likely contributes to some of these differences. Comparisons with historical data sets also collected in the Van Nuys tunnel since 1987 show large reductions in CO, HC, and NOx but little change in the HC/NOx ratio since 1995. The fleet CO and HC emissions were shown to be increasingly dominated by a few gross emitters, with more than a third of the current Sherman Way total emissions being contributed by less than 1% of the fleet. An extreme example of this is a 1995 vehicle measured three times during the 4½ days of sampling with average HC emissions of 419 g/kg (two-stroke snowmobiles typically average 475 g/kg), responsible for an astonishing 4% of the total HC emissions. The 2008 economic downturn has dramatically reduced the number of new vehicles that entered the fleet during the last two model years. This has led to a significant increase in the age (>1 model year) of the Sherman Way fleet relative to previous trends. This age increase has most noticeably led to an increase in the light-duty fleet's NH3 emissions, when compared with other California data collected in 2008. In addition, the mean NH3 levels appear to be little changed from previous NH3 measurements collected in the Van Nuys tunnel in 1993. Comparisons between weekday and weekend data sets show few fleet differences, although the fraction of light-duty diesel vehicles decreased from the weekday (1.7%) to Saturday (1.2%) and Sunday (0.6%).
Acknowledgments
The authors gratefully acknowledge the funding and support received from the National Renewable Energy Laboratory under subcontract AEV-8-88609-01. This program has been supported by the U.S. Department of Energy Office of Vehicle Technologies, Dr. James Eberhardt, Chief Scientist.
References
- Austin , T.C. , McClement , D. and Roeschen , J.D. 2009 . Evaluation of the California Smog Check Program Using Random Roadside Data , Sacramento , CA : Sierra Research, Inc . SR09-03-01
- Bishop , G.A. , Morris , J.A. and Stedman , D.H. 2001 . Snowmobile contributions to mobile source emissions in Yellowstone National Park . Environ. Sci. Technol. , 35 : 2874 – 2881 . doi: 10.1021/es010513l
- Bishop , G.A. , Peddle , A.M. , Stedman , D.H. and Zhan , T. 2010 . On-road emission measurements of reactive nitrogen compounds from three California cities . Environ. Sci. Technol. , 44 : 3616 – 3620 . doi: 10.1021/es903722p
- Bishop , G.A. and Stedman , D.H. 2008 . A decade of on-road emissions measurements . Environ. Sci. Technol. , 42 : 1651 – 1656 . doi: 10.1021/es702413b
- Blanchard , C.L. , Tanenbaum , S. and Lawson , D.R. 2008 . Differences between weekday and weekend air pollutant levels in Atlanta; Baltimore; Chicago; Dallas-Fort Worth; Denver; Houston; New York; Phoenix; Washington, DC; and surrounding areas . J. Air Waste Manage. Assoc. , 58 : 1598 – 1615 . doi: 10.3155/1047-3289.58.12.1598
- Burgard , D.A. , Bishop , G.A. , Stadtmuller , R.S. , Dalton , T.R. and Stedman , D.H. 2006a . Spectroscopy applied to on-road mobile source emissions . Appl. Spectrosc. , 60 : 135A – 148A . doi: 10.1366/000370206777412185
- Burgard , D.A. , Dalton , T.R. , Bishop , G.A. , Starkey , J.R. and Stedman , D.H. 2006b . Nitrogen dioxide, sulfur dioxide, and ammonia detector for remote sensing of vehicle emissions . Rev. Sci. Instrum. , 77 : 1 – 4 . doi: 10.1063/1.2162432
- California Environmental Protection Agency, Air Resources Board. 2010. EMFAC2007 release http://www.arb.ca.gov/msei/onroad/latest_version.htm (http://www.arb.ca.gov/msei/onroad/latest_version.htm) (Accessed: 10 May 2012 ).
- Department of Consumer Affairs, Bureau of Automotive Repair. 2011. Vehicle test history http://www.bar.ca.gov/pubwebquery/Vehicle/PubTstQry.aspx (http://www.bar.ca.gov/pubwebquery/Vehicle/PubTstQry.aspx) (Accessed: 10 May 2012 ).
- Fraser , M.P. and Cass , G.R. 1998 . Detection of excess ammonia emissions from in-use vehicles and the implications for fine particle control . Environ. Sci. Technol. , 32 : 1053 – 1057 . doi: 10.1021/es970382h
- Fujita , E.M. , Campbell , D. , Zielinska , B. , Chow , J.C. , Lindhjem , C. , DenBleyker , A. , Bishop , G.A. , Schuchmann , B.G. , Stedman , D.H. and Lawson , D.R. 2012 . Comparison of the MOVES2010a, MOBILE6.2 and EMFAC2007 mobile source emissions models with on-road traffic tunnel and remote sensing measurements . J. Air Waste Manage. Assoc. , 62 : 1134 – 1149 . doi: 10.1080/10962247.2012.699016
- Gertler , A.W. , Sagebiel , J.C. , Wittorff , D.N. , Pierson , W.R. , Dippel , W.A. , Freeman , D. and Sheetz , L. 1997 . Vehicle Emissions in Five Urban Tunnels , Atlanta , GA : The Coordinating Research Council, Inc . Final report no. E-5
- Harley , R.A. , Russell , A.G. , McRae , G.J. , Cass , G.R. and Seinfeld , J.H. 1993 . Photochemical modeling of the Southern California air quality study . Environ. Sci. Technol. , 27 : 378 – 388 . doi: 10.1021/es00039a019
- Huai , T. , Durbin , T.D. , Miller , J.W. , Pisano , J.T. , Sauer , C.G. , Rhee , S.H. and Norbeck , J.M. 2003 . Investigation of NH3 emissions from new technology vehicles as a function of vehicle operating conditions . Environ. Sci. Technol. , 37 : 4841 – 4847 .
- Ingalls , M.N. On-road vehicle emission factors from measurements in a Los Angeles area tunnel . Paper no. 89–137.3. Anaheim, CA: Air and Waste Management Association . 1989 .
- Ingalls , M.N. , Smith , L.R. and Kirksey , R.E. 1989 . Measurements of On-Road Vehicle Emission Factors in the California South Coast Air Basin—Volume I: Regulated Emissions , Atlanta , GA : The Coordinating Research Council, Inc . SwRI-1604
- Kean , A.J. , Littlejohn , D. , Ban-Weiss , G.A. , Harley , R. A. , Kirchstetter , T.W. and Lunden , M.M. 2009 . Trends in on-road vehicle emissions of ammonia . Atmos. Environ. , 43 : 1565 – 1570 . doi: 10.1016/j.atmosenv.2008.09.085
- Knapp , K.T. 1994 . On-road vehicle emissions: U.S. studies . Sci. Total Environ. , 146–147 : 209 – 215 . doi: 10.1016/0048-9697(94)90239-9
- MacArthur , R. , Mobley , D. , Levin , L. , Pierce , T. , Feldman , H. , Moore , T. , Koupal , J. and Janssen , M. 2009 . Emission characterization and emission inventories for the 21st century . EM , : 36 – 41 . doi: 10.1063/1.119078
- Pierson , W.R. , Gertler , A.W. and Bradow , R.L. 1990 . Comparison of the SCAQS tunnel study with other on-road vehicle emission data . J. Air Waste Manage. Assoc. , 40 : 1495 – 1504 . doi: 10.1080/10473289.1990.10466799
- Pierson , W.R. , Gertler , A.W. , Robinson , N.F. , Sagebiel , J.C. , Zielinska , B. , Bishop , G.A. , Stedman , D.H. , Zweidinger , R.B. and Ray , W.D. 1996 . Real-world automotive emissions—Summary of studies in the Fort McHenry and Tuscarora Mountain tunnels . Atmos. Environ. , 30 : 2233 – 2256 . doi: 10.1016/1352-2310(95)00276-6
- Singer , B.C. , Harley , R.A. , Littlejohn , D. , Ho , J. and Vo , T. 1998 . Scaling of infrared remote sensor hydrocarbon measurements for motor vehicle emission inventory calculations . Environ. Sci. Technol. , 32 : 3241 – 3248 . doi: 10.1021/es980392y
- U.S. Environmental Protection Agency . 2008 . Latest Findings on National Air Quality; Status and Trends through 2006 , Research Park Triangle , NC : U.S. Environmental Protection Agency . EPA-454/R-07-007
- U.S. Environmental Protection Agency. 2010. Modeling and inventories; MOVES (Motor Vehicle Emission Simulator) http://www.epa.gov/otaq/models/moves/index.htm (http://www.epa.gov/otaq/models/moves/index.htm) (Accessed: 10 May 2012 ).