Abstract
A previously proposed technology incorporating TiO2 into common household fluorescent lighting was further tested for its Hg0 removal capability in a simulated flue-gas system. The flue gas is simulated by the addition of O2, SO2, HCl, NO, H2O, and Hg0, which are frequently found in combustion facilities such as waste incinerators and coal-fired power plants. In the O2 + N2 + Hg0 environment, a Hg0 removal efficiency (ηHg) greater than 95% was achieved. Despite the tendency for ηHg to decrease with increasing SO2 and HCl, no significant drop was observed at the tested level (SO2: 5–300 ppmv, HCl: 30–120 ppmv). In terms of NO and moisture, a significant negative effect on ηHg was observed for both factors. NO eliminated the OH radical on the TiO2 surface, whereas water vapor caused either the occupation of active sites available to Hg0 or the reduction of Hg0 by free electron. However, the negative effect of NO was minimized (ηHg > 90%) by increasing the residence time in the photochemical reactor. The moisture effect can be avoided by installing a water trap before the flue gas enters the Hg0 removal system.
This paper reports a novel technology for a removal of gas-phase elemental mercury (Hg0) from a simulated flue gas using TiO2-coated glass beads under a low-cost, easily maintainable household fluorescent light instead of ultraviolet (UV) light. In this study, the effects of individual chemical species (O2, SO2, HCl, NO, and water vapor) on the performance of the proposed technology for Hg0 removal are investigated. The result suggests that the proposed technology can be highly effective, even in real combustion environments such as waste incinerators and coal-fired power plants.
Introduction
Mercury (Hg) is a toxic heavy metal that is released into the environment at a global annual emission rate of 1930 tons from anthropogenic sources such as waste incinerators (municipal, medical) and coal-fired power plants (CitationUnited Nations Environmental Programme, 2008a). Hg emitted from these sources is deposited in seas, rivers, and soil, mostly by rain or snow. Hg contamination in aquatic species and food leads to the accumulation of Hg and causes biomagnification through the food chain. This accumulation has a significant effect on human health (CitationMunthe et al., 2007; CitationSundseth et al., 2010; CitationArctic Monitoring and Assessment Programme, 2005). Hg pollution has been discussed by the United Nations Environmental Programme (UNEP) Governing Council since 2002. The UNEP mercury program established an ad hoc open-ended working group to discuss appropriate measures and international treaties for the prevention of mercury pollution (CitationUnited Nations Environmental Programme, 2008b). As a result, the development of a legally binding global treaty on mercury is under way, and the treaty is expected to be signed in 2013 in Minamata, Japan.
Hg in a flue gas exists in three forms: elemental mercury (Hg0), oxidized mercury (Hg2+), and particle-bound mercury (Hgp). Each form of Hg has different characteristics, and numerous studies have reported the removal of individual Hg species by conventional air pollution control devices (APCDs) installed at combustion facilities. Hgp can be removed by a fabric filter (FF) or an electrostatic precipitator (ESP) with an efficiency of 27–58% depending on the operating conditions (CitationChoi et al., 2009). Hg2+ is soluble in aqueous solution and has good reactivity with particulate matter. Thus, wet flue-gas desulfurization (WFGD) can remove Hg2+ with efficiencies in the range of 53–87% (CitationU.S. Department of Energy, 2006). Meanwhile, Hg0 accounts for more than 35% of the total Hg in flue gas in most combustion facilities and is very difficult to remove. APCDs are generally ineffective in removing Hg0 because Hg0 is insoluble in water and has a poor reactivity with particulate matter.
Activated-carbon injection (ACI) technology is currently the most widely used technology and can achieve a Hg removal efficiency greater 90%. Activated carbons (virgin or impregnated with one of the following: sulfur, iodine, chlorine, or bromine) are injected into the flue gas immediately before the gas enters the ESPs or baghouse filters. However, the application and effectiveness of ACI technology is limited by the types of APCDs installed in exhaust facilities. In addition, the disposal procedure used for adsorbents containing Hg is complicated and expensive.
In a previous study, we reported the removal of Hg0 in a system containing only Hg and air using a TiO2 catalyst and a common household fluorescent light (CitationLee et al., 2004):
During the process, HgO was formed on the activated TiO2 surface through the photo-oxidization of Hg0 by the hydroxyl (OH) radical in an O2 atmosphere (CitationLee et al., 2001; CitationLi and Wu, 2006; CitationLi and Wu, 2007; CitationPitoniak et al., 2003, Citation2005; CitationSnider and Ariya, 2010; CitationWu et al., 1998).
In this study, the previously proposed technology was further tested for its Hg0 capture capability in a simulated flue-gas system. The flue gas was simulated by the addition of the chemical constituents (O2, SO2, HCl, NO, H2O, and Hg0) frequently found in combustion facilities at the concentrations based on both the Korean Emission Standards for Hazardous Air Pollutants (CitationThe Korean Ministry of Environment, 2011) and actual reported data from flue gas analyzed in real time by the TMS (Tele Metering System) installed at waste incinerators in the Republic of Korea.
Experimental
TiO2-coated glass beads
The photocatalytic adsorbents were prepared by coating the glass beads with anatase-TiO2 nanoparticles (NanoPac Ltd., Suwon, Korea). Clear glass beads were used to allow fluorescent light to penetrate further toward the center of the tubular photochemical-reaction cell reactor. First, glass beads 3 mm in diameter were washed clean and placed on a sieve. The glass beads on the sieve were then dipped into a TiO2 solution while being sonicated. The beads were then dried for 1 hr at 20 °C followed by 1 hr at 80 °C in an oven. This process was repeated three times. The amount of TiO2 coated on the beads was calculated by measuring the total weight of the beads before and after the coating. Approximately 0.4 mg of TiO2 was coated per 1 g of photocatalyst (TiO2-coated glass beads).
The crystallinity of the anatase TiO2 used in this work was confirmed by powder X-ray diffraction (XRD; D/max 2200V/PC; Rigaku Co., Tokyo, Japan). The measured crystallite size was 5–10 nm. The average particle size measured using a transmission electron microscope equipped with an energy dispersive X-ray analyzer (TEM-EDX; JEM-1210; JEOL Ltd., Tokyo, Japan) was 60 nm, whereas the specific surface area measured by the Brunauer-Emmett-Teller (BET) method (ASAP2020; Micromeritics Instrument Corp., Norcross, MN, USA) was approximately 275 m2/g.
Photocatalytic reactor
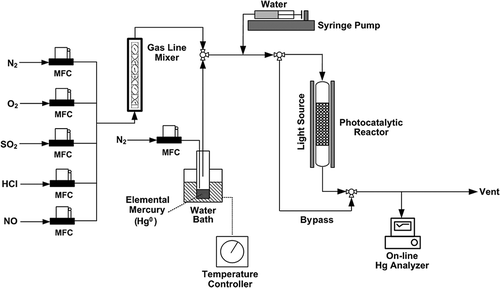
A schematic diagram of the experimental setup is shown in . A photochemical-reaction cell made of quartz was placed inside a stainless steel housing equipped with four common household fluorescent lamps (4 × 20 W, 220V, model E20EX-D; Dooyoung Lighting Co., Seoul, Korea). The wavelength spectrum was also measured (ILT900; International Lighting Technologies Inc., Peabody, MA, USA). A major peak was observed between 400 and 800 nm and a small but noticeable peak appeared between 360 and 370 nm. All of the household fluorescent lamps commercially available in Korea exhibited a minor peak in the ultraviolet A (UVA) range (360–370 nm). The cell was 65 cm in height and 2.1 cm in diameter, and was located at an equal distance of 7 cm from each of the four fluorescent lamps. A cooling fan was installed to prevent the temperature from rising inside the housing. A gas mixer was used to blend the individual input gases, and all of the gas lines were covered with heating jackets capable of controlling the temperature from 30 to 300 °C.
Figure 1. A schematic diagram of the experimental system.
Simulated flue gas
In this work, a combustion flue gas was simulated by a particle-free, dry gas containing O2, SO2, HCl, NO, Hg0, and water vapor with a balance gas, N2. Except for the water vapor, all of the gases were introduced into the system at a precisely controlled flow rate using mass-flow controllers. The concentrations of the introduced gases were determined based on both the Korean Emission Standards for Hazardous Air Pollutants (CitationThe Korean Ministry of Environment, 2011) and reported analysis data from waste incinerator flue gas using TMS in the Republic of Korea. Elemental mercury vapor was introduced into the system by passing N2 gas at a precisely controlled flow rate above liquid mercury contained in a temperature-controlled gas-washing bottle (10 °C). The amount of water vapor in the inlet gas stream was controlled by adjusting the amount of water injection from the syringe pump. The gas lines and photocatalytic reactor were maintained at a temperature of 50 °C to prevent water vapor from condensing and saturating the TiO2 surface. Finally, a water trap was installed ahead of the on-line Hg0 analyzer. The volume of the water vapor corrected to standard conditions, V w(std), was calculated using the following equation (CitationASTM International, 2008):
Then, the moisture content (volume ratio of water vapor to the stack gas), B ws, was calculated using Equationeq 3, which was in the range of 0.5–5% in this study:
Hg analysis
The concentrations of gaseous Hg0 at the inlet and outlet of the reactor were measured by an on-line Hg0 analyzer (VM 3000; Mercury Instruments, Karlsfeld, Germany). This analyzer uses a cold vapor atomic absorption spectrometry (CVAAS) method based on the resonance absorption wavelength of Hg atoms at 253.7 nm (CitationNorton et al., 2002). It provides continuous measurements of Hg0 in ambient air and in flue gas. It was periodically calibrated with an Hg0 calibrator (Series 3310; Tekran Instruments Corp., Toronto, Canada). The Hg0 concentration in the gas stream passing through the reactor with no light source was set as the baseline. The Hg0 removal efficiency, ηHg, was calculated using the following equation:
Results and Discussion
To test the influence of SO2, HCl, NO, and water vapor on the Hg0 removal by TiO2-coated beads with fluorescent light, comparative experiments were performed with each chemical constituent at various concentrations. Twenty-five grams of the TiO2-coated beads were placed in a photocatalytic reactor with a total input-gas flow rate of 3 L/min, resulting in a residence time of 0.16 sec. The base gas was composed of O2, Hg0, and N2 (for Hg carrying and input-gas balancing) producing an inlet Hg concentration of 50–60 μg/m3.
Effect of O2
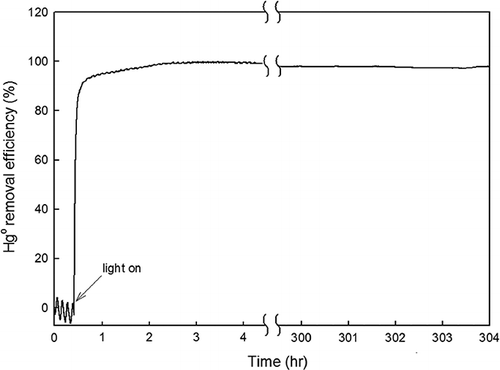
First, the effect of O2 on Hg0 removal by TiO2-coated beads with fluorescent light was investigated. The gas tested was composed of Hg0, N2, and O2 (14%). As shown in , for the first 30 min without any light source, no Hg0 removal was observed. Then, the fluorescent light was turned on for 300 hr, and the output Hg0 concentration was measured. A ηHg value greater than 90% was achieved instantly once the light was switched on. After 100 min, ηHg reached 99%. A ηHg value greater than 95% was maintained for over 300 hr. The presence of O2 indicated no negative effect on the Hg0 removal by TiO2-coated beads with fluorescent light.
Figure 2. Hg0 removal efficiency in the presence of O2, Hg0, and N2.
Effect of SO2
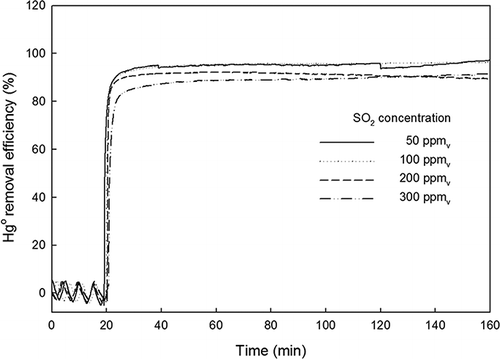
Next, SO2 was added to the base gas while maintaining the total flow rate at 3 L/min. The concentration of SO2 was precisely controlled at 50, 100, 200, and 300 ppmv. It should be noted that SO2 interferes with the Hg analyzer measurement by absorbing light with a wavelength in the range of 250–370 nm (CitationVandaele et al., 1994), which overlaps with the light absorption wavelength of Hg (253.7 nm). To account for the overrated on-line Hg measurement caused by SO2, a blank test using a gas sample with SO2 (50, 100, 200, and 300 ppmv) balanced with N2 (no Hg0) was carried out first. The blank test results were taken into account when calculating ηHg in the presence of SO2.
After the inlet Hg0 concentration reading (50–60 μg/m3) was stabilized for 30 min, the fluorescent light was turned on for 2 hr. shows the Hg0 removed by TiO2-coated beads with fluorescent light in the presence of SO2. For all of the tested SO2 concentrations, ηHg greater than 90% was observed. At SO2 concentrations below 100 ppmv, ηHg greater than 95% was achieved. Despite the tendency for ηHg to decrease with increasing SO2, no significant drop was observed at the tested level of SO2 (50–300 ppmv).
Figure 3. Effect of SO2 on the Hg0 removal efficiency.
Effect of HCl
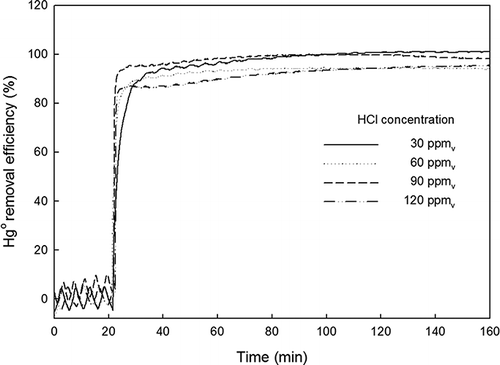
shows the Hg0 removed by TiO2-coated beads with fluorescent light in the presence of HCl. For all of the tested HCl concentrations (C HCl = 30, 60, 90, and 120 ppmv), ηHg greater than 90% was observed. A ηHg value greater than 99% was observed for C HCl < 60 ppmv. As in the case of SO2, the technology proposed in this work shows highly effective Hg0 removal despite the presence of HCl.
Figure 4. Effect of HCl on the Hg0 removal efficiency.
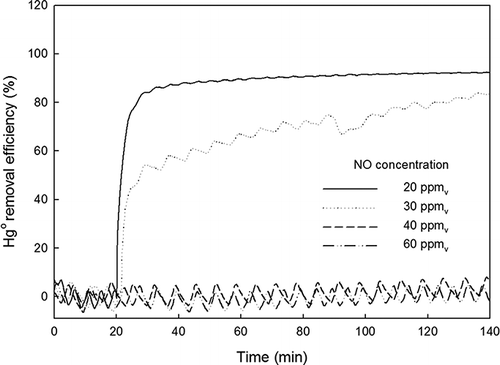
Effect of NO
shows the effects of NO (20, 30, 40, and 60 ppmv) on Hg0 removal. At a NO concentration (C NO) of 20 ppmv, ηHg reached 90% after 40 min. At C NO = 30 ppmv, the initial Hg0 removal rate was very slow compared with that at C NO = 20 ppmv, taking more than 2 hr to achieve 90% ηHg. No Hg0 removal was observed at C NO > 40 ppmv, even after 2 hr. Unlike SO2 or HCl, the addition of NO had a significant negative effect on the Hg0 removed by TiO2-coated beads with fluorescent light. As the NO concentration increased, the degree of interference increased until the amount of Hg0 removed became essentially zero. Niksa et al. reported that NO was the most effective inhibitor during Hg0 oxidation and that this inhibition was caused by the elimination of the OH radical on the TiO2 surface by the following reaction (CitationNiksa et al., 2001):
Figure 5. Effect of NO on the Hg0 removal efficiency.
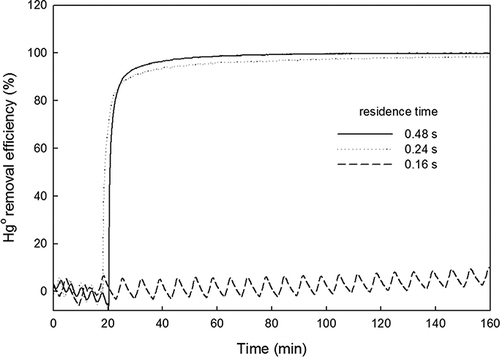
M represents any other molecule available to carry off excess energy. The influence of NO was further examined by evaluating ηHg at input-gas flow rates of 1, 2, and 3 L/min, exhibiting residence times of 0.48, 0.24, and 0.16 sec, respectively. The NO concentration was fixed at 40 ppmv, a concentration at which no Hg0 removal was previously observed for the total input-gas flow rate of 3.0 L/min. The amount of photocatalyst was 25 g, and the inlet Hg0 concentration was 50–60 μg/m3. As shown in , ηHg was below 10% for a residence time of 0.16 sec, whereas it exceeded 90% with residence times of 0.24 and 0.48 sec. This result suggests that the negative effect of NO in flue gas might be overcome by increasing the residence time in the photocatalytic reactor.
Figure 6. Hg0 removal efficiency at various residence times (C NO = 40 ppmv).
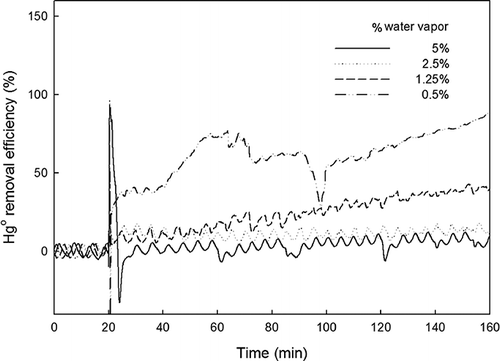
Effect of water vapor
Experiments analogous to those discussed in the preceding sections were carried out at various moisture contents. Gas streams with 0.5–5% water vapor were introduced into the system.
The values of ηHg observed at different moisture contents are shown in . At 5% moisture, ηHg was well below 5%. This was most likely due to the occupation of TiO2 active sites by the water-vapor molecules. The amount of Hg0 removed increased as the water-vapor content was decreased. At 0.5% H2O, ηHg instantly reached 40% and gradually increased to 90%.
Figure 7. Effect of moisture on the Hg0 removal efficiency.
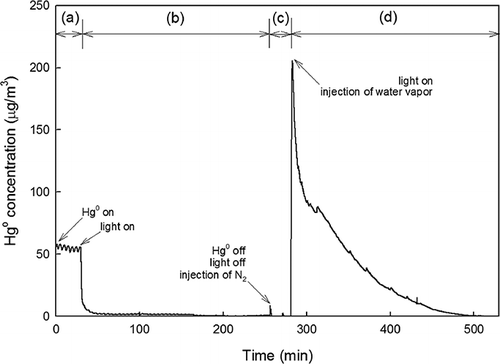
Another set of experiments was performed to further elucidate the moisture effect. In step I, a gas containing Hg0, O2, N2, and no water vapor was injected into the system. The light was turned off during step I. In step II, the light was turned on and ηHg instantly reached close to 100% and stabilized. The photocatalyst (TiO2) was allowed to uptake Hg0 for 4 hr during step II until the injection of Hg0 and O2 was stopped and the light was turned off. Then, in step III, N2 gas was introduced into the system to remove any Hg0 physically attached to the surface of the reactor and TiO2 (step III). Finally, in step IV, a gas containing 5% water vapor and 14% O2 balanced with N2 was passed through the Hg0-adsorbed TiO2 photocatalysts, now with the fluorescent light turned on. The outlet Hg0 concentration was continuously monitored at all times throughout the experiments; the results are shown in . A significantly high Hg0 release was observed as soon as the water vapor was introduced into the system (step IV), gradually decreasing until no Hg0 release was detected after 200 min. A similar phenomenon was observed and discussed by Li and co-workers for the case of UV (CitationLi and Wu, 2006; CitationLi et al., 2008). They reported that water vapor in the presence of UV generated free electrons on the surface of TiO2, causing the reduction of HgO by the following reaction:
Figure 8. Desorption of adsorbed Hg0 from TiO2 surface by water vapor: (a) step I, (b) step II, (c) step III, and (d) step IV.
The effects of moisture on the Hg0 removal in the flue gas can be summarized as follows: first, the water vapor molecules compete with Hg0 gas molecules for the available empty active sites on the TiO2 surface. At the same time, they go after the active sites occupied by HgO and detach the adsorbed Hg0 back into the gas stream.
Conclusions
A previously proposed novel gaseous Hg0 removal technology was further tested under simulated flue-gas conditions. The effects of the selected combustion flue gas constituents (SO2, HCl, NO, and moisture) on Hg0 removal by TiO2-coated glass beads under common household fluorescent light were investigated. First, despite the tendency for the Hg0 capture efficiency to decrease with increasing SO2 and/or HCl, the proposed technology was proved to be highly effective under the tested conditions (SO2: 50–300 ppmv, HCl: 30–120 ppmv), simulating those in conventional combustion facilities, specifically, waste incinerators. Both NO and moisture exhibited negative effects on Hg0 removal. NO was the most effective inhibitor during Hg0 oxidation, eliminating the OH radical from the TiO2 surface. However, we were able to minimize the negative effects caused by NO by increasing the residence time. The water vapor caused either the occupation of the active sites available for Hg0 removal or the reduction of HgO by free electron in the presence of fluorescent light and subsequent detachment from the TiO2 surface in the form of Hg0. In real combustion facilities such as waste incinerators (typically with 10–20% H2O in the flue gas), the moisture effect can be avoided by installing a water trap for the flue gas before it enters the Hg0 removal system. Clearly, the design parameters to maximize the Hg0 removal efficiency in real combustion environments deserve further exploration. However, the TiO2 + fluorescent light system is readily applicable for Hg recovery from used fluorescent light bulbs, which typically involves a moisture-free and acid-free environment.
Acknowledgments
This work was supported by the National Research Foundation of Korea (NRF) grant funded by the Korea government (MEST) (no. 2009-0079977).
References
- Arctic Monitoring and Assessment Programme. 2005. Assessment 2002: Heavy metals in the Arctic http://www.amap.no/documents/index.cfm?dirsub=/AMAP%20Assessment%202002%20-%20Heavy%20Metals%20in%20the%20Arctic (http://www.amap.no/documents/index.cfm?dirsub=/AMAP%20Assessment%202002%20-%20Heavy%20Metals%20in%20the%20Arctic) (Accessed: 21 December 2005 ).
- ASTM International . 2008 . ASTM D6784-02. Standard Test Method for Elemental, Oxidized, Particle-Bound and Total Mercury in Flue Gas Generated from Coal-Fired Stationary Sources (Ontario Hydro Method) , West Conshohocken , PA : ASTM International .
- Choi , H.K. , Lee , S.H. and Kim , S.S. 2009 . The effect of activated carbon injection rate on the removal of elemental mercury in a particulate collector with fabric filters . Fuel Process. Technol , 90 : 107 – 112 . doi: 10.1016/j.fuproc.2008.08.001
- Lee , Y.G. , Park , J.W. , Kim , J.H. , Min , B.R. , Jurng , J. , Kim , J. and Lee , T.G. 2004 . Comparison of mercury removal efficiency from a simulated exhaust gas by several types of TiO2 under various light sources . Chem. Lett , 33 : 36 – 37 . doi: 10.1246/cl.2004.36
- Lee , T.G. , Biswas , P. and Hedrick , E. 2001 . Comparison of Hg0 capture efficiencies of three in-situ generated sorbents . AIChE J , 47 : 954 – 961 . doi: 10.1002/aic.690470418
- Li , Y. and Wu , C.Y. 2006 . Role of moisture in adsorption, photocatalytic oxidation, and reemission of elemental mercury on a SiO2-TiO2 nanocomposite . Environ. Sci. Technol , 40 : 6444 – 6448 . doi: 10.1021/es061228a
- Li , Y. and Wu , C.Y. 2007 . Kinetic study for photocatalytic oxidation of elemental mercury on a SiO2-TiO2 nanocomposite . Environ. Eng. Sci , 24 : 3 – 12 . doi: 10.1089/ees.2007.24.3
- Li , Y. , Murphy , P. and Wu , C.Y. 2008 . Removal of elemental mercury from simulated coal-combustion flue gas using a SiO2-TiO2 nanocomposite . Fuel Process. Technol , 89 : 567 – 573 . doi: 10.1016/j.fuproc.2007.10.009
- Munthe , J. , Bodaly , R.A. , Branfireun , B.A. , Driscoll , C.T. , Gilmour , C.C. and Harris , R. 2007 . Recovery of mercury-contaminated fisheries . Ambio , 36 : 33 – 44 . doi: 10.1579/0044-7447(2007)36[33:ROMF]2.0.CO;2
- Niksa , S. , Helble , J.J. and Fujiwara , N. 2001 . Kinetic modeling of homogeneous mercury oxidation: The importance of NO and H2O in predicting oxidation in coal-derived systems . Environ. Sci. Technol , 35 : 3701 – 3706 . doi: 10.1021/es010728v
- Norton , G.A. and Eckels , D.E. 2002 . Laboratory evaluation of a mercury CEM using atomic absorption with a deuterium background correction system . Environ. Eng. Sci , 36 : 1767 – 1773 . doi: 10.1021/es0113899
- Pitoniak , E. , Wu , C.Y. , Londeree , D. , Mazyck , D. , Bonzongo , J.C. , Powers , K. and Sigmund , W. 2003 . Nanostructured silica-gel doped with TiO2 for mercury vapor control . J. Nanopart. Res , 5 : 281 – 292 . doi: 10.1023/A:1025582731470
- Pitoniak , E. , Wu , C.Y. , Mazyck , D.W. , Powers , K.W. and Sigmund , W. 2005 . Adsorption Enhancement mechanisms of silica-titania nanocomposites for elemental mercury vapor removal . Environ. Sci. Technol , 39 : 1269 – 1274 . doi: 10.1021/es049202b
- Snider , G. and Ariya , P. 2010 . Photo-catalytic oxidation reaction of gaseous mercury over titanium dioxide nanoparticle surfaces . Chem. Phys. Lett , 491 : 23 – 28 . doi: 10.1016/j.cplett.2010.03.062
- Sundseth , K. , Pacyna , J.M. , Pacyna , E.G. , Munthe , J. , Belhaj , M. and Astrom , S. 2010 . Economic benefits from decreased mercury emissions: Projections for 2020 . J. Cleaner Prod , 18 : 386 – 394 . doi: 10.1016/j.jclepro.2009.10.017
- The Korean Ministry of Environment . 2011 . Clean Air Conservation Act. Article 16 , Seoul Republic of Korea: The Korean Ministry of Environment .
- U.S. Department of Energy. 2006. Evaluation of mercury emissions from coal-fired facilities with SCR and FGD system. Project final report DE-FC26-02NT41589 http://www.netl.doe.gov/technologies/coalpower/ewr/mercury/control-tech/pubs/DOE%20SCR-FGD%20FINAL%20REPORT.pdf (http://www.netl.doe.gov/technologies/coalpower/ewr/mercury/control-tech/pubs/DOE%20SCR-FGD%20FINAL%20REPORT.pdf) (Accessed: 25 April 2006 ).
- United Nations Environmental Programme. 2008a. The global atmospheric mercury assessment: Sources, emissions and transport http://www.unep.org/hazardoussubstances/Mercury/MercuryPublications/GlobalAtmGlobalAtmosphericMercuryAssessment/tabid/3618/language/en-US/Default.aspx (http://www.unep.org/hazardoussubstances/Mercury/MercuryPublications/GlobalAtmGlobalAtmosphericMercuryAssessment/tabid/3618/language/en-US/Default.aspx) (Accessed: 8 May 2008 ).
- United Nations Environmental Programme. 2008b. Technical background report to the global atmospheric mercury assessment http://www.chem.unep.ch/mercury/Atmospheric_Emissions/Technical_background_report.pdf (http://www.chem.unep.ch/mercury/Atmospheric_Emissions/Technical_background_report.pdf) (Accessed: 19 December 2008 ).
- Vandaele , A.C. , Simon , P.C. , Guilmot , J.M. , Carleer , M. and Colin , R. 1994 . SO2 Absorption cross section measurement in the UV using a Fourier transform spectrometer . J. Geophys. Res , 99 : 25599 – 25605 . doi: 10.1029/94JD02187
- Wu , C.Y. , Lee , T.G. , Tyree , G. , Arar , E. and Biswas , P. 1998 . Capture of mercury in combustion systems by in-situ generated titania particles with UV irradiation . Environ. Eng. Sci , 15 : 137 – 148 . doi: 10.1089/ees.1998.15.137