Abstract
Mobile-source air toxic (MSAT) levels increase in confining microenvironments (MEs) with numerous emission sources of vehicle exhaust or evaporative emissions or during high-load and cold-start conditions. Reformulated fuels are expected to reduce MSAT and ozone precursor emissions. This study, required under the Clean Air Act Section 211b, evaluated high-end exposures in cities using reformulated (methyl tertiary-butyl ether [MTBE] or ethanol [EtOH]) fuels and conventional gasoline blends. The study investigates 13 high-end MEs, sampling under enhanced exposure conditions expected to result in maximal fuel and exhaust component exposures to carbon monoxide (CO), carbon dioxide (CO2), BTEX (benzene, toluene, ethylbenzene, xylenes), MTBE, 1,3-butadiene (1,3-BD), EtOH, formaldehyde (HCHO), and acetaldehyde (CH3CHO). The authors found that day-to-day ME variations in high-end benzene, 1,3-BD, HCHO, and CO concentrations are substantial, but independent of gasoline composition and season, and related to the activity and emission rates of ME sources, which differ from day to day.
Mobile-source air toxic (MSAT) levels increase in confining microenvironments (MEs) in the presence of vehicular exhaust or evaporative emissions. This study, required under the Clean Air Act Section 211b, evaluated high-end exposures in cities using oxygenated (methyl tertiary-butyl ether or ethanol) and conventional gasoline blends. Personal exposure concentrations were quantified in selected MEs representing the upper end of the frequency distribution of potential population exposures. This work presents the first systematic look at high-end/maximal exposures to multiple contaminants, in multiple microenvironments, in multiple cities, over two seasons, for multiple fuels, making it a very complete evaluation of reformulated fuel impacts on MSAT concentrations in confined microenvironments. The study found that day-to-day ME variations of high-end pollutant concentrations are substantial, but independent of gasoline composition and season, and related to the variable daily activity and emission rates of ME sources. The data collected in this study may be used in bounding exposure modeling estimates that account for time spent in similar confining MEs.
Supplemental materials are available for this paper. Go to the publisher's online edition of the Journal of the Air & Waste Management Association for information on average, maximum and minimum ME concentrations and summary of reconstructed 1-minute data.
Introduction
Gasoline-powered vehicles emit a portion of ozone-forming volatile organic compounds (VOCs) and mobile-source air toxics (MSATs) in the urban areas of the country. Elevated exposures to gasoline-related MSATs have been reported in certain microenvironments (MEs), such as in vehicle cabins during commuting on congested roadways (CitationBatterman et al., 2002; CitationChan et al., 1991; CitationFedoruk and Kerger, 2003; CitationRodes et al., 1998; CitationWeisel et al., 1992; CitationJo and Park, 1999), in urban tunnels (CitationLegreid et al., 2007b; CitationLough et al., 2005), during refueling (CitationVayghani and Weisel, 1999; CitationVainiotalo et al., 1999; CitationLindstrom and Pleil, 1996; CitationLin et al., 2005), in parking garages (CitationKim et al., 2007), homes with attached garages (CitationZielinska et al., 2011, CitationHun et al., 2011; CitationBatterman et al., 2006; CitationBatterman et al., 2007), or in urban canyons (CitationChan et al., 1991; CitationRodes et al., 1998). Emissions from gasoline and the petrochemical industry are among the main sources of benzene in ambient air (CitationWeisel, 2010).
Although oxygenated fuel and reformulated gasoline (RFG) programs are intended to reduce the emissions of ozone precursors and MSAT, uncertainties remain regarding the relative population exposure levels associated with oxygenated and conventional gasoline. Accordingly, in 1997 the U.S. Environmental Protection Agency (EPA) issued testing requirements under Alternative Tier 2 provisions of the fuel and fuel additive (F/FA) health effects testing regulations, required pursuant to Section 211(b)(2) and 211(e) of the Clean Air Act (62 FR 47400 [September 9, 1997] and 62 FR 60675 [November 12, 1997]). The 211b Research Group (RG) was established by the American Petroleum Institute to fulfill the requirements of those regulations and sponsored the study reported here. The RG is an unincorporated group of companies affiliated by contractual obligation to meet EPA's Alternative Tier 2 testing requirements. The F/FA health effects testing program regulations are codified at 40 CFR part 79, subpart F. The Alternative Tier 2 provisions appear at 40 CFR 79.58(c).
The population exposure study required by EPA targeted conventional gasoline and two oxygenated blends containing methyl tertiary-butyl ether (MTBE) or ethanol (EtOH) and conducted studies in high-end MEs, chosen after sampling prospective sites likely associated with the most-exposed populations. Personal exposure concentrations were quantified in selected MEs representing the upper end of the frequency distribution of potential population exposures. The studies took place in cities that had ongoing ambient air monitoring programs, were located in hot and cold parts of the country, and used one of the three target fuels. Sampling was performed during summer and winter seasons and under compounding combinations of selected conditions (e.g., downwind, low wind speeds, rush hour traffic, fuel spillage, trailing high-emission vehicles) thought to maximize exposure within each ME (CitationZielinska et al., 2009). The same sampling protocols (e.g., location, duration, cabin ventilation) were used in both seasons whenever possible. A number of fuel emission and exhaust components (carbon monoxide [CO], carbon dioxide [CO2], BTEX [benzene, toluene, ethylbenzene, xylenes], MTBE, 1,3-butadiene [1,3-BD], EtOH, formaldehyde [HCHO], and acetaldehyde [CH3CHO]) were measured within 13 MEs in personal breathing zones, and in breath immediately after measured peak pollutant concentrations. The results of these microenvironmental studies were intended to include the upper end of the frequency of annual average inhalation exposures to evaporative and combustion emissions from the three targeted gasolines.
Experimental
Selection of microenvironments
Houston, Chicago, and Atlanta were selected as the study sites. These cities have ongoing ambient monitoring programs and at the time of the study dispensed MTBE-RFG, EtOH-RFG, and conventional gasoline formulations, respectively. lists the MEs chosen along with the number of replicate measurements taken in each ME, whether biomarker (breath) measurements were taken for that ME, and the sampling time spent in each ME. The ME number refers to the same type of ME in each city studied. Because ME6 refers to a roadway tunnel and a suitable tunnel (i.e., sufficiently long with heavy traffic) was not found in Atlanta, ME13 (following a high-emitting vehicle) was substituted.
Table 1. Microenvironment selected for sampling
Prior to selecting specific ME locations, we surveyed potential high-end ME sites in each city. The objectives of these surveys with portable gas analyzers were to determine the suitability of candidate sampling locations with respect to access, maximal exposure levels, and the variability of these exposures. The sampling period in each ME was selected to coincide with maximum activity level in emissions and exposure. In the absence of data on the range of actual emission component exposures in various MEs in each city, we considered available surrogate parameters for emission and dispersion selecting locations and sampling periods with the greatest potential for maximal exposures. These emission surrogates included diurnal traffic counts, variations in highway speeds, length of queues at toll plazas, concurrent numbers of cars refueling, and count rates entering and exiting parking garages. Surrogates for dispersion included diurnal wind speed and direction.
Where possible, we drove parallel to the prevailing wind direction to reduce the impact of crosswinds and sampled downwind of the nearest emission sources. Our sampling strategy also recognized that vehicle exhaust emissions are significantly higher for identified high-emitting vehicles and for all vehicles during cold starts at parking lots, underground garages, and service stations and accelerations at toll plazas and roadway intersections. Out-of-cabin refueling (ME3, ME7) includes exposure to vapor from both refueling and spillage. All service stations sampled were equipped with vapor recovery systems. Spillage was accomplished by intentionally emptying the residual few drops of fuel in the gas pump nozzle onto the service station apron below the fueling port. The fuel tank of the instrumented van (see below) was emptied before the refueling experiments. More detailed description of high-end criteria can be found at Appendix A (pp. 3–13 to 3–17) to CitationZielinska et al. (2009). All of these factors are important in understanding the high-end sampling perspective and the temporal and spatial variations that exist within these high-end MEs.
Monitoring methods
Instrumented van
All in-cabin and out-of-cabin exposure measurements were performed with a 1996 Chrysler minivan, modified for on-road and stationary sampling. The power system included two banks of rechargeable AGM batteries with minimal H2 out-gassing during either charge or discharge. Each bank had a 1750-W inverter for 110 V AC power and direct connections for 12 V DC, giving maximum flexibility. The suspension of the vehicle was upgraded to support the additional battery and instrument weight. Seats were removed and replaced with adjustable equipment racks (Figure S1a, supplementary materials). For refueling experiments, a second fuel pump was installed to facilitate prompt removal of fuel. In-cabin and exterior temperature and relative humidity sensors were installed along with an additional sensor measuring fuel tank temperature. The data acquisition system had eight analog-to-digital inputs to record instrument outputs, which included a global positioning satellite (GPS) sensor, and compiles data into a single database. All in-cabin equipment was manifolded to sample a point in the driver's breathing zone (see Figure S1a, supplemental materials). This manifold inlet could also be extended for outside sampling purposes (e.g., in the subject's breathing zone during refueling tests). Infiltration of outside air was adjusted by opening or closing windows in the front and rear of the cabin and switching the heating/air conditioning system from vent to recirculate. In this manner two ventilation modes, high (H, all open) and low (L, all closed), were included in all in-cabin tests.
Equipment cart
For sidewalk, bus stop, and outdoor toll plaza tests, sampling equipment was placed on a cart (Figure S1b, Supplemental Materials) that patrolled a sidewalk of a busy street in an urban canyon (ME8), near a bus stop at a high-traffic-density intersection (ME9), or next to a toll booth during rush hour traffic (ME12). Sampling inlets were positioned in the subject's breathing zone.
Sampling and analysis methods
Two approaches were used to measure targeted compounds in the high-end MEs: (1) reference method time-integrated samplers to quantify concentrations over 20–40-min sampling periods; and (2) continuous surrogate method monitors to determine short-term concentration variations over 10–60-sec sampling periods.
Reference methods included passive and pressurized whole-air canister samplers used to collect ambient and breath CO, CO2, BTEX, MTBE, and 1,3-BD; acidified 2,4-dinitrophenylhydrazine (DNPH) cartridges to collect HCHO and CH3CHO; and multibed TenaxTA-Carbotrap-Carbosieve solid adsorbent tubes for ambient EtOH (Chicago only). After collection, these samples were sent to the Desert Research Institute (DRI) Organic Analytical Laboratory for analysis. Canister CO and CO2 were chromatographed and converted to methane for analysis by flame ionization detection (GC/FID) (CitationZielinska et al., 2009). BTEX, MTBE, and 1,3-BD were quantified by capillary GC/FID (GC/mass spectrometry [MS] for breath samples) using a separate system (CitationZielinska et al., 1998). The DNPH cartridges were eluted with acetonitrile and aldehydes analyzed by high-performance liquid chromatography (HPLC) with photodiode array ultraviolet (UV) detection of their hydrazone derivatives (CitationZielinska et al., 2001). The multibed absorption tubes were thermally desorbed into a GC and quantified by MS. These methods are basically the standard TO-14A, -15, -11A, and -17 EPA procedures (CitationEPA 1999a, Citation1999b, Citation1999c, Citation1999d).
Surrogate methods included both active nondispersive infrared (NDIR) and passive T-15 Langan electrochemical cell devices for CO, and an active photoionization detector (PID) for nonmethane volatile organic compounds (NMVOCs) with ionization potentials below 10.6 eV, principally olefins and aromatic species. These continuous instruments respond to concentration changes within a few seconds and provide sensitive proportionate measures of the short-term variability of exhaust and evaporative species quantified by the time-integrated reference methods. Surrogate methods are used to generate normalized continuous time series of concentrations for BTEX, MTBE, EtOH, 1,3-BD, and the aldehydes quantified by the reference methods.
Breath measurements were used as exposure biomarkers in four high-end MEs: out-of-vehicle cabin refueling (ME7); parking in an underground garage (ME11); driving through a roadway tunnel (ME6); and trailing a high-emitting vehicle (ME13). The test subject took three breath samples. One sample was taken before initiating ME sampling; the second, 10 sec immediately after completing the active refueling task or within a minute of experiencing a measured peak exposure in the other three MEs; and a third, immediately following the second. The third backup sample was analyzed if there was a problem with the second sample. The subject used a 1-L evacuated canister, placing its inlet tube into his mouth and breathing smoothly and regularly through the mouth around the tube until a resting tidal breathing pattern was established. At the end of a normal tidal exhalation, the subject closed his mouth around the tube and opened the canister valve, expelling his expiratory reserve and filled the canister, which collected 1 L of the expiratory reserve. When the canister was filled, the technician closed the canister valve to capture the sample (CitationLindstrom and Pleil, 1996; CitationPleil and Lindstrom, 2002). All breath samples were analyzed by GC/MS for BTEX, MTBE, 1,3-BD, and EtOH as described by CitationPleil and Lindstrom (2002). CO2 was methanized and quantified by GC/FID. Four subjects were used for breath sample measurements. More detailed description of sampling and analysis methods can be found at Appendix B to CitationZielinska et al. (2009).
Quality assurance
A detailed description of data quality can be found at Appendix H to CitationZielinska et al (2009). Briefly, the sampling equipment was leak-tested and the electronic flow controllers were calibrated prior to the delivery to the field. In addition, the flow controllers were checked at least weekly in the field with a Gillian Gilibrator (Sensidyne). Multibed adsorbent cartridges used for ethanol sample collection were thermally conditioned for 4 hr in an oven at 300 °C under nitrogen purge. Approximately 10% of the precleaned cartridges were tested by GC/FID prior to sampling. The canisters were cleaned by six repeated evacuations and pressurizations with humidified zero air. At the end of the cleaning procedure, 1 canister out of 12 in a lot was filled with humidified ultrahigh-purity (UHP) zero air and analyzed by the GC/FID method. The canisters and multibed adsorbent cartridges were considered clean if the total nonmethane organic compound (NMOC) concentration was less than 10 ppbC, and the concentration of any individual targeted compound was less than 0.2 ppbV .
The GC/FID, HPLC, and GC/MS systems were calibrated initially by multipoint calibration (i.e., three levels plus humid zero air), and regularly checked by a one-point calibration, using the appropriate National Institute of Standards and Technology (NIST) Standard Reference Material (SRM) or other standard traceable to NIST SRM. A day-to-day reproducibility of ±10% was acceptable for either standard.
Zero and span values for the PID and NDIR CO analyzer were checked using ultrapure air and a 500 ppb BTEX mixture or 10.9 ppm CO standard at least once per week and recorded. The zero baselines of both instruments were also checked and adjusted daily prior to the commencement of measurements. Because these instruments were used as surrogates to evaluate the short-term variations in other parameters based on observed correlation with time-integrated sample analyses, no adjustments were made for small (<10%) shifts in instrument calibration.
Because the carbonyl compound ambient measurement results are subject to various artifacts due to interactions with ozone, we used either a honeycomb O3 denuder coated with sodium carbonate/sodium nitrite/glycerol mixture (method developed by Dr. Koutrakis from the Harvard School of Public Health), or a copper tube O3 denuder coated with potassium iodide (KI), as recommended by EPA Method TO-11A. Because ambient NO2 reacts with 1,3 butadiene, we used a honeycomb NO2 denuder coated with triethanoloamine for canister sampling (a method also developed by Dr. Koutrakis).
Results and Discussion
Variation of day-to-day exposure levels by ME for each fuel type
Figures 1 and 2 show the day-to-day summer and winter variations in benzene and CO concentrations in the three cities. Tables S1.1 and S1.2 in Supplemental Materials summarize the three-city, summer–winter, 20–40-min average, maximum, and minimum ME canister levels of CO, 1,3-BD, BTEX, EtOH, and MTBE, and the HCHO and CH3CHO values from DNPH cartridges. Average, maximum, and minimum in/out-cabin temperature and relative humidity (T/ RH) values are also listed.
With the exception of refueling activities (ME3, ME7), we generally find that exposure levels for BTEX are lower in outdoor environments (congested freeway, urban canyon, toll plaza) and higher in enclosed environments (underground garage). However, as shown in and , substantial variations exist among outdoor environments with respect to proximity to emission sources and the magnitude of their emissions. For example, the 40-min average exposure levels for most urban canyon sidewalk/bus stop samples are on the order of 1–2 ppbV for benzene, whereas benzene concentrations on outdoor surface parking lots or toll plaza aprons are usually higher. Refueling samples with fuel spillage range up to few hundred ppbV benzene over 20-min sampling times and show substantial day-to-day variability. In-cabin exposures during vehicle roadway operation show more consistency from sample to sample and more temporal uniformity than the other MEs. It is evident that these high-end variations are substantial and independent of fuel type and season, but related to the activity and emission rates of sources in the given MEs, which differ from day to day.
Figure 1. Time-integrated exposure levels in different MEs in three cities in summer. ME1: in-cabin congested freeway; ME2: in-cabin urban canyon loop; ME3: in-cabin refueling; ME4: in-cabin underground garage; ME5: in-cabin toll plaza; ME6: in-cabin roadway tunnel; ME7: out-of-cabin refueling; ME8: out-of-cabin sidewalk; ME9: out-of-cabin sidewalk/bus stop; ME10: out-of-cabin surface parking; ME11: out-of-cabin underground garage; ME12: outside toll plaza; ME13: in-cabin trailing high-emitter vehicle.
Figure 2. Time-integrated exposure levels in different MEs in three cities in winter. ME1: in-cabin congested freeway; ME2: in-cabin urban canyon loop; ME3: in-cabin refueling; ME4: in-cabin underground garage; ME5: in-cabin toll plaza; ME6: in-cabin roadway tunnel; ME7: out-of-cabin refueling; ME8: out-of-cabin sidewalk; ME9: out-of-cabin sidewalk/bus stop; ME10: out-of-cabin surface parking; ME11: out-of-cabin underground garage; ME12: outside toll plaza; ME13: in-cabin trailing high-emitter vehicle.
Distribution of exposure concentrations within MEs for each fuel type (1-min time series)
Although the integrated methods do not characterize short-term peak exposures in MEs with highly varying exposure levels, they provide a basis for quantifying and deriving correlations between the integrated values and continuous surrogate (S) measures, such as the CO and PID NMVOC monitors, to reconstruct short-term time series. BTEX and 1,3-BD values from the canister measurements can be used to normalize continuous CO and NMVOC traces taken over the same periods to construct BTEX and 1,3-BD time series in exhaust-dominated environments. In a similar manner, the time series of HCHO values can be reconstructed by correlation of the integrated DNPH samples to continuous CO measures.
lists the correlation statistics for relationships between benzene, 1,3-BD, and HCHO measurements from laboratory analysis of canister or DNPH samples and corresponding time averages of continuous data from surrogate methods (NMVOC by PID and CO by NDIR) for the three cities. Statistics are presented separately for the two refueling MEs (ME3 and ME7). It can be seen from that 1,3-BD correlates better with CO than with the PID signal for most MEs; so continuous CO values were used for reconstructing 1-min time series for 1,3-BD for all MEs, with exception of refueling experiments (ME3 and ME7) where evaporative emissions contribute much of the ambient NMVOC. The correlations of benzene with PID NMVOC are statistically significant for all cases, because BTEX originate from both exhaust and evaporative emissions. HCHO does not correlate well with CO, probably due to the photochemical production of this compound in outdoor MEs.
Table 2. Correlation statistics for relationships between laboratory analysis of canister or DNPH samples and corresponding time averages of continuous data from surrogate methods (NMVOC by PID and CO by NDIR) for three cities
In summary, the statistics in indicate that, for the nonrefueling MEs, the NMVOC by PID surrogate measurement is well correlated with benzene, whereas CO by the NDIR method has a stronger correlation to 1,3-BD than the PID. NDIR CO also appears to be correlated with formaldehyde, but with less confidence. For the refueling MEs, the PID still shows significant correlation to benzene, but there is little correlation between 1,3-BD and CO. Some correlation between CO and formaldehyde is only evident for the refueling tests carried out in Houston.
Both 1,3-BD and HCHO are often measured at some gas stations because they originate from exhaust emissions of higher-emitting vehicles.
The NMVOC PID time series was used to reconstruct benzene values (the remaining TEX species follow the benzene time series) and the CO time series was used to reconstruct HCHO and 1,3-BD values. Although the poor correlation of HCHO with CO indicates that the magnitude of the reconstructed formaldehyde is very uncertain, the minute-by-minute variations in CO probably still give a qualitative picture of the corresponding variations in HCHO because the two are somewhat correlated (R 2 = ∼0.3). No CO and NMVOC data were used where the average CO or NMVOC was below the approximate detection limit of the instruments (0.5 ppmV and 25 ppbV, respectively). In each case the approach was the same. The mean value of the compound to be reconstructed was multiplied by the ratio of the surrogate mean to the instantaneous reading. For example, to produce the first-minute value for benzene, the mean benzene canister value was multiplied by the first-minute NMVOC reading divided by the mean NMVOC reading. For HCHO and 1,3-BD, the NDIR CO value was used for all cases where it was available and valid.
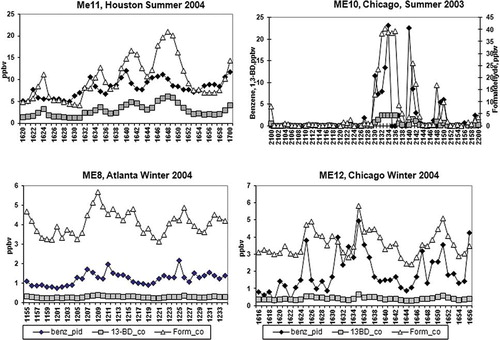
A summary of the reconstructed summer and winter data is presented in Supplemental Materials in Tables S2.1 and S2.2 for benzene, 1,3-BD, and HCHO. The average, maximum, and minimum values for each ME for each fuel type and season are shown. The reconstructed time series are graphically presented in and for selected MEs to illustrate the variability of exposure.
Figure 3. One-minute time series for in-cabin exposures: ME1 (congested freeway), ME2 (urban canyon), ME6 (tunnel), and ME3 (in-cabin refueling).
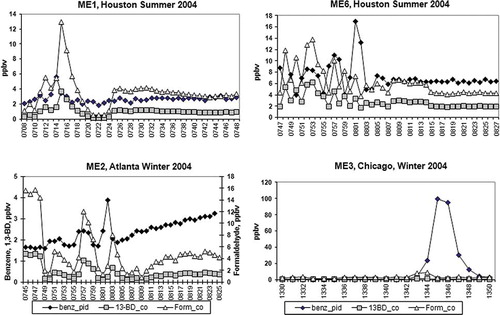
Figure 4. One-minute time series for out-of cabin outdoor exposures: ME8 (sidewalk), ME10 (surface parking), ME11 (underground garage), and ME12 (toll plaza).
For selected in-cabin exposures presented in (ME1: congested freeway, ME2: urban canyon, and ME6: tunnel) the first 20 min of measurement was carried out under high-ventilation conditions with windows open and air recirculation off and the remaining 20 min at low ventilation with windows closed, air conditioning or heating on, and air recirculation on. As can be seen, the second 20 min of measurements are less variable. The concentration of benzene rises steadily for this latter sampling period, reflecting a rising NMVOC signal, probably due to accumulation of out-gassing emissions from vehicle cabin material and the breath of people present in the vehicle cabin. For refueling experiments (in-cabin: ME3 and out-of-cabin: ME7; not shown), the highest exposure concentrations occurred during the active refueling performed during the second 10 min of the sampling period. The highest concentrations were observed for BTEX species as expected from evaporative and spillage emissions during active refueling. HCHO and 1,3-BD present in exhaust emissions are lower and usually not correlated with benzene.
As shown in , outdoor exposure levels in ME8 (sidewalk) and ME12 (toll plaza) are usually lower and less variable. On the other hand, outdoor surface parking (ME10) and out-of-cabin underground garage (ME11) MEs show a higher variability associated with vehicle congestion exiting the parking lots after the end of an athletic event (ME10) or at the end of a work day (ME11).
Oxygenated and conventional gasoline (difference between cities)
shows the MTBE and EtOH concentration variability by ME in Houston and Chicago. Although MTBE was measured in all Houston MEs, the concentrations recorded during refueling were relatively high, in the range of a few ppmV. Similarly high concentrations were recorded in several other studies involving refueling of MTBE-containing gasoline in Finland (CitationVayghani and Weisel, 1999; CitationVainiotalo et al., 1999), Taiwan (CitationLin et al., 2005), and the United States (CitationLindstrom and Pleil, 1996). In contrast, Chicago ethanol concentrations during refueling are lower and, with the exception of one measurement, not very different from other ME concentrations. We used the same gas station in each city for each season's measurements, selecting a high-volume station close to a major freeway. For example, the gas station in Houston was situated next to Tollway 8 and was always very busy. It has to be noted, however, that other important ethanol emission sources exist in an urban environment. For example, it has been reported that ethanol was the main oxygenated volatile organic compound (OVOC) monitored in a Swiss highway tunnel (CitationLegreid et al., 2007a) and in an urban background site in Zurich (CitationLegreid et al., 2007b) even though ethanol was not used as a fuel additive in Switzerland. This was attributed to ethanol being a main ingredient of window wiper fluids.
Figure 5. MTBE and EtOH concentrations in Houston and Chicago, respectively. Note different y-axis scales for Chicago summer and winter. ME1: in-cabin congested freeway; ME2: in-cabin urban canyon loop; ME3: in-cabin refueling; ME4: in-cabin underground garage; ME5: in-cabin toll plaza; ME6: in-cabin roadway tunnel; ME7: out-of-cabin refueling; ME8: out-of-cabin sidewalk; ME9: out-of-cabin sidewalk/bus stop; ME10: out-of-cabin surface parking; ME11: out-of-cabin underground garage; ME12: outside toll plaza; ME13: in-cabin trailing high-emitter vehicle.
shows comparisons of average benzene and CO concentrations by ME in the three cities by season. Tables S1.1 and S1.2 in Supplemental Materials provide the data for all species measured with the time-integrated methods. For refueling MEs, the highest benzene concentrations are observed in Houston in both seasons, possibly due to relatively higher ambient temperatures at this southernmost location. However, for underground garage MEs, Atlanta shows the highest concentrations of benzene, HCHO, and CO. It is, however, not clear whether these findings result from the different fuels, choice of specific ME locations, or the greater variability of high-end ME exposures in general.
Figure 6. Comparison of benzene and CO average concentrations in three cities in summer (upper panels) and winter (lower panels). ME1: in-cabin congested freeway; ME2: in-cabin urban canyon loop; ME3: in-cabin refueling; ME4: in-cabin underground garage; ME5: in-cabin toll plaza; ME6: in-cabin roadway tunnel; ME7: out-of-cabin refueling; ME8: out-of-cabin sidewalk; ME9: out-of-cabin sidewalk/bus stop; ME10: out-of-cabin surface parking; ME11: out-of-cabin underground garage; ME12: outside toll plaza; ME13: in-cabin trailing high-emitter vehicle.
Comparison of summer and winter exposure concentrations
shows the ME differences between benzene and CO concentrations in each city during the summer and winter seasons. For Chicago, the concentrations of benzene and CO are higher in the underground garage (ME4, ME11) during the winter season. The same is true for ME3 and ME7, although CO concentrations are low and comparable for these refueling MEs, as expected. In Houston, benzene is clearly much higher in refueling MEs in the summer. However, for ME4 and ME11, winter concentrations are also marginally higher for benzene and CO. For Atlanta, the summer–winter differences are not very large and inconsistent among different species and MEs. HCHO (not shown) is clearly higher during the summer season (see Tables S1.1 and S1.2 in Supplemental Materials) in all MEs, perhaps as a result of photochemical formation of this compound. The effect of different fuel type (e.g., conventional versus oxygenated) is not clear from these data.
Figure 7. Time-integrated average exposure levels in different MEs in three cities in summer and winter seasons. ME1: in-cabin congested freeway; ME2: in-cabin urban canyon loop; ME3: in-cabin refueling; ME4: in-cabin underground garage; ME5: in-cabin toll plaza; ME6: in-cabin roadway tunnel; ME7: out-of-cabin refueling; ME8: out-of-cabin sidewalk; ME9: out-of-cabin sidewalk/bus stop; ME10: out-of-cabin surface parking; ME11: out-of-cabin underground garage; ME12: outside toll plaza; ME13: in-cabin trailing high-emitter vehicle.
Breath concentrations
shows the average concentrations of BTEX, 1,3-BD, MTBE, EtOH, and CO2 measured in pre- and post-peak-exposure breath for each fuel type and season for four MEs (ME6, ME13, ME7, ME11). As can be seen from this figure, an increase in concentrations of measured species occurs in all cases immediately after a peak exposure. In Atlanta and Chicago, the highest breath concentrations of BTEX and 1,3-BD were observed in ME7 (refueling) and ME11 (underground garage); in Houston, peak concentrations of MTBE were measured in ME7 in summer and winter. Although concentrations of EtOH were measured in breath in all Chicago MEs, it is not clear if they are wholly due to the presence of EtOH in Chicago fuel, because preexposure breath concentrations were occasionally higher than the postexposure concentrations. Subjects were cautioned against consuming alcoholic beverages or using alcoholic personal care products prior to breath testing, but EtOH may also be a metabolic product for certain other food types. For example, CitationTurner and coworkers (2006) reported increased ethanol levels in the breath of healthy individuals who consumed sweet food or drink 2 hr prior to providing breath samples.
Figure 8. Average breath BTEX, 1,3-BD, MTBE, EtOH, and CO2 concentrations in three cities in summer and winter. ME6: in-cabin roadway tunnel; ME7: out-of-cabin refueling; ME11: out-of-cabin underground garage; ME13: in-cabin trailing high-emitter vehicle.
presents the comparison between 1-min surrogate maximum benzene and 1,3-BD concentrations and postexposure breath concentrations in selected MEs and three cites. For 1,3-BD, the refueling ME (ME7) was excluded, as this compound is present predominantly in vehicle exhaust emissions. 1,3-BD breath concentrations correlate relatively well (R 2 = 0.54) with 1-min surrogate maximum concentrations in ME6, ME11, and ME13 (in-cabin roadway tunnel, out-of-cabin underground garage, and in-cabin trailing high-emitting vehicle, respectively). For benzene, different correlations are observed for these three MEs (R 2 = 0.7) and for refueling ME (R 2 = 0.24). This may be due to relatively high and variable peak benzene evaporative concentrations during refueling (see , , and ).
Figure 9. Comparison of 1-min surrogate benzene and 1,3-BD maximum values and postexposure breath concentrations in selected MEs and three cities. ME6: in-cabin roadway tunnel; ME7: out-of-cabin refueling; ME11: out-of-cabin underground garage; ME13: in-cabin trailing high-emitter vehicle.
Conclusions
This study evaluated MSAT exposure concentrations in high-end MEs and concluded that day-to-day ME variations in high-end benzene, 1,3-BD, HCHO, and CO concentrations are substantial and independent of fuel type and season but related to the activity and emission rates of ME sources, which differ from day to day. We also found that with the exception of refueling, exposure levels are generally lower in outdoor MEs and higher within enclosed MEs. BTEX species show the highest concentrations in refueling (with intentional spillage) MEs dominated by evaporative emissions, whereas CO, HCHO, and 1,3-BD are highest in the cold-start, engine-emission-dominated MEs. Continuous NMVOC (PID) and CO (NDIR) data can be used to reconstruct 1-min time series for benzene and 1,3-BD, respectively, provided that averaged continuous measurements are above the 25 ppbV and 0.5 ppmV detection limits of these instruments. CO data can also be used to reconstruct 1-min HCHO data, although less reliably due to poorer correlation between these species. Increases in concentrations of measured species occur in all breath samples collected within a minute of a peak exposure. In Atlanta and Chicago, the highest breath concentrations of BTEX and 1,3-BD were observed in ME7 (refueling) and ME11 (underground garage), respectively. In Houston, the only city using MTBE-RFG, the highest concentrations of MTBE were measured in ME7 (refueling with intentional fuel spillage). The concentrations of benzene and 1,3-BD measured promptly in post-peak-exposure breath samples track corresponding reconstructed ME 1-min maximum surrogate values well.
RFG with either oxygenate had little effect on high-end microenvironmental exposures to MSATs compared with conventional gasoline. Other factors were far greater determinants of exposure than gasoline composition.
uawm_a_712605_sup_29231678.doc
Download MS Word (754.5 KB)uawm_a_712605_sup_28174429.doc
Download MS Word (901 KB)Acknowledgments
This project was funded by the American Petroleum Institute. The authors acknowledge the following DRI personnel for their assistance in sampling and analysis: Larry Sheetz, Mark McDaniel, and Anna Cunningham.
References
- Batterman , S. , Hatzvasilis , G. and Jia , C.R. 2006 . Concentrations and emissions of gasoline and other vapors from residential vehicle garages . Atmos. Environ. , 40 : 1828 – 1844 . doi: 10.1039/b514899e
- Batterman , S. , Jia , C.R. and Hatzivasilis , G. 2007 . Migration of volatile organic compounds from attached garages to residences: A major exposure source . Environ. Res. , 104 : 224 – 240 . doi: 10.1016/j.envres.2007.01.008
- Batterman , S.S. , Peng , C.-y. and Braun , J. 2002 . Levels and composition of volatile organic compounds on commuting routes in Detroit, Michigan . Atmos. Environ. , 36 : 6013 – 6030 . doi: 10.1016/S1352-2310(02)00770-7
- Chan , C.-C. , Ozkaynak , H. , Spengler , J.D. and Sheldon , L. 1991 . Driver exposure to volatile organic compounds, CO ozone, NO2 under different driving conditions . Environ. Sci. Technol. , 25 : 964 – 972 . doi: 10.1021/es00017a021
- Fedoruk , M.J. and Kerger , B.D. 2003 . Measurements of volatile organic compounds inside automobiles . J. Expos. Anal. Environ. Epidemiol. , 13 : 31 – 41 . doi: 10.1038/sj.jea.7500250
- Hun , D.E. , Corsi , R.L. , Morandi , M.T. and Siegel , J.A. 2011 . Automobile proximity and indoor residential concentrations of BTEX and MTBE . Build. Environ. , 46 : 45 – 53 . doi: 10.1016/j.buildenv.2010.06.015
- Jo , W.-K. and Park , K.-H. 1999 . Commuter exposure to volatile organic compounds under different driving conditions . Atmos. Environ. , 33 : 409 – 504 . doi: 10.1016/S1352-2310(98)00201-5
- Kim , S.R. , Dominici , F. and Timothy , T.J. 2007 . Concentrations of vehicle-related air pollutant in an urban parking garage . Environ. Res. , 105 : 291 – 299 . doi: 10.1016/j.envres.2007.05.019
- Legreid , G. , Loov , J.B. , Staehelin , J. , Hueglin , C. , Hill , M. , Buchmann , B. , Prevot , A.S.H. and Reimann , S. 2007a . Oxygenated volatile organic compounds (OVOC) at an urban background site in Zurich (Europe): Seasonal variation and source allocation . Atmos. Environ. , 41 : 8409 – 8423 . doi: 10.1016/j.atmosenv.2007.07.026
- Legreid , G. , Reimann , S. , Steinbacher , M. , Staehelin , J. , Young , D. and Stemmler , K. 2007b . Measurements of OVOCs and NMHCs in a Swiss highway tunnel for estimation of road transport emissions . Environ. Sci. Technol. , 41 : 7060 – 7066 . doi: 10.1021/es062309+
- Lin , C.W. , Chiang , S.B. and Lu , S.J. 2005 . Investigation of MTBE and aromatic compound concentrations at a gas service station . Environ. Monit. Assess. , 55 : 629 – 646 . doi: 10.1007/s10661-005-4334-1
- Lindstrom , A.B. and Pleil , J.D. 1996 . Alveolar breath sampling and analysis to assess exposures to methyl tertiary butyl ether (MTBE) during motor vehicle refueling . J. Air Waste Manage. Assoc. , 46 : 676 – 682 . doi: 10.1080/10473289.1996.10467502
- Lough , G.C. , Schauer , J.J. , Lonneman , W.A. and Allen , M.K. 2005 . Summer and winter nonmethane hydrocarbon emissions from on-road motor vehicles in the Midwestern United States . J. Air Waste Manage. Assoc. , 55 : 629 – 646 . doi: 10.1080/10473289.2005.10464649
- Pleil , J.D. and Lindstrom , A. 2002 . A review of the USEPA's single breath canister (SBC) method for exhaled volatile organic biomarkers . Biomarkers , 7 : 189 – 208 . doi: 10.1080/13547500110119750
- Rodes , C. , Sheldon , L. and Whitaker , D. 1998 . Measuring Concentrations of Selected Air Pollutants inside California Vehicles. Final Report. ARB Contract No. 95–339 , Sacramento : California Air Resources Board .
- Turner , C. , Spanel , P. and Smith , D. 2006 . A longitudinal study of ethanol and acetaldehyde in the exhaled breath of healthy volunteers using selected-ion flow-tube mass spectrometry . Rapid Commun. Mass Spectrom. , 20 : 61 – 68 . doi: 10.1002/rcm.2275
- U.S. Environmental Protection Agency . January 1999 1999a . “ Method TO-17. Determination of volatile organic compounds in ambient air using active sampling onto sorbent tubes ” . In Compendium of Methods for the Determination of Toxic Organic Compounds in Ambient Air— , Second January 1999 , EPA/625/R-96/010bU.S. EPA, Center for Environmental Research Information, Office of Research and Development
- U.S. Environmental Protection Agency . January 1999 1999b . “ Method TO-11A. Determination of formaldehyde in ambient air using adsorbent cartridge followed by high performance liquid chromatography ” . In Compendium of Methods for the Determination of Toxic Organic Compounds in Ambient Air— , Second Vol. xx , January 1999 , xx EPA/625/R-96/010b
- U.S. Environmental Protection Agency . January 1999 1999c . “ Method TO-14A. Determination of volatile organic compounds (VOCs) in ambient air using specially prepared canisters with subsequent analysis by gas chromatograph ” . In Compendium of Methods for the Determination of Toxic Organic Compounds in Ambient Air— , Second Vol. xx , January 1999 , xx EPA/625/R-96/010b
- U.S. Environmental Protection Agency . January 1999 1999d . “ Method TO-15. Determination of volatile organic compounds in air collected in specially-prepared canisters and analyzed by gas chromatography/mass spectrometry ” . In Compendium of Methods for the Determination of Toxic Organic Compounds in Ambient Air— , Second Vol. xx , January 1999 , xx EPA/625/R-96/010b
- Vainiotalo , S. , Peltonen , Y. , Ruonakangas , A. and Plaffli , P. 1999 . Customer exposure to MTBE, TAME, C6 alkyl methyl ethers and benzene during gasoline refueling . Environ. Health Perspect. , 107 : 133 – 140 . doi: 10.1289/ehp.99107133
- Vayghani , S.A. and Weisel , C. 1999 . The MTBE air concentrations in the cabin of automobiles while fueling . J. Expos. Anal. Environ. Epidemiol. , 9 : 261 – 267 . doi: 10.1038/sj.jea.7500037
- Weisel , C. , Lawryk , N.J. and Lioy , P.J. 1992 . Exposure to emissions from gasoline within automobile cabins . J. Expos. Anal. Environ. Epidemiol. , 2 : 79 – 96 . doi: 10.1038/sj.jea.7500037
- Weisel , C.P. 2010 . Benzene exposure: An overview of monitoring methods and their findings . Chem. Biol. Interact. , 184 : 58 – 66 . doi: 10.1016/j.cbi.2009.12.030
- Zielinska , B. , Fujita , E. , Ollison , W. , Campbell , D. , Sagebiel , J. , Merritt , P. and Smith , L. 2011 . Relationships of attached garage and home exposures to fuel type and emission levels of garage sources . Air Qual. Atmos. Health , 5 : 89 – 100 . doi: 10.1007/s11869-010-0121-4
- Zielinska, B., E.M. Fujita, J.C. Sagebiel, and D.E. Campbell. 2009. Section 211(B) Tier 2 high end exposure study of conventional and oxygenated gasoline. Final report prepared for American Petroleum Institute, Washington, DC, March 25, 2009 http://www.regulations.gov/#!documentDetail;D=EPA-HQ-OAR-2003-0065-0673 (http://www.regulations.gov/#!documentDetail;D=EPA-HQ-OAR-2003-0065-0673) (Accessed: 21 September 2012 ).
- Zielinska , B. , Fujita , E. , Sagebiel , J. , Harshfield , G. , Uberna , E. , Hayes , T. and Keene , F. 1998 . Arizona hazardous air pollutants monitoring program . J. Air Waste Manage. Assoc. , 48 : 1038 – 1050 . doi: 10.1080/10473289.1998.10463767
- Zielinska , B. , Sagebiel , J. , Harshfield , G. and Pasek , R. 2001 . Volatile organic compound measurements in the California/Mexico border region during SCOS97 . Sci. Total Environ. , 276 : 19 – 31 . doi: 10.1016/S0048-9697(01)00769-0