Abstract
Sampling of particle-phase organic carbon (OC) from diesel engines is complicated by adsorption and evaporation of semivolatile organic carbon (SVOC), defined as positive and negative artifacts, respectively. In order to explore these artifacts, an integrated organic gas and particle sampler (IOGAPS) was applied, in which an XAD-coated multichannel annular denuder was placed upstream to remove the gas-phase SVOC and two downstream sorbent-impregnated filters (SIFs) were employed to capture the evaporated SVOC. Positive artifacts can be reduced by using a denuder, but particle loss also occurs. This paper investigates the IOGAPS with respect to particle loss, denuder efficiency, and particle-phase OC artifacts by comparing OC, elemental carbon (EC), SVOC, and selected organic species, as well as particle size distributions. Compared to the filter pack methods typically used, the IOGAPS approach results in estimation of both positive and negative artifacts, especially the negative artifact. The positive and negative artifacts were 190 µg/m3 and 67 µg/m3, representing 122% and 43% of the total particle OC measured by the IOGAPS, respectively. However, particle loss and denuder break-through were also found to exist. Monitoring particle mass loss by particle number or EC concentration yielded similar results ranging from 10% to 24% depending upon flow rate. Using the measurements of selected particle-phase organic species to infer particle loss resulted in larger estimates, on the order of 32%. The denuder collection efficiency for SVOCs at 74 L/min was found to be less than 100%, with an average of 84%. In addition to these uncertainties the IOGAPS method requires a considerable amount of extra effort to apply. These disadvantages must be weighed against the benefits of being able to estimate positive artifacts and correct, with some uncertainty, for the negative artifacts when selecting a method for sampling diesel emissions.
Measurements of diesel emissions are necessary to understand their adverse impacts. Much of the emissions is organic carbon covering a range of volatilities, complicating determination of the particle fraction because of sampling artifacts. In this paper an approach to quantify artifacts is evaluated for a diesel engine. This showed that 63% of the particle organic carbon typically measured could be the positive artifact while the negative artifact is about one-third of this value. However, this approach adds time and expense and leads to other uncertainties, implying that effort is needed to develop methods to accurately measure diesel emissions.
Supplemental Materials: Supplemental materials are available for this paper. Go to the publisher's online edition of the Journal of the Air & Waste Management System.
Introduction
The particles emitted by diesel vehicles have been related to adverse effects on health (CitationWichmann et al., 2000), global climate (Menon et al., 2000), and regional air quality (CitationValavanidis et al., 2006). It is important to accurately measure the mass emissions of diesel particles and their composition to be able to predict their impact and ultimately to devise effective, appropriate emission-control strategies. This requires reliable methods for measuring organic carbon (OC) and elemental carbon (EC) as they dominate the composition of diesel particles (Mariq et al., 2007; CitationZhang et al., 2009). However, diesel engines also emit gas-phase organic carbon species in large quantities and over a range of volatilities (CitationSchauer et al., 1999; CitationZielinska et al., 2004). The partitioning of these compounds between gas and particle phase is challenging to accurately determine, given that their apparent proportions are affected by the sampling approach used (CitationSchauer et al., 1999; CitationZielinska et al., 2004; CitationJakober et al., 2008). Thus, there is an ongoing need for improvements to the particle sampling methods to take the uncertainty of equilibrium into consideration.
Diesel particles mainly consist of agglomerates of primary carbon particles and condensed organic compounds, as well as sulfate and metallic ash (Mariq et al., 2007), and the mean diameters are in the range of 60–100 nm (CitationHarris et al., 2001). The gaseous emissions mainly contain nitrogen oxides (NOX), carbon monoxide (CO), carbon dioxide (CO2), and gas-phase OC. For sampling particles to measure total carbon content and the concentration of specific organic species, quartz filters are commonly applied since they can be used in thermal analysis to measure OC and EC. However, due to the challenge already mentioned, it is difficult to accurately measure motor vehicle emissions of particle-phase OC using this approach. During sampling, part of the gas-phase OC in the exhaust flow is adsorbed by the quartz filter while part of the particle-bound semivolatile organic carbon (SVOC) collected on the filter can evaporate. These adsorbed and evaporated parts of gas-phase OC and particle SVOC are referred to as positive and negative artifacts, respectively (CitationTurpin et al., 2000). As discussed later, these artifacts can be large and thus in order to accurately quantify particle OC emissions they need to be corrected for. This is typically done in emissions measurements by placing a second quartz filter behind the filter used to collect particles and assuming that OC on this backup filter is a measure of the positive artifact (CitationTurpin et al., 1994). Another common approach is to determine this artifact OC from a quartz filter in a parallel sampling stream, but with a Teflon filter instead of a quartz filter placed in front. This approach is thought be better because the Teflon does not collect gas-phase OC so this backup filter experiences conditions that are more similar to the front quartz filter (CitationTurpin et al., 2000). However, these approaches are not ideal since they assume the absorptive properties of the second particle-free quartz filter are the same as the front filter and negative artifacts cannot be determined. Furthermore, the OC representing the positive artifact is often of magnitude similar to that of the OC on the front quartz filter (CitationCui et al., 1997) (i.e., the desired measurement quantity is represented by the difference between two similar large numbers).
To minimize and estimate the sampling artifacts of OC, especially the positive artifact, denuders have been used to remove gaseous OC before particle collection on the quartz filter. The positive artifact can be determined by the difference between the OC on the quartz filter collected with and without denuder (CitationCheng et al., 2009). Measuring potential negative artifacts is more challenging, but can also be considered in the denuder-based system by determining the amount of OC adsorbed on backup filters (CitationSubramanian et al., 2004). In addition to OC and EC, several organic species in diesel exhaust, such as polycyclic aromatic hydrocarbons (PAHs), alkanes, hopanes, and steranes are important to measure because they are useful as molecular markers in source apportionment (CitationFraser et al., 2003). Given their range of volatilities, it would be helpful to accurately measure organic species in diesel emissions using denuder-based systems to gain more insight into the sampling artifacts that arise from the use of single quartz filters.
CitationFan et al. (2004a) applied an Amberlite XAD-coated denuder for ambient air particle-phase OC sampling in Vancouver and Toronto, Canada. The mean OC collected on a non-denuded quartz filter in Vancouver, for example, was 3.59 µgC/m3 and on the denuded quartz filter it was 2.52 µgC/m3, indicating that the non-denuded quartz filter contains ∼1.07 µgC/m3 of positive artifact (about 42%). CitationDing et al. (2002) used a charcoal-impregnated diffusion denuder for ambient sampling and measured 12.28 µgC/m3 OC on the denuded quartz filter and 17.54 µgC/m3 OC on the un-denuded filter. By using the denuder, a 5.26-µgC/m3 (43%) positive artifact was avoided. CitationSubramanian et al. (2004) studied negative artifacts associated with ambient sampling and reported a value of 0.28 µg/m3, which represented 6.2% of the OC.
An XAD-coated denuder was coupled with a quartz filter and cartridges or PUFs in diesel emissions sampling work in order to measure the positive artifact and to estimate the distribution of organic compounds in gas and particle phase (CitationSchauer et al., 1999; CitationZielinska et al., 2004; CitationZielinska et al., 2005; CitationJakober et al., 2008). However, these studies have not provided a measurement of the total amount of negative artifact. Only a few studies investigated particle loss through the denuder, such as CitationTemime-Roussel et al. (2004a), which examined denuder performance for diesel particle transmission efficiency with a result of 84 ± 14% at flow rates of 17 L/min and 81 ± 21% at the flow of 34 L/min.
The purpose of this paper is to discuss measurements of positive and negative artifacts determined using denuders and backup filters in the sampling of heavy-duty diesel exhaust. In addition, two potential limitations of using denuders, particle losses and denuder breakthrough, are explored in this paper. Overall the results show that the positive artifacts are large and that negative artifacts are also evident. However, using denuders and backup filters is considerably more labor-intensive and leads to other sources of uncertainty.
In order to systematically evaluate denuder performance for diesel particle emission sampling, three aspects are reported in this paper: (1) quantifying particle transmission efficiency through the denuder, (2) measuring the denuder efficiency in removing gas-phase SVOC, and (3) estimating the artifacts in engine emissions sampling. Particle transmission efficiency estimates are determined by comparing EC, particle-phase organic species, and particle number concentration measured with and without a denuder. The denuder efficiency and positive and negative artifacts are quantified together by comparing OC and SVOC concentrations collected on quartz filters and sorbent-impregnated filters (SIFs) determined using two different sampling configurations.
The integrated organic gas and particle sampler (IOGAPS) method has some advantages when compared with the current method used for diesel particle sampling by the Emissions Research & Measurement Section (ERMS) of Environment Canada (CitationLanni et al., 2001) and at other institutions (CitationCadle et al., 1999). The current ERMS method subtracts the OC on a dynamic blank from the OC collected in the sample line (single quartz filter). The dynamic blank is defined as the OC found on a quartz filter positioned downstream of a Teflon filter and is collected in parallel with the main quartz filter sampling. The dynamic blank is assumed to represent the total positive artifact. This method likely underestimates true particle-phase OC, since the evaporated SVOC (negative artifact) cannot be quantified because it is combined with the positive artifact and subsequently subtracted from the OC collected. Therefore, in this paper, the IOGAPS method is used to examine potential improvements in the quantification of artifacts.
Methods
Choice of denuder type and coating
The main types of denuders that can be used are categorized according to sorbent material and structure. For the sorbents, activated carbon, polydimethylsiloxane (PDMS) and XAD, which is a hydrophobic polyaromatic compound used to catch lower molecular weight hydrophobic compounds, have been used by most of the previous studies. In this study, XAD-coated annular denuder and backup XAD-coated quartz filters were chosen to address the positive and negative artifacts, respectively. In addition to the advantages described in the following, these denuders are easier to coat and to extract with solvents compared to the other options.
The activated-carbon-based denuders include several main kinds of structures, for example, multichannel and monolith. A representative multichannel denuder is the Brigham Young University Organic Sampling System (BOSS) denuder (CitationEatough et al., 1999). It is a 90-cm-long, 5 × 5 cm square aluminum tube containing a multiparallel plate array of filter strips: 17 (4.5 × 58 cm) strips of charcoal impregnated filter (CIF) are separated at the long edges by 2-mm glass rods (CitationEatough et al., 1999; Eatough et al., 1993). When the sampling air passes through the BOSS denuder, more than 90% of the gaseous organic compounds are removed (CitationEatough et al., 1993). Another simplified multichannel denuder is the activated-carbon-filled (ACF) denuder (CitationViana et al., 2006). It is a stainless-steel tube in which two copper nets are coaxially placed, with the space of the inner cupreous net and the space between outer cupreous net and the stainless-steel tube filled with activated carbon (CitationViana et al., 2006). The monolith denuder, which is also called the activated carbon monolith tube (ACM), is a 250-mm-long and 30-mm-diameter activated carbon tube with 230 1-mm2 channels/square inch (CitationSubramanian et al., 2004).
The PDMS based denuder is a PDMS coated ∼25-cm-long stainless-steel tube with a honeycomb structure (stainless steel, 0.05 mm foil, 1.04 mm largest dimension hexagonal cell diameter, 51 mm length, and 100 mm diameter) pressed into the tube (CitationRowe et al., 2010a).
The XAD-based denuder structures are usually annular or honeycomb. The annular denuder is an XAD-coated glass tube with one to eight annular channels with annuli spacing of 1.0, 1.0, 1.2, 1.0, 1.0, 1.0, 1.4, and 1.2 mm (from center outward) and is available in two lengths, 28 and 60 cm (URG, Inc., Chapel Hill, NC) (CitationFan et al., 2003). The annular XAD denuder is coupled with a cyclone and multistage filterpack as the integrated organic gas and particle sampler (IOGAPS), which has been applied to examine artifacts associated with OC measurement in the urban atmosphere (CitationFan et al., 2003; CitationFan et al., 2004b). The honeycomb denuder consists of cells separated by disks and has also been applied in ambient carbonaceous aerosol sampling (CitationMader et al., 2001).
There are advantages and disadvantages of each kind of denuder coating or sorbent. Activated carbon/charcoal has a higher denuder efficiency than XAD for SVOC capture, since more gas-phase OC was observed on SIFs (XAD or CIF filters) placed downstream of an XAD denuder compared to a charcoal denuder (CitationLewtas et al., 2001). But the activated carbon can become loose and shed, thus introducing additional OC and EC onto the filter downstream of the denuder (CitationSubramanian et al., 2004; CitationViana et al., 2006). Overall, XAD is a sorbent with reasonably high collection efficiency (CitationFan et al., 2004a; CitationFan et al., 2003) and has the advantage that the organic compounds adsorbed by XAD can be extracted with solvents for further analysis.
Backup filters are used to adsorb SVOC evaporated from the particle phase to measure the negative artifact. XAD-coated filters (CitationFan et al., 2003; CitationFan et al., 2004a; CitationFan et al., 2004b) and carbon-impregnated filters (CitationSubramanian et al., 2004; CitationEatough et al., 1999; CitationEatough et al., 2003; CitationCheng et al., 2010) are the main kinds of backup filters that are used. XAD-coated quartz filters are able to withstand a higher temperature (350°C) than carbon-impregnated glass-fiber filters (200°C) (CitationCheng et al., 2010), which allows more SVOC to be desorbed and detected. Moreover, the carbon-impregnated filter may adsorb residual solvent from the previous denuder extraction, which could cause overestimation of the gas-phase OC (CitationLewtas et al., 2001).
Sampling setup
Detailed information on the IOGAPS used for this work has been published elsewhere (CitationFan et al., 2003; CitationFan et al., 2004a; CitationFan et al., 2004b) and is briefly summarized here. The IOGAPS is a multicomponent air sampler consisting of a cyclone (URG, Chapel Hill, NC, USA) and a 60-cm-long, eight-channel XAD-4-coated annular glass denuder (Gundel et al., 2001). In this study, three configurations were used and are presented in along with the number of repeat samples. In the standard configuration (), a quartz filter (QD) and two SIFs were set behind the denuder. In the ideal situation, all the gas-phase SVOC, which may cause a positive artifact, will be retained by the denuder and all the SVOC evaporated from the front particle-laden quartz filter will be collected by the two backup SIFs. CitationFan et al. (2003) and CitationLewtas et al. (2001) reported, however, that two layers of SIFs can be insufficient to collect all the SVOC. Consequently, the two SIFs typically underestimate the negative artifact OC, potentially by up to 50%, based upon the approach used by CitationFan et al. (2003) and CitationLewtas et al. (2001) to determine this quantity. This potential low bias is not corrected for in this current work, given its uncertainty, particularly since the already-mentioned studies were for ambient sampling and may not be relevant for the higher concentrations but shorter sampling durations in our diesel exhaust experiments.
Figure 1. Configurations and corresponding repeat samples.
In the breakthrough configuration (), a Zefluor filter was placed upstream of the denuder to remove the particles. It is hypothesized that the gas-phase SVOC would be retained by the denuder and thus not be found on the SIFs. However, this hypothesis is tested later in this paper in examining the denuder efficiency. In order to balance the SVOC adsorption efficiency and particle transmission efficiency, two flow rates of 74 L/min and 30 L/min were chosen to evaluate the denuder performance in our current work.
The breakthrough configuration for 30 L/min was also included in the tests. However, as indicates, no data are reported here at this flow rate. This is because instead of SIFs, EMPORE disks (solid-phase sorbent particles resins embedded in a polytetrafluoroethylene [PTFE] fiber disk, 3M) were used at 30 L/min, in order to test the potential utility of this commercially available alternative choice. However, the EMPORE disks were later found to decompose during heating, so they could not be analyzed for SVOC as could be done with SIFs.
The filter pack configuration (), which was conventionally used for PM sampling, consisted of a cyclone, a quartz filter (Q), and two stages of SIFs. Since the XAD denuder is designed to trap SVOC and is not efficient at capturing VOC, it is assumed here that the amount of VOC trapped by the quartz filter is the same in both standard () and filter pack configurations ().
The selected sampling configurations were based on several reasons. (1) Enable the measurement for both positive and negative artifact. The positive artifact is measured as OC on the quartz filter in the filter pack configuration minus the OC in the standard configuration (CitationCheng et al., 2009; CitationFan et al., 2003). The negative artifact is determined as the SVOC collected on SIFs in the standard configuration. (2) Provide measurements comparable to other single quartz filter studies. (3) The breakthrough configuration is designed to capture the gas-phase SVOC passing through the denuder. For this purpose, we placed only SIFs downstream from the denuder (i.e., no quartz filter before the SIFS). This was done because all the particles are captured upstream on the Teflon filter and it led to less consumption of filters and reduced demand for laboratory analysis.
Samplers set up according to the three configurations were placed side-by-side for the comparisons of PM sampling. The sampling time was 20 min for each sample. CitationFan et al. (2003) applied the same type of denuder in ambient air sampling with a flow rate of 16.7 L/min. In this study, higher flow rates were used in an attempt to minimize particle loss in the denuder since the diesel exhaust contains a large amount of small particles (i.e., <100 nm). At flow rates of 74 L/min and 30 L/min, the residence time in the denuder is 0.34 sec and 0.85 sec, respectively, while the cut sizes of the cyclone are ∼4 µm and ∼7 µm, respectively. Although the cut sizes at the two flow rates are different, little difference was expected in the sampled particles since diesel exhaust particles are expected to be smaller than 1 µm (CitationZhang et al., 2009; CitationCadle et al., 1999; CitationBurtscher 2005). Greater turbulence in the denuder was expected to be a trade-off of the increased flow rates since based on the size of the denuder, the Reynolds numbers are 1656 and 4082 for 30 L/min and 74 L/min, respectively. These are less than 2300 and higher than 4000, respectively, indicating that the flow regime should remain laminar for 30 L/min, but could be turbulent at 74 L/min.
For the 74 L/min sampling, two breakthrough configurations () were running side by side and then repeated. In parallel, one standard configuration () was running along with a straight filter pack (). Then the other standard configuration sample was collected separately in another engine test. Due to the stability of the engine output for the test cycle used and the labor involved in preparing denuders, all samples were collected separately during the 30 L/min evaluations.
After each sample collection, the denuder was extracted using a mixed solvent (hexane, dichloromethane, and methanol, 1:1:1). Each denuder was recoated after 10 samples, although the resin coating can last up to 20 sampling/extraction cycles (CitationFan et al., 1995; CitationKamens et al., 1994). The procedure for the denuder and SIF preparation was based upon the patent of CitationGundel et al. (1995) and was described in CitationFan et al. (2004a) and CitationFan et al. (2004b). Prior to use, the prepared SIFs were kept in an airtight jar and stored in a freezer (<−4°C). Blank prefired quartz filters and SIFs were handled in the same manner as the sampled filters. All measured concentrations reported in this work were blank corrected.
Measurement of particle OC and EC on quartz filters
Particle-phase OC and EC were measured by a thermal optical transmission (TOT) aerosol carbon analyzer (Sunset Laboratory, Inc., Forest Grove, OR). The method was described in detail by CitationSharma et al. (2002) and is summarized here. The temperature program utilized in this method is a combination of the NIOSH 5040 (CitationBirch et al., 1996) and TOR (DRI) methods (CitationChow et al., 1993). During the analysis a 1.45-cm2 punch of quartz filter sample was placed in the instrument and heated from ambient temperature to 250° C for 150 sec, 450°C for 150 sec, 550°C for 180 sec, and 900°C for 90 sec under pure helium, providing an estimation for OC1, OC2, OC3, and OC4. Then the sample was combusted at 550°C for 240 sec, 700°C for 210 sec, and 800°C for 150 sec with a supply of O2 (10% O2 in 90% helium) to measure the EC1, EC2, and EC3 respectively. When heating under the pure He environment, some organic carbon pyrolizes to black carbon, darkening the filter. This darkening was monitored by the transmittance of an He–Ne laser beam at 633 nm. The pyrolysis OC (POC) is defined as the carbon combusted after the initial introduction of oxygen and before the laser reflectance signal achieves its original value (CitationChow et al., 2002) and the POC is assigned to the OC fraction. Thus, OC is defined as OC1 + OC2 + OC3 + OC4 + POC and EC is defined as EC1 + EC2 + EC3 – POC.
Measurement of organic species
Organic compounds (i.e., alkanes, hopanes, steranes, and PAHs) associated with the particles collected on the quartz filters were analyzed by direct thermal desorption coupled with gas chromatography/mass spectroscopy (GC/MS) analysis. The samples were placed in a Gerstel thermal desorption system (TDS) coupled with a GC/MS system (model 6890N GC and 5973 inert MSD, Agilent Technologies, Inc.). This method requires minimal sample preparation and small sample mass, and is rapid, sensitive, and accurate (CitationFalkovich et al., 2001; CitationDing et al., 2009). During the analysis, a punch of filter (7 mm in diameter) was loaded into the thermal desorption glass tube. Then the filter was heated in the TD oven from 25°C to 325°C at a rate of 25°C/min and held at 325°C for 10 min. Organic species desorbed from the filter during heating passed through a heated transfer line (350°C) and were then trapped on a cryogenically cooled injection system (CIS). The initial temperature of the CIS was kept at –30°C with liquid nitrogen. The CIS was then ballistically heated (720°C/min) to 400°C, transferring the organic compounds in a plug form to a DB-5 GC capillary column (5% diphenyl–95% dimethyl siloxane copolymer stationary phase, 0.25 mm ID, 30 m length, 0.25 mm thickness) for the subsequent GC/MS analysis.
Particle number concentration sampling
A scanning mobility particle sizer (SMPS, TSI model 3070) equipped with an ultrafine condensation particle counter (UCPC, TSI model 3025) was set up to measure particle number concentration (both upstream and downstream of the denuder) in the range of 4 nm to 157 nm in electrical mobility diameter.
Measurement of SVOC collected on the backup SIFs
A TOT-based method (CitationFan et al. 2003) was used to quantify SVOC and differentiate the true particle-bound SVOC from the breakthrough VOC. The temperature program during TOT analysis was: 200°C for 240 sec, 350°C for 300 sec in pure helium. All the volatile organic carbon (VOC) is desorbed from the SIF during the first stage (200°C), while SVOC is subsequently desorbed during the second stage (200–350°C).
Generation of diesel engine emissions
A 2005 model heavy-duty engine (Mack 300 HP) with internal exhaust gas recirculation (EGR) was used to generate diesel emissions for this study. The engine was set on an engine dynamometer operated at a steady state with intermediate load conditions such that the average particle mass collected on the filter was similar to that collected during the transient Federal Test Procedure (FTP) cycle. During the test, exhaust was sent to a constant volume sampling (CVS) dilution tunnel and continuously diluted with filtered particle-free filtered ambient air. The flow rate in the CVS was controlled by a Venturi with a typical flow rate of 2780 ± 50 scfm (79 ± 1 m3/min). All the samples reported here are the concentrations after the CVS dilution. Ultra-low-sulfur diesel (ULSD, ∼15 ppm S) was used. Since the engine is running under steady-state condition, the resulting OC/EC ratio in this work should be less than that in the cold start cycle.
Results and Discussion
Particle loss in the denuder
Particle losses were determined through three methods. First, the particle loss in the denuder was determined by comparing particle number concentration upstream and downstream (of the denuder) measured by the SMPS as shown in It can be seen that the particle loss percentage is higher toward lower flow rate and smaller particle size. Assuming that the particles are spherical and the particle density does not vary with particle size, the total mass loss through the denuder is 10% and 24% for 74 L/min and 30 L/min, respectively. The particle loss can also be estimated by calculating the diffusion effect (Supplemental Information), yielding a theoretical mass loss of 3% and 4% at 74 L/min and 30 L/min (with particle diameter measured by SMPS), respectively.
Figure 2. Particle number size distribution measured upstream and downstream of the denuder at two different flow rates in the standard configuration. The orange line represents the particle number concentration just upstream of the denuder. The green and blue lines represent the concentration downstream of the denuder (before reaching the quartz filter) at 74 L/min and 30 L/min, respectively. (Color figure available online).
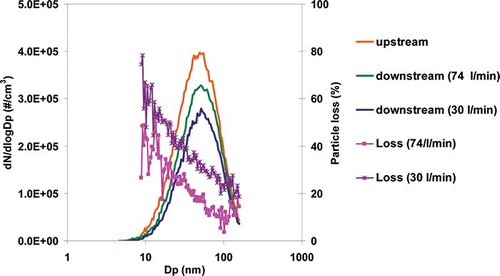
Compared to the calculated results, the measured transmission efficiency is lower. The difference could be attributed to different particle diameters used for the theoretical calculation versus in the laboratory measurements. Specifically, aerodynamic diameter (da) was used in the theoretical calculation, while the mobility diameters (dm) are what was measured in the laboratory by the SMPS. The relationship of da and dm depends on particle density and the shape factor (CitationDeCarlo et al., 2004). Based on experimental measurement of soot from an ethylene flame (CitationMaricq et al., 2004) and from diesel emissions (CitationPark et al., 2003), da is smaller than dm for a particle if the particle size is larger than 50 nm. The diameter used to calculate the theoretical loss here is dm without converting to da. Since smaller particles tend to experience greater loss through the denuder due to their faster diffusion, the transmission efficiency could be overestimated by the theoretical method as applied here. In addition, for particles smaller than 40 nm the electrostatic effect, which reduces transmission efficiency, cannot be neglected (Temime-Roussel et al., 2004), and since it is not considered in the theoretical calculation this may also explain some of the discrepancy.
The second approach for estimating particle loss through the denuder was based on comparing the EC collected on the denuded and undenuded quartz filters (CitationSubramanian et al., 2004; CitationFan et al., 2003). shows the comparison of the EC mass concentration on QD (denuded quartz filter in standard configuration (a)) and Q (quartz filter in filter pack configuration (c)) and indicates a decrease in EC mass concentration of 81 µgC/m3 (10%) and 148 µgC/m3 (20%) for 74 L/min and 30 L/min flow rates, respectively. These values are in good agreement with the total mass loss (10% and 24% for 74 L/min and 30 L/min, respectively) determined by the SMPS. For both estimates greater loss occurred at 30 L/min (laminar flow) than at 74 L/min (turbulent flow), indicating the turbulence was not the most critical reason for the particle loss.
Figure 3. EC collected on QD and Q (with and without a denuder placed upstream of the quartz filter).
The third approach for investigating particle loss was through comparison of mass concentrations of selected particle-phase organic compounds between the denuded and undenuded samples. This included particle-phase PAHs, alkanes, hopanes and steranes. Their mass concentrations, determined from QD and Q, are listed in . The differences shown in are the difference between the average value of QD – 1 and QD – 2 divided by Q, which is equivalent to 1 – (QD – 1 + QD – 2)/2Q.
Table 1. Concentration (ng/m3) of organic compounds collected on the quartz filters in the standard and filter pack configurations. QD-1 and QD-2 are repeat samples. The difference is the difference of the average value of QD-1 and QD-2 divided by Q, which is 1 – (QD – 1 + QD – 2)/2Q
The average total amount of particle-phase alkanes, hopanes, steranes and PAHs on QD was 43 ng/m3 and 34 ng/m3 at 74 L/min and 30 L/min, respectively. Thus, these compounds combined only explain a small portion (∼0.04%) of the OC collected on QD. Consistent with other measurements of organic species in diesel and ambient air the concentrations of the hopanes were less than the alkanes, but higher than the PAHs. It is important to measure hopanes during emissions testing because they are often used as tracers or molecular markers for mobile source PM emissions and thus can be useful for estimating the contribution of vehicle emissions and other sources to ambient OC and PM mass (CitationSubramanian et al., 2007). Steranes have been found to have similar emission sources and behavior as hopanes (CitationCadle et al., 1999).
Compared to the hopanes, steranes, and PAHs, the alkanes represented the majority of the particle-phase organic compounds measured. The C24 and C25 alkane compounds, which are expected to be in the particle phase, were the predominant compounds with C24 at the highest levels. The distribution of alkanes has been studied by Cecinato et al. (1999) in a street canyon by sampling with a single quartz filter. They reported that C23 and C24 alkanes were the most abundant, which is generally consistent with our measurements of a tendency toward the larger alkane sizes.
The averaged difference between QD and Q for the hopane levels measured at 74 L/min is 1.14 ng/cm3 (0.7–2.0 ng/cm3), which is a 31% (24–43%) loss. At 30 L/min, the amount of mass lost is 1.0 ng/cm3 (0.25–1.5 ng/cm3), corresponding to 33% (25–37%).
The particle PAH concentrations were very low with values approaching their detection limits, thus leading to larger uncertainties. Considering only particle PAHs with concentrations greater than 2 ng/m3, for benzo[b+j]fluoranthene, the difference of QD and Q is 1.4 ng/m3 (48%) and 1.2 ng/m3 (49%) at 74 L/min and 30 L/min, respectively; for benzo[e]pyrene, the difference is 1.1 ng/m3 (35%) and 1.0 ng/m3 (41%); and for benzo[a]pyrene, it is 2.3 ng/m3 (65%) and 2 ng/m3 (70%). The average differences among these PAHs are 1.6 ng/cm3 (49%) and 1.4 ng/cm3 (53%) for 74 L/min and 30 L/min, respectively, suggesting slightly more particle mass loss at the lower flow rate.
Using the organic species concentrations, the estimated losses are larger than determined using the other two approaches (i.e., SMPS and EC). However, the particle-phase PAHs and hopanes are reported to be found mostly in particles of about 0.1 µm (CitationMarr et al., 1999) and 0.1–0.3 μm (CitationRiddle et al., 2008) in diameter. For 0.1-μm particles, the losses measured by the SMPS were 22% and 32% for 74 L/min and 30 L/min, respectively. These values are more comparable to the results determined from the particle-phase organic compounds, but still tend to be smaller. If a portion of these compounds was present on even smaller particles, which is not unreasonable to expect for diesel exhaust, then the agreement with the other two approaches for estimating loss would be closer, hence pointing toward reasonable consistency overall. Another possible explanation for greater loss observed based upon the organic compound measurements could be evaporation in the denuder. Semivolatile compounds that are collected on Q (i.e., no denuder) may have evaporated during transit in the denuder and then been adsorbed by the denuder before it reached QD. The residence time in the denuder was 0.34 sec and 0.85 sec for 74 L/min and 30 L/min, respectively, which are longer than the 0.2 sec or 0.3 sec, during which particle-phase OC evaporation can occur (CitationMader et al., 2001; CitationZielinska et al., 2004; CitationStrommen et al., 1999). Therefore, this source of loss could also be part of the reason that the particle transmission efficiency estimated by the differences in the organic compounds was smaller than the other approaches.
Our results are summarized and compared with other studies in . With measurements of the particle size distribution the total mass loss through the denuder was 10% and 24% for 74 L/min and 30 L/min, respectively. Through comparing the EC mass concentrations the particle loss was 10% and 20% for 74 L/min and 30 L/min, respectively, while, by analyzing the organic compound concentrations, the particle loss was about 31–65% and 33–70% for 74 L/min and 30 L/min, respectively. Thus, according to all three approaches, particle losses for diesel emissions are smaller at 74 L/min. As indicated earlier, increased turbulence in the denuder is expected for this higher flow, and this could enhance the loss relative to the theoretical calculation based on laminar flow. However, this was not observed here, with losses being smaller at the faster flow, which is assumed to be due to the shorter residence time.
Table 2. Particle losses through the denuder. EC: comparison of EC measured on a quartz filter sampled with and without a denuder placed upstream. Organic species: comparison of organic species measured on a quartz filter sampled with and without a denuder placed upstream. Mass: calculated from number concentration based on the assumption that the particles are spherical and the density does not change with diameter. The size of sampled particles is listed
In some ambient sampling applications particle loss was found to be minor, ranging from about 3% (CitationMader et al., 2001) to 0%—no significant difference (CitationDing et al., 2002; CitationFan et al., 2003; CitationFan et al., 2004b; CitationCheng et al., 2010). These smaller losses for ambient measurements are not unexpected, given that particle sizes were likely larger with the dominant mass in the accumulation mode. Noll et al. (2008) found 18% of EC loss in the activated carbon denuder for diesel emission sampling, which is similar to the present measurement (). However, CitationSchauer et al. (1999) did not find EC loss in denuder-based sampling (XAD-coated glass denuder, 4-channel, 40 cm long, at 30 L/min) of diesel emissions.
Overall, the particle loss in the current work tends to be higher in than some of the previous work. As suggested earlier, one reason for the larger particle loss in this current work is the small particle size associated with diesel emissions. The geometric mean diameter can be calculated based on the SMPS results according to
where ni is the number of particles in the ith diameter range; di is the cut diameter of the ith diameter range; and N is the total particle number. Using this approach for our experiments, the Dg in the diesel exhaust was 45 nm. This is indeed smaller than most of the other studies listed in .
Given that there is good agreement between the EC and SMPS measurement approaches and some reasonable explanations for higher losses based upon specific organic species, as well as the results of other work (), it is clear that particle loss does occur and should be taken into consideration in using denuders for engine exhaust measurements.
Denuder SVOC collection efficiency
The efficiency of the denuder can be calculated from theory, given information on denuder size, flow rate, and the gas-phase diffusion coefficient (Possanzini et al., 1982). Using this approach the calculated efficiency at 74 L/min is higher than 99.5% for all the gas-phase SVOC species. Since the denuder is used to remove the gas-phase SVOC, which could be adsorbed by the quartz filter and/or could pass through the quartz filter and be adsorbed by SIFs (CitationCheng et al., 2009), the denuder efficiency can be estimated from the measurements using the following equation:
where SVOCb and SVOCc are the SVOC captured by the SIFs in breakthrough configuration (b) and filter pack configuration (c).
SVOCb represents the total SVOCs that break through the denuder and are retained by the SIFs. In contrast, SVOCc represents the total SVOC retained by the SIFs, including also the SVOCs that would be collected by the denuder in the breakthrough configuration (b). It has to be stated that in Equationeq 2, this efficiency is only for gas-phase SVOC as the VOCs measured from the SIFs at temperatures below 200°C are not considered. This is because the XAD-coated denuder is designed to efficiently adsorb gas-phase SVOC and not VOCs, as the latter compounds are highly volatile and so are not expected to contribute significantly to positive and negative artifacts during sampling.
Assuming the denuder is 100% efficient, then SVOCb (blank corrected) should be zero. shows that this was not the case with 236 µgC/m3 measured from the 2 SIFS used in the breakthrough configuration. Thus, the denuder is not retaining all of the SVOC, although also shows that SVOCc was much larger indicating that the denuder is capturing a significant amount of SVOC. Using Equationeq 2, the denuder efficiency is estimated, on average, to be 84%. This is considerably less than the theoretical value and we hypothesize that this could be due to the following two main factors:
Figure 4. Averaged OC and SVOC on quartz filters and two SIFs captured in the three configurations: standard configuration (a in ), breakthrough configuration (b in ), and filter pack configuration (c in ). The number of repeat tests (flow rate of 74 L/min) is given in
| 1. | Denuder adsorption capacity. Since the actual capacity for SVOC with XAD coating is unknown, the gas-phase SVOC concentration may have exceeded the denuder capacity for some of the samples. This is because, although the theoretical estimate indicates that the denuder has the dimensions to be highly efficient, the ability of the XAD coating to capture and retain the SVOCs also plays a role. Consequently, the actual capacity of the XAD denuder coating could be affected by residence time since the adsorption surfaces become occupied during sampling, thus requiring a longer residence time to trap all the gas-phase SVOC. Breakthrough would occur when the time for trapping is longer than the residence time. CitationTemime-Roussel et al. (2004b) used naphthalene to test the denuder capacity and found that when the gas flow residence time decreased from 0.73 sec to 0.39 sec, the adsorption capacity of the denuder decreased from 3800 to 1800 mg per gram of XAD. Higher concentrations during sampling may also impact capacity as the adsorption surfaces become occupied more quickly. | ||||
| 2. | Incomplete SVOC adsorption on the SIFs leading to uncertainty from Equationeq 2. The total SVOC measured by the IOGAPS in CitationFan et al. (2003) was around 120 µg C, while the SVOC determined in breakthrough configurations (b) and filter pack configuration (c) in the present work was as high as 263 µg C and 1238 µg C, which is 2 or 10 times higher than their reported values (CitationFan et al., 2003), respectively. These high concentrations increase the potential for breakthrough of both SIFs since there was sustained sampling at high concentrations. In this case, the SVOCs have the potential to migrate through the SIFs and escape downstream, particularly as more and more adsorption sites become occupied. Furthermore, SVOC collected on the SIFs may evaporate due to pressure, temperature, or concentration changes. Therefore, both SVOCb and SVOCc are likely biased low, but given the much higher concentration, it is reasonable to expect that SVOCc will be biased low by a higher amount leading directly to a smaller estimated value for denuder efficiency in Equationeq. 2. Based on the measurements obtained from the four sets of breakthrough configuration sampling, the denuder collection efficiency is within the range of 79–93% at 74 L/min. While these values can be considered lower limits due to the incomplete adsorption of the SVOC by the SIFs, the results in show that it is clearly not 100%. | ||||
Particle-phase OC sampling positive artifacts
The purpose of using the IOGAPS was to improve measurements of particle OC emissions by reducing artifacts and potentially to quantify the particle-phase OC, which is more semivolatile and thus evaporates from the quartz filter during sampling. Past studies over a range have used denuder-based sampling methods to improve quantification of the particle-phase OC by minimizing positive artifacts (CitationFan et al., 2003; CitationTemime-Roussel et al., 2004a; CitationRowe et al., 2010b). The concentration of OC and SVOC captured in each configuration is shown in Particle-phase OC sampling positive artifact is the part of the gas-phase OC that is adsorbed onto the quartz filter. This can be calculated by comparing the OC on the denuded and undenuded quartz filters (CitationCheng et al., 2009; CitationSubramanian et al., 2004) according to:
where OCQ and OCQD refer to the OC collected on the un-denuded and denuded quartz filter.
At 74 L/min and 30 L/min, the average OCQD values are 112 µgC/m3 and 80 µgC/m3, while the average OCQ values are 302 µgC/m3 and 562 µgC/m3, respectively. Therefore, by using the denuder, average particle OC positive artifacts of 190 µgC/m3 and 482 µgC/m3 were avoided for the two different flow rates. This corresponds to a 63% and an 86% positive bias at 74 L/min and 30 L/min, respectively, if only a single quartz filter is used to measure particle OC emissions. If the particle loss of 10% and 20% for 74 L/min and 30 L/min (obtained by EC comparison) is taken into account, then the concentrations of total particle OC will increase. The result is that the net positive artifact associated with filter pack configuration (c) reduces to 161 µg/m3 (59%) and 367 µg/m3 (82%) for 74 L/min and 30 L/min, respectively. As expected, the positive artifact at 74 L/min is lower than that for 30 L/min, which is due to a higher filter face velocity and the resulting increase in pressure drop (CitationMcDow et al., 1990). The face velocities in the current work were 102 cm/s and 41 cm/s at 74 L/min and 30 L/min, respectively. McDow et al. (1990) reported a significant decrease (7–36%) in OC collected by a quartz filter when the filter face velocity increased from 15 cm/sec to 80 cm/sec (corresponds to a ∼2% change in pressure drop) due to less gas-phase OC adsorption. CitationTurpin et al. (2000) also found ∼18% less OC on the quartz filters sampling at a face velocity of 80 cm/sec versus at 40 cm/sec.
Given that the denuder does prevent some particle OC positive artifact, it can potentially help provide more accurate measurements of diesel exhaust organic compounds. However, particle loss and denuder breakthrough issues do need to be considered. The concentrations of semivolatile PAHs on QD and Q are listed in . The definition of semivolatile PAHs used here is those PAHs that on a year-round basis have a particulate fraction that is between 10% and 90% of the total PAH (gas + particle) based on the PAH partitioning data from Environment Canada's Integrated Atmospheric Deposition Network (IADN) (CitationGalarneau et al., 2006). The positive artifact (difference) of semivolatile PAHs sampling on a quartz filter is from 27% to 57%. At both flow rates, the more volatile PAHs (fluoranthene and pyrene) have a higher positive artifact than less volatile PAHs (triphenylene and chrysene). Thus, it is clear that single quartz filter sampling (c) leads to positive artifacts resulting in increasing uncertainty regarding the fraction of some semivolatile compounds in the particle phase.
As listed in , the value in the “Difference” column of the semivolatile PAHs is similar to that of the particle-phase PAHs. This could be the result of the different size distributions of the semivolatile and nonvolatile particle-phase species. For example, the size distributions of some semivolatile PAHs; fluoranthene, pyrene and benz[a]anthracene, were observed to have two peaks, one at about 0.1 µm and the other at about 1 µm. Meanwhile, the size distribution of much less volatile PAHs, benzo[e]pyrene and benzo[ghi]perylene, were observed to have only one peak at around 0.1 µm (CitationMarr et al., 1999). Since the particle transmission efficiency is higher for larger particles, the semivolatile and nonvolatile particle-phase PAHs appear to have comparable reductions in the difference column in .
The benefit of reducing positive artifacts using the IOGAPS is complicated by particle loss and denuder breakthrough. Uncertainties in the IOGAPS measurements can be expected because the denuder efficiency for the diesel emission sampling is not 100%. This breakthrough gas-phase SVOC would be adsorbed on QD as a positive artifact. This would lead to an overestimate of the particle OC using the standard configuration (a), but perhaps not as much of an uncertainty compared to the underestimate of the positive artifact associated with measurements taken using filter pack configuration (c). However, these differences in uncertainty are difficult to quantify. Assuming that the gas-phase SVOC adsorption on the quartz filter is proportional to the gas-phase SVOC in the sample flow and a denuder efficiency of 84%, the gas-phase SVOC adsorbed on QD, which has been incorrectly measured as particle OC, would be (100 – 84%) × 219 = 35 µgC/m3, where the value of 219 µgC/m3 comes from the measurement of SVOCb.
There are some additional, but likely less important, factors influencing the positive artifact and denuder efficiency calculations that need to be pointed out. As discussed earlier, during sampling, the equilibrium of OC in the gas and particle phases is disturbed by the denuder. When the surrounding gas-phase OC is removed, the particle SVOC would subsequently partition into the gas phase while still in the denuder. CitationKamens et al. (1997) measured and modeled the off-particle gassing of phenanthrene inside an activated carbon denuder. Based on the results of Kamens et al. (1997), 8% and 21% of phenanthrene is released at 74 L/min and 30 L/min respectively. However, among the PAHs and among the large number semivolatile organic species, phenanthrene is a particularly volatile example. For many of the particle-phase OC compounds with smaller gas–particle partition coefficients the evaporation percentage in the denuder will be smaller, thus indicating that the impact of OC repartitioning can be neglected.
Particle-phase OC sampling negative artifacts
The best approach to determine negative artifacts due to SVOC evaporation from the collected particles is still under debate. CitationSubramanian et al. (2004) calculated the negative artifact by comparing the gas-phase OC in the sample line (OC adsorbed on a carbon impregnated glass-fiber filter placed downstream of a denuder and a quartz filter) and the dynamic blank (OC adsorbed on a carbon impregnated glass-fiber filter placed downstream of a Teflon filter, a denuder, and a quartz filter). CitationChow et al. (2010) adopted a quartz filter behind a quartz filter method, using the OC on the backup quartz filter as the negative artifact. CitationWatson et al. (2009) considered the negative artifact as the OC collected on a backup filter downstream of a denuder and a quartz filter when the denuder removes all the gas-phase OC. In this work, the efficiency of the denuder was estimated to be relatively low (84%). Thus, the negative artifact calculation method used by CitationSubramanian et al. (2004a) is applied here as Equationeq 4:
where SVOCa is the SVOC captured by the SIFs in standard configuration (a). The values of SVOCa and SVOCb at 74 L/min are shown in The difference between averaged SVOCa and averaged SVOCb is 67 µgC/m3, which is about one-third of the magnitude of the positive artifact (190 µgC/m3). The SVOC concentration in this diesel emissions IOGAPS sampling is much higher than ambient sampling work. As a result, the measurement of the negative artifact here, at more than 60 µgC/m3, is substantially larger than the value of 3 µg/m3 found for ambient measurements (CitationChow et al., 2010).
Our estimation of the negative artifact could still be complicated for several reasons: (1) overestimation of SVOCb because of no quartz filter placed downstream of the denuder in the breakthrough configuration, (2) incomplete adsorption of negative artifact SVOCs on the SIFs, and (3) the OC partitioning discussed in the previous section. Since the SVOC quantification includes the uncertainties as discussed earlier, the uncertainty in the negative artifact is propagated through the calculations below.
The final particle-phase OC can best be estimated based on the particle loss and positive and negative artifacts. Here the average value of particle-phase OC is calculated as 112 µgC/m3 (OCQD) + 112 µgC/m3 × 0.1/(1 – 0.1) (particle loss) + 67 µgC/m3 (negative artifact) – 35 µgC/m3 (remaining positive artifact) = 156 µgC/m3. Considering the error bar associated with the measurement of OC on QD due to particle loss and positive artifact, the final particle OC is estimated to be 156 ± 11 µgC/m3. Therefore, this IOGAPS study shows that the negative artifact is considerable at 43% of the total particle OC (67 µgC/m3 vs. 156 µgC/m3). In the atmosphere, this poorly measured fraction of the particle OC could be of even greater importance. This is because it may represent the fraction of OC that is more likely to return to the gas phase upon greater dilution of diesel emissions, only to contribute later to secondary organic aerosol (CitationRobinson et al., 2007).
Conclusions
There is an ongoing need to more accurately measure particulate matter emissions from diesel engines. This paper provides insight into the particle loss, collection efficiency, and positive and negative artifacts associated with use of denuders for diesel emission experiments. It is observed that the particle loss through the denuder used in the integrated organic gas and particle sampler (IOGAPS) cannot be neglected. Three different approaches—particle number loss, nonvolatile organic compound loss, and EC loss—all reveal the same trend with a minimum of 10% of the particle mass not transmitting through the denuder. This study also provides new and potentially more accurate estimates of the concentrations of organic species, such as semivolatile PAHs, in diesel exhaust.
Beside better estimation of the artifacts, the denuder can also be extracted to measure the emissions of gas-phase organic compounds (not reported in this study), which can be a challenge to accurately quantify in situations such as just after emission and dilution. For example, this includes some volatile organic compounds (e.g., naphthalene and methylnaphthalenes) that are not quantitatively captured by traditional techniques. However, particle loss occurs in the denuder and there are uncertainties associated with denuder adsorption efficiency and retention, which is also an issue associated with the SIFs. Consequently, the uncertainties in the IOGAPS measurements characterized here and the additional laboratory work involved in applying a denuder-based sampling approach need to be carefully weighed against the improved characterization of positive and negative artifacts before considering use of denuders for diesel emissions sampling work.
Assuming that the benefits of using the IOGAPS for emissions research are outweighed by the limitations and that the conventional diesel particle sampling method has other limitations, it is clear there remains a significant need for better approaches for diesel engine emission measurement of organic semivolatile particles. Generally, several aspects are recommended for future study: (1) development of denuders with higher efficiency; (2) evaluation of approaches that reduce contact time in the denuder; (3) quantification of XAD adsorption capacity under various SVOC concentrations and determination of sampling methodologies that ensure denuder efficiency remains at a high level; (4) more efficient sorbent filters that still permit quantitative desorption for subsequent analysis of total SVOC and selected organic compounds; and (5) development of high time resolution on-line instrumental techniques for gas and particle-phase OC emission measurements. These techniques will need to be able provide the data required for accurate quantification of emissions for assessing new engine/fuel technology performance, setting emissions standards, and for development of air quality modeling emission inventories.
Nomenclature
| IOGAPS | = |
integrated organic gas and particle sampler |
| SIFs | = |
sorbent impregnated filters |
| Configuration (a) | = |
standard configuration with a denuder followed by one quartz filter and two XAD-impregnated quartz filters |
| Configuration (b) | = |
breakthrough configuration with a Teflon filter followed by a denuder followed by two XAD impregnated quartz filters |
| Configuration (c) | = |
filter pack configuration with one single quartz filter in a filter pack |
| QD | = |
quartz filter behind a denuder, in configuration (a) |
| Q | = |
quartz filter in configuration (c) |
| OC | = |
organic carbon |
| EC | = |
elemental carbon |
| SVOC | = |
semivolatile organic carbon |
| OCQD | = |
OC collected on QD |
| OCQ | = |
OC collected on Q |
| SVOCa | = |
SVOC captured by the SIFs in configuration (a) |
| SVOCb | = |
SVOC captured by the SIFs in configuration (b) |
| SVOCc | = |
SVOC captured by the SIFs in configuration (c) |
Supplementary Materials
Download MS Word (59 KB)Acknowledgments
The authors thank Dr. Elisabeth Galarneau in AQRD, Environment Canada, for her helpful insight on PAH partitioning.
References
- Arnott , W.P. , Zielinska , B. , Rogers , C.F. , Sagebiel , J. , Park , K.H. , Chow , J. , Moosmuller , H. , Watson , J.G. , Kelly , K. , Wagner , D. , Sarofim , A. , Lighty , J. and Palmer , G. 2005 . Evaluation of 1047-nm Photoacoustic Instruments and Photoelectric Aerosol Sensors in Source-Sampling of Black Carbon Aerosol and Particle-Bound PAHs from Gasoline and Diesel Powered Vehicles . Environmental Science & Technology , 39 : 5398 – 5406 . doi: 10.1021/es049595e
- Birch , M.E. and Cary , R.A. 1996 . Elemental Carbon-Based Method for Monitoring Occupational Exposures to Particulate Diesel Exhaust . Aerosol Science and Technology , 25 : 221 – 241 . doi: 10.1080/02786829608965393
- Burtscher , H. 2005 . Physical Characterization of Particulate Emissions from Diesel Engines: A Review . Journal of Aerosol Science , 36 : 896 – 932 . doi: 10.1016/j.jaerosci.2004.12.001
- Cadle , S.H. , Mulawa , P.A. and Hunsanger , E.C. 1999 . Compsition of Light-Duty Motor Vehicle Exhaust Particulate Matter in the Denver, Colorado Area . Environmental Science & Technology , 33 : 2328 – 2339 . doi: 10.1021/es9810843
- Cheng , Y. , He , K.B. , Duan , F.K. , Zheng , M. , Ma , Y.L. and Tan , J.H. 2009 . Measurement of Semivolatile Carbonaceous Aerosols and Its Implications: A Review . Environment International , 35 : 674 – 681 . doi: 10.1016/j.envint.2008.11.007
- Cheng , Y. , He , K.B. , Duan , F.K. , Zheng , M. , Ma , Y.L. , Tan , J.H. and Du , Z.Y. 2010 . Improved Measurement of Carbonaceous Aerosol: Evaluation of the Sampling Artifacts and Inter-Comparison of the Thermal-Optical Analysis Methods . Atmospheric Chemistry and Physics , 10 : 8533 – 8548 . doi: 10.5194/acp-10-8533-2010
- Chow , J.C. , Watson , J.G. , Pritchett , L.C. , Pierson , W.R. , Frazier , C.A. and Purcell , R.G. 1993 . The Dri Thermal Optical Reflectance Carbon Analysis System—Description, Evaluation and Applications in United States Air-Quality Studies . Atmospheric Environment , 27 : 1185 – 1201 . doi: 10.1016/0960-1686(93)90245-T
- Chow , J.C. and Watson , J.G. 2002 . PM2.5 Carbonate Concentrations at Regionally Representative Interagency Monitoring of Protected Visual Environment Sites . Journal of Geophysical Research , 107 ( D21 ) : 8344 doi: 10.1029/2001JD000574
- Chow , J.C. , Watson , J.G. , Chen , L.W.A. and Frank , N.H. 2010 . Quantification of PM2.5 organic carbon sampling artifacts in US networks . Atomspheric Chemistry and Physics , 10 : 5223 – 5239 . doi: 10.5194/acp-10-5223-2010
- Cui , W.X. , Machir , J. , Lewis , L. , Eatough , D.J. and Eatough , N.L. 1997 . Fine Particulate Organic Material at Meadview During the Project Mohave Summer Intensive Study . J. Air Waste Manage. Assoc. , 47 : 357 – 369 . doi: 10.1080/10473289.1997.10464438
- DeCarlo , P.F. , Slowik , J.G. , Worsnop , D.R. , Davidovits , P. and Jimenez , J.L. 2004 . Particle Morphology and Density Characterization by Combined Mobility and Aerodynamic Diameter Measurements. Part 1: Theory . Aerosol Science and Technology , 38 : 1185 – 1205 . doi: 10.1080/02786826.2004.10399461
- Ding , Y.M. , Pang , Y.B. and Eatough , D.J. 2002 . High-Volume Diffusion Denuder Sampler for the Routine Monitoring of Fine Particulate Matter: I. Design and Optimization of the PC-BOSS . Aerosol Science and Technology , 36 : 369 – 382 . doi: 10.1080/027868202753571205
- Ding , L.C. , Ke , F. , Wang , D.K.W. , Dann , T. and Austin , C.C. 2009 . A New Direct Thermal Desorption-GC/MS Method: Organic Speciation of Ambient Particulate Matter Collected in Golden, BC . Atmospheric Environment , 43 : 4894 – 4902 . doi: 10.1016/j.atmosenv.2009.07.016
- Eatough , D.J. , Wadsworth , A. , Eatough , D.A. , Crawford , J.W. , Hansen , L.D. and Lewis , E.A. 1993 . A Multiple-System, Multichannel Diffusion Denuder Sampler for the Determination of Fine-Particulate Organic Material in the Atmosphere . Atmospheric Environment , 27 : 1213 – 1219 . doi: 10.1016/0960-1686(93)90247-V
- Eatough , D.J. , Obeidi , F. , Pang , Y. , Ding , Y. , Eatough , N.L. and Wilson , W.E. 1999 . Integrated and Real-Time Diffusion Denuder Sample for PM2.5 . Atmospheric Environment , 33 : 2835 – 2844 . doi: 10.1016/S1352-2310(98)00326-4
- Eatough , D.J. , Eatough , N.L. , Pang , Y. , Sizemore , S. , Kirchstetter , T.W. , Novakov , T. and Hobbs , P.V. 2003 . Semivolatile Particulate Organic Material in Southern Africa During Safari 2000 . Journal of Geophysical Research , 108 ( D13 ) : 8479 doi: 10.1029/2002JD002296
- Falkovich , A.H. and Rudich , Y. 2001 . Analysis of Semivolatile Organic Compounds in Atmospheric Aerosols by Direct Sample Introduction Thermal Desorption GC/MS . Environmental Science & Technology , 35 : 2326 – 2333 . doi: 10.1021/es000280i
- Fan , Z.H. , Chen , D.H. , Birla , P. and Kamens , R.M. 1995 . Modeling of Nitro-Polycyclic Aromatic Hydrocarbon Formation and Decay in the Atmosphere . Atmospheric Environment , 29 : 1171 – 1181 . doi: 10.1016/1352-2310(94)00347-N
- Fan , X. , Brook , J.R. and Mabury , S.A. 2003 . Sampling Atmospheric Carbonaceous Aerosols Using an Integrated Organic Gas and Particle Sampler . Environmental Science & Technology , 37 : 3145 – 3151 . doi: 10.1021/es026471y
- Fan , X. , Brook , J.R. and Mabury , S.A. 2004a . Measurement of Organic and Elemental Carbon Associated with PM2.5 During Pacific 2001 Study Using an Integrated Organic Gas and Particle Sampler . Atmospheric Environment , 38 : 5801 – 5810 . doi: 10.1016/j.atmosenv.2004.01.052
- Fan , X. , Lee , P.K.H. , Brook , J.R. and Mabury , S.A. 2004b . Improved Measurement of Seasonal and Diurnal Differences in the Carbonaceous Components of Urban Particulate Matter Using a Denuder-Based Air Sampler . Aerosol Science and Technology , 38 : 63 – 69 . doi: 10.1080/027868290504090
- Fraser , M.P. , Yue , Z.W. and Buzcu , B. 2003 . Source Apportionment of Fine Particulate Matter in Houston, TX, Using Organic Molecular Markers . Atmospheric Environment , 37 : 2117 – 2123 . doi: 10.1016/S1352-2310(03)00075-X
- Galarneau , E. , Bidleman , T.F. and Blanchard , P. 2006 . Seasonality and Interspecies Differences in Particle/Gas Partitioning of PAHs Observed by the Integrated Atmospheric Deposition Network (IADN) . Atmospheric Environment , 40 : 182 – 197 . doi: 10.1016/j.atmosenv.2005.09.034
- Gundel , L.A. , Lee , V.C. , Mahanama , K.R.R. , Stevens , R.K. and Daisey , J.M. 1995 . Direct Determination of the Phase Distributions of Semi-Volatile Polycyclic Aromatic Hydrocarbons Using Annular Denuders . Atmospheric Environment , 29 : 1719 – 1733 . doi: 10.1016/1352-2310(94)00366-S
- Harris , S.J. and Maricq , M.M. 2001 . Signature Size Distributions for Diesel and Gasoline Engine Exhaust Particulate Matter . Journal of Aerosol Science , 32 : 749 – 764 . doi: 10.1016/S0021-8502(00)00111-7
- Jakober , C.A. , Robert , M.A. , Riddle , S.G. , Destaillats , H. , Charles , M.J. , Green , P.G. and Kleeman , M.J. 2008 . Carbonyl Emissions from Gasoline and Diesel Motor Vehicles . Environmental Science & Technology , 42 : 4697 – 4703 . doi: 10.1021/es7029174
- Kamens , R.M. , Fan , Z.H. , Yao , Y.L. , Chen , D.H. , Chen , S.F. and Vartiainen , M. 1994 . A Methodology for Modeling the Formation and Decay of Nitro-PAH in the Atmosphere . Chemosphere , 28 : 1623 – 1632 . doi: 10.1016/0045-6535(94)90421-9
- Kamens , R.M. and Coe , D.L. 1997 . A Large Gas-Phase Stripping Device to Investigate Rates of PAH Evaporation from Airborne Diesel Soot Particles . Environmental Science & Technology , 31 : 1830 – 1833 . doi: 10.1021/es961083f
- Lanni , T. , Chatterjee , S. , Conway , R. , Windawi , H. , Rosenblatt , D. , Bush , C. , Lowell , D. , Evans , J. and McLean , R. 2001 . Performance and Durability Evaluation of Continuously Regenerating Particulate Filters on Diesel Powered Urban Buses at NY City Transit . SAE 2001-01-0511 , http://www.walshcarlines.com/pdf/hybrid/SAE%202001-01-0511.pdf
- Lewtas , J. , Pang , Y.B. , Booth , D. , Reimer , S. , Eatough , D.J. and Gundel , L.A. 2001 . Comparison of Sampling Methods for Semi-Volatile Organic Carbon Associated with PM2.5 . Aerosol Science and Technology , 34 : 9 – 22 . doi: 10.1080/02786820118935
- Mader , B.T. , Flagan , R.C. and Seinfeld , J.H. 2001 . Sampling Atmospheric Carbonaceous Aerosols Using a Particle Trap Impactor/Denuder Sampler . Environmental Science & Technology , 35 : 4857 – 4867 . doi: 10.1021/es011059o
- Maricq , M.M. and Ning , X. 2004 . The Effective Density and Fractal Dimension of Soot Particles from Premixed Flames and Motor Vehicle Exhaust . Journal of Aerosol Science , 35 : 1251 – 1274 . doi: 10.1016/j.jaerosci.2004.05.002
- Maricq , M.M. 2007 . Chemical Characterization of Particulate Emissions from Diesel Engines: A Review . Journal of Aerosol Science , 38 : 1079 – 1118 . doi: 10.1016/j.jaerosci.2006.11.004
- Marr , L.C. , Kirchstetter , T.W. , Harley , R.A. , Miguel , A.H. , Hering , S.V. and Hammond , S.K. 1999 . Characterization of Polycyclic Aromatic Hydrocarbons in Motor Vehicle Fuels and Exhaust Emissions . Environmental Science & Technology , 33 : 3091 – 3099 . doi: 10.1021/es981227l
- McDow , S.R. and Huntzicker , J.J. 1990 . Vapor Adsorption Artifact in the Sampling of Organic Aerosol—Face Velocity Effects . Atmospheric Environment , 24 : 2563 – 2571 . doi: 10.1016/0960-1686(90)90134-9
- Menon , S. , Hansen , J. , Nazarenko , L. and Luo , Y.F. 2002 . Climate Effects of Black Carbon Aerosols in China and India . Science , 297 : 2250 – 2253 . doi: 10.1126/science.1075159
- Noll , J. and Birch , M.E. 2008 . Effects of Sampling Artifacts on Occupational Samples of Diesel Particulate Matter . Environmental Science & Technology , 42 : 5223 – 5228 . doi: 10.1021/es702883k
- Park , K. , Cao , F. , Kittelson , D.B. and McMurry , P.H. 2003 . Relationship Between Particle Mass and Mobility for Diesel Exhaust Particles . Environmental Science & Technology , 37 : 577 – 583 . doi: 10.1021/es025960v
- Possanzini , M. , Febo , A. and Liberti , A. 1983 . New Design of a High-Performance Denuder for the Sampling of Atmospheric Pollutants . Atmospheric Environment , 17 : 2605 – 2610 . doi: 10.1016/0004-6981(83)90089-6
- Riddle , S.G. , Robert , M.A. , Jakober , C.A. , Hannigan , M.P. and Kleeman , M.J. 2008 . Size-Resolved Source Apportionment of Airborne Particle Mass in a Roadside Environment . Environmental Science & Technology , 42 : 6580 – 6586 . doi: 10.1021/es702827h
- Robinson , A.L. , Donahue , N.M. , Shrivastava , M.K. , Weitkamp , E.A. , Sage , A.M. , Grieshop , A.P. , Lane , T.E. , Pierce , J.R. and Pandis , S.P. 2007 . Rethinking Organic Aerosols: Semivolatile Emissions and Photochemical Aging . Science , 315 : 1259 – 1262 . doi: 10.1126/science.1133061
- Rowe , M.D. and Perlinger , J.A. 2010a . Performance of a High Flow Rate, Thermally Extractable Multicapillary Denuder for Atmospheric Semivolatile Organic Compound Concentration Measurement . Environmental Science & Technology , 44 : 2098 – 2104 . doi: 10.1021/es903002k
- Rowe , M.D. and Perlinger , J.A. 2010b . Prediction of Gas Collection Efficiency and Particle Collection Artifact for Atmospheric Semivolatile Organic Compounds in Multicapillary Denuders . Journal of Chromatography A , 1217 : 256 – 263 . doi: 10.1016/j.chroma.2009.11.049
- Schauer , J.J. , Kleeman , M.J. , Cass , G.R. and Simoneit , B.R.T. 1999 . Measurement of Emissions From Air Pollution Sources. 2. C-1 Through C-30 Organic Compounds from Medium Duty Diesel Trucks . Environmental Science & Technology , 33 : 1578 – 1587 . doi: 10.1021/es980081n
- Sharma , S. , Brook , J.R. , Cachier , H. , Chow , J. , Gaudenzi , A. and Lu , G. 2002 . Light Absorption and Thermal Measurements of Black Carbon in Different Regions of Canada . Journal of Geophysical Research , 107 ( D24 ) : 4771 doi: 10.1029/2002JD002496
- Strommen , M.R. and Kamens , R.M. 1999 . Simulation of Semivolatile Organic Compound Microtransport at Different Time Scales in Airborne Diesel Soot Particles . Environmental Science & Technology , 33 : 1738 – 1746 . doi: 10.1021/es981035q
- Subramanian , R. , Khlystov , A.Y. , Cabada , J.C. and Robinson , A.L. 2004 . Positive and Negative Artifacts in Particulate Organic Carbon Measurements With Denuded and Undenuded Sampler Configurations . Aerosol Science and Technology , 38 : 27 – 48 . doi: 10.1080/02786820390229354
- Subramanian , R. , Donahue , N.M. , Bernardo-Bricker , A. , Rogge , W.F. and Robinson , A.L. 2007 . Insights Into the Primary-Secondary and Regional-Local Contributions to Organic Aerosol and PM2.5 Mass in Pittsburgh, Pennsylvania . Atmospheric Environment , 41 : 7414 – 7433 . doi: 10.1016/j.atmosenv.2007.05.058
- Temime-Roussel , B. , Monod , A. , Massiani , C. and Wortham , H. 2004a . Evaluation of an Annular Denuder for Atmospheric PAH Partitioning Studies–2: Evaluation of Mass and Number Particle Losses . Atmospheric Environment , 38 : 1925 – 1932 . doi: 10.1016/j.atmosenv.2004.01.006
- Temime-Roussel , B. , Monod , A. , Massiani , C. and Wortham , H. 2004b . Evaluation of an Annular Denuder Tubes for Atmospheric PAH Partitioning Studies–1: Evaluation of the Trapping Efficiency of Gaseous PAHs . Atmospheric Environment , 38 : 1913 – 1924 . doi: 10.1016/j.atmosenv.2004.01.005
- Turpin , B.J. , Huntzicker , J.J. and Hering , S.V. 1994 . Investigation of Organic Aerosol Sampling Artifacts in the Los Angeles Basin . Atmospheric Environment , 28 : 3061 – 3071 . doi: 10.1016/1352-2310(94)00133-6
- Turpin , B.J. , Saxena , P. and Andrews , E. 2000 . Measuring and Simulating Particulate Organics in the Atmosphere: Problems and Prospects . Atmospheric Environment , 34 : 2983 – 3013 . doi: 10.1016/S1352-2310(99)00501-4
- Valavanidis , A. , Fiotakis , K. , Vlahogianni , T. , Bakeas , E.B. , Triantafillaki , S. , Paraskevopoulou , V. and Dassenakis , M. 2006 . Characterization of Atmospheric Particulates, Particle-Bound Transition Metals and Polycyclic Aromatic Hydrocarbons of Urban Air in the Centre of Athens (Greece) . Chemosphere , 65 : 760 – 768 . doi: 10.1016/j.chemosphere.2006.03.052
- Viana , M. , Chi , X. , Maenhaut , W. , Cafmeyer , J. , Querol , X. , Alastuey , A. , Mikuska , P. and Vecera , Z. 2006 . Influence of Sampling Artefacts on Measured PM, OC, and EC Levels in Carbonaceous Aerosols in an Urban Area . Aerosol Science and Technology , 40 : 107 – 117 . doi: 10.1080/02786820500484388
- Watson , J.G. , Chow , J.C. , Chen , L.W.A. and Frank , N.H. 2009 . Methods to Assess Carbonaceous Aerosol Sampling Artifacts for Improve and Other Long-Term Networks . J. the Air Waste Manage. Assoc. , 59 : 898 – 911 . doi: 10.3155/1047-3289.59.8.898
- Wichmann , H.E. and Peters , A. 2000 . Epidemiological Evidence of the Effects of Ultrafine Particle Exposure . Philosophical Transactions of the Royal Society of London Series A—Mathematical Physical and Engineering Sciences , 358 : 2751 – 2768 . doi: 10.1098/rsta.2000.0682
- Wilson , W.E. , Grover , B.D. , Long , R.W. , Eatough , N.L. and Eatough , D.J. 2006 . The Measurement of Fine-Particulate Semivolatile Material in Urban Aerosols . J. Air Waste Manage. Assoc. , 56 : 384 – 397 . doi: 10.1080/10473289.2006.10464527
- Zhang , J. , He , K.B. , Ge , Y.S. and Shi , X.Y. 2009 . Influence of Fuel Sulfur on the Characterization of PM10 from a Diesel Engine . Fuel , 88 : 504 – 510 . doi: 10.1016/j.fuel.2008.09.001
- Zhang , J. , He , K.B. , Shi , X.Y. and Zhao , Y. 2011 . Comparison of Particle Emissions from an Engine Operating on Biodiesel and Petroleum Diesel . Fuel , 90 : 2089 – 2097 . doi: 10.1016/j.fuel.2011.01.039
- Zielinska , B. , Sagebiel , J. , Arnott , W.P. , Rogers , C.F. , Kelly , K.E. , Wagner , D.A. , Lighty , J.S. , Sarofim , A.F. and Palmer , G. 2004 . Phase and Size Distribution of Polycyclic Aromatic Hydrocarbons in Diesel and Gasoline Vehicle Emissions . Environmental Science & Technology , 38 : 2557 – 2567 . doi: 10.1021/es030518d
- Zielinska , B. 2005 . Atmospheric Transformation of Diesel Emissions . Experimental and Toxicologic Pathology , 57 : 31 – 42 . doi: 10.1016/j.etp.2005.05.006