Abstract
Improving air quality in Santiago has been a high priority for the Chilean government. In this paper, we examine trends of fine particulate matter (PM2.5) mass and species concentrations during the period 1998 to 2010 and explore the impact of fuel-related interventions and fuel sales on concentration changes. Smoothing spline functions were utilized to characterize and account for nonlinear relationships between pollutant concentrations and different parameters. Meteorology-adjusted PM2.5 concentrations were lower by 21.8 µg/m3 in 2010 compared to 1998. In this model, wind speed was the most important determinant of PM2.5 levels. A decrease in 24-hr average wind speed below 1.0 m/s was associated with a significant increase in daily PM2.5 levels, indicating a high sensitivity of PM2.5 concentrations to the accumulation of local emissions. The same regression model framework was applied to examine the trends of lead, bromine, and sulfur concentrations. Removal of lead and bromine from gasoline achieved dramatic decreases in their atmospheric concentrations. Nonetheless, both elements continue to persist, likely in the form of PbBrCl. The reduction of diesel sulfur content from 1,500 to 50 ppm corresponded to a 32% decrease in particulate sulfur levels. Lastly, a surge in PM2.5 was observed in 2005–2008. Further regression analyses suggested this was prompted by a rise in monthly petroleum-based fuel sales.
In this paper, we elucidate meteorology-adjusted trends of PM2.5 mass and species concentrations in Santiago and assess the efficacy of fuel-related interventions, such as the removal of lead from gasoline and reduction of sulfur content in diesel. In addition, we explore the impact of fuel sales on PM2.5 trends. Given that fuel consumption is likely to increase further in this rapidly growing city, understanding its impact on PM2.5 trends can inform future air quality control efforts in Santiago.
Supplemental Materials: Supplemental materials are available for this paper. Go to the publisher's online edition of the Journal of the Air & Waste Management Association.
Introduction
Santiago, the capital of Chile, is one of the most urbanized and industrialized cities in South America. The city resides in a closed basin surrounded by two large mountain ranges, the Andes to the east and the Chilean Coastal Range to the west. This geography favors formation of thermal inversions, which are particularly frequent in the cold season. In addition to the topography and meteorology, Santiago is densely populated (6.9 million) and has a large vehicle fleet (1 million). Furthermore, Santiago and its surrounding area play host to many mineral and agricultural industries (70% of the county's total) (CitationRomero et al., 1999). These emission sources have significantly contributed to air pollution in Santiago. For instance, high levels of nitrogen oxides, carbon monoxide, ozone, and fine particulate matter (particles of an aerodynamic diameter ≤ 2.5 μm; PM2.5) have been measured (CitationArtaxo et al., 1999; CitationJorquera, 2002; CitationRappengluck et al., 2000).
Previous work has shown that in Santiago, indoor levels of particles are similar to outdoor levels (CitationGil et al., 1997; CitationRojas-Bracho et al., 2002). This finding has been attributed to efficient home ventilation, with outdoor sample measurements reflecting both indoor and outdoor particle exposure. Epidemiological studies using these outdoor measurements have found significant associations between high particle concentrations and daily mortality, as well as respiratory illnesses (CitationCakmak et al., 2007; CitationPino et al., 2004). With 40% of the Chilean population residing in this rapidly growing city, improving air quality in Santiago has been a high priority for the Chilean government.
A number of interventions implemented since the early 1990s aimed to reduce air pollution in the Santiago Metropolitan area. Many measures targeted traffic emissions, a significant source of PM2.5 (CitationKavouras et al., 2001). Example interventions include rolling bans on car usage, mandatory vehicle inspections, redesigning the public transportation system, and gradual replacement of the older bus fleet with cleaner diesel fuel buses. In addition, over a span of 20 years, allowable diesel sulfur content has been steadily reduced from 5,000 to 50 ppm, and lead was entirely removed from gasoline in 2001.
A PM2.5 monitoring network in Santiago has been in operation since the mid-1980s, rendering it one of the longest running PM2.5 monitoring networks in the world. This network is supported by the Chilean Ministry for the Environment to facilitate investigation of spatial and temporal profiles of air pollution throughout the metropolitan area. In this study, data from this network were obtained for trend analysis. Prior studies have reported significant decreases in PM2.5 from 1989 to 2001 using data from this network (CitationKoutrakis et al., 2005; CitationJorquera et al., 2000). These analyses controlled for factors other than emission sources that can influence PM2.5 trends, such as month, day of the week, and meteorological parameters (CitationKoutrakis et al., 2005; CitationSax et al., 2007). Our study builds upon prior models, and attempts to more precisely account for nonlinear relationships through smoothing spline functions. We analyzed the most recent 12 years of PM2.5 mass and species concentration time series—from April 1998 to August 2010—to (1) determine their meteorology-adjusted trends, (2) identify significant determinants of trends, and (3) evaluate the impact of fuel-related interventions and fuel sales.
Materials and Methods
Data collection
The PM2.5 monitoring site is located in O'Higgins Park, the second largest public park in the Santiago Metropolitan area. Within close proximity are a major highway (the Panamericana), an amusement park, and the University of Chile campus. In addition, several mechanical and metalworking shops sell the wares nearby.
Twenty-four-hour PM2.5 samples were collected from midnight to midnight from June 1988 to August 2010. Sampling frequency was predetermined by the Chilean Ministry for the Environment to be higher in the cold season, when pollution episodes are more frequent. Filter samples were collected daily during the cold season (April through September) and every other day during the warm season (October through March) with dichotomous samplers (Andersen; Anderson Instruments, Inc., Smyrna, GA). In addition, daily (24-hr average) values of meteorological parameters such as wind speed, temperature, and relative humidity were obtained from a weather station that is maintained by the Chilean Ministry for the Environment at O'Higgins Park from January 1998 through December 2010. The starting speed for the wind speed sensor (model 010C; Met One Instruments, Inc., Grants Pass, OR) is 0.22 m/s. Data validation employed by the Chilean Ministry for the Environment requires at least 75% of measurements to be valid to compute a valid 24-hr average.
For PM2.5 samples collected in the last 12 years (April 1998 to August 2010), elemental analysis was conducted on Teflon filter samples from every fourth day (1,059 samples total) using x-ray fluorescence (XRF; Desert Research Institute). Details on sampling, filter weighing, and elemental analysis are reported in previous studies (CitationKoutrakis et al., 2005; CitationSax et al., 2007). For each XRF measurement, the limit of detection (LOD) was set at twice the measurement uncertainty. Elements with at least 95% of measurements above the LOD were S, K, Fe, Br, and Pb. Other elements with lower certainty in measurements, but nonetheless important tracer elements to examine, were Cr (78%), and Ni (53%).
Information on the reduction of diesel sulfur content was documented in the Plan for the Prevention and Control of Air Pollution in Santiago, which is a long-range plan instituted in 1998 to reduce emissions from the industrial and transportation sectors (CitationNational Environmental Commission of Chile, 1999). Monthly sales data on petroleum-based fuels (PBFs), natural gas, and liquefied petroleum gas (LPG) from 1998 to 2010 were obtained (CitationSuperintendent of Energy and Fuel, 2012).
Regression analyses
Twelve full years of daily PM2.5 and meteorological data from April 1, 1998, to March 31, 2010, were included in the regression analysis. The relationships between PM2.5 and covariates, including year, month, weekday, wind speed (ws), temperature (temp), and relative humidity (rh), were evaluated using the statistical package R (version 2.13.1) (CitationR Development Core Team, 2011) with the following generalized additive model:
To analyze the impact of diesel sulfur reduction on ambient sulfur concentrations, the average ambient concentrations were calculated for each period corresponding to different maximum allowable diesel sulfur content. In addition, the following model was constructed to verify the relationship between ambient sulfur and diesel sulfur content after controlling for other covariates:
The impact of PBF sales on PM2.5 trends was assessed by analyzing PM2.5 trends adjusted for PBF sales with the following equation:
Like meteorological variables, PBF sales were treated as a continuous, nonlinear variable. The association between PBF sales and PM2.5 levels was obtained from Equationeq 3.
Results and Discussion
PM2.5 concentration levels
The Chilean Ministry for the Environment achieved significant reductions in PM2.5 in Santiago over the past two decades (). In just nine years, between 1989 and 1997, annual PM2.5 levels decreased dramatically by 32 μg/m3 (from 76 to 44 μg/m3). This trend tapered off in the later 12 years, between 1998 and 2009, when concentrations decreased by 13 μg/m3 (from 43 to 30 μg/m3). The latest annual concentrations, however, exceeded Chile's new annual PM2.5 standard of 20 μg/m3 by approximately 50%.
Figure 1. PM2.5 monthly and annual concentration time series. The dashed line at 20 μg/m3 represents the new Chilean Ministry for the Environment's annual PM2.5 standard.
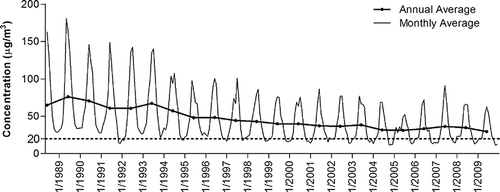
As mentioned previously, Santiago is located in a basin surrounded by two large mountain ranges, which results in frequent thermal inversions, particularly in the cold season. This leads to severe winter air pollution episodes, and consequently a marked seasonal variability in PM2.5 concentrations. As expected, PM2.5 concentrations were highest in June, which is a winter month in the Southern Hemisphere, and lowest in January, which is a summer month.
PM2.5 regression model
Our regression model was built upon that of prior trend analysis studies of Santiago (CitationKoutrakis et al., 2005; CitationSax et al., 2007). Similar to these previous models, we adjusted for month, weekday, temperature, wind speed, and relative humidity to examine PM2.5 trends that have accounted for weather variation. However, there were two key differences. First, we improved the characterization of nonlinear relationships between PM2.5 and meteorological parameters by employing penalized smoothing spline functions. A recent trend analysis study conducted in Europe also utilized smoothing spline functions to estimate meteorology-adjusted PM2.5 concentrations and to assess nonlinear relationships between PM2.5 and meteorological variables (CitationBarmpadimos et al., 2012). Second, we constructed an additive rather than a multiplicative model in the interest of interpretability of the nonlinear relationships derived from the smoothing functions. Despite differences in modeling assumptions, the meteorology-adjusted PM2.5 trends and the relationships between PM2.5 and the covariates were similar between the additive and multiplicative models (see Supplemental Information).
The meteorology-adjusted PM2.5 concentrations were lower by 21.8 μg/m3 in 2009/2010 compared to 1998/1999 (). While there was an overall steady decline in PM2.5 levels in 1998 to 2010, there was a surge in annual concentrations between 2005 and 2008; during this period, annual adjusted PM2.5 concentrations peaked in 2007, representing a total increase of 7.9 μg/m3 in two consecutive years. The meteorology-adjusted trends obtained from the multiplicative model also exhibited an increase in PM2.5 during these years, which suggests that the trends were robust to the model selection (see Supplemental Information). Since these trends were adjusted for meteorological parameters, the sudden increase was not caused by variation in wind speed, temperature, or relative humidity. This phenomenon is explored in greater detail later in the paper.
Figure 2. PM2.5 model results. (a) Annual trend of PM2.5 adjusted for month, day of the week, wind speed, relative humidity, and temperature. (b–d) Nonlinear relationships between PM2.5 and wind speed, relative humidity, and temperature, respectively. (e) Monthly variability of PM2.5 with respect to January. (f) Day-of-the-week variability of PM2.5 with respect to Sunday.
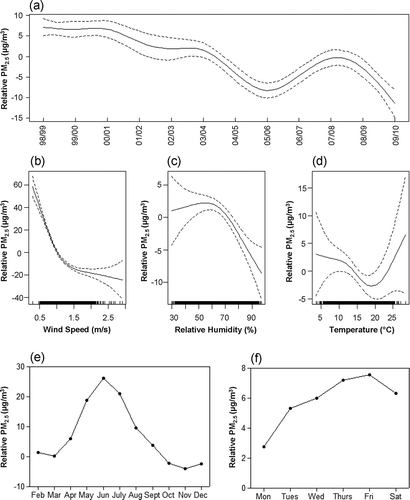
While the primary purpose of adjusting for meteorological variables was to elucidate trends that reflect anthropogenic influences rather than annual weather variation, the general relationships between PM2.5 and meteorological variables can still be examined. Among the meteorological variables, wind speed was the most important determinant of PM2.5 concentrations, which was consistent with findings of previous trend analyses conducted in Santiago (CitationKoutrakis et al., 2005). A decrease in 24-hr average wind speed below 1.0 m/s corresponded to a significant linear increase in PM2.5 (). A stagnant environment with low wind speed is favorable for local pollutant accumulation, while a more turbulent atmosphere can dilute pollutants and transport them away from the city. Therefore, the strong inverse relationship revealed the significance of local emissions, which accumulate readily during days with low wind speed, resulting in an increase of PM2.5 levels.
The effects of temperature and relative humidity on PM2.5 were weaker than that of wind speed. An increase in relative humidity above 60% was associated with a decrease in PM2.5 (). This was expected, since days with high relative humidity are often associated with precipitation, and water droplets can remove particulates in the atmosphere through wet deposition. While temperature explained some additional variation in PM2.5 levels, it exhibited the weakest association with PM2.5 due to collinearity with other variables in the model ().
Even after controlling for wind speed, relative humidity, and temperature, considerable seasonal variation in concentrations still remained. PM2.5 levels in June were higher by 28.1 μg/m3relative to January (). Other meteorological parameters such as vertical mixing height and synoptic air mass movements may exhibit strong seasonal patterns. As they were not controlled for in this model, a significant portion of the month effect estimates may result from other meteorological manifestations with pronounced seasonality. Additional analyses showed that when the meteorological variables were removed from the model, the overall PM2.5 trend remained the same (see Supplemental Information). The trends, therefore, were robust to meteorological influences, suggesting that weather variation was not the cause of the sudden PM2.5 increase in the mid to late 2000s.
The monthly variability in PM2.5 levels was greater than the day of week variability, which is in agreement with an analysis from an earlier 12-year period (1989–2001; CitationKoutrakis et al., 2005). Weekdays had higher PM2.5 levels compared to weekends, as traffic emissions are higher during the week (). However, levels on Mondays were lower than the rest of the week, suggesting that particles accumulate over the course of several days.
Impact of lead ban from gasoline
Regulating lead in gasoline has historically achieved dramatic decreases in ambient lead levels in Europe and the United States (CitationU.S. Environmental Protection Agency, 2006; CitationSmith and Flegal, 1995; CitationMigon et al., 2008; Citationvon Storch et al., 2003). In 2001, the Chilean government mandated the removal of lead from gasoline. The trend of lead was analyzed by using the same form of the PM2.5 regression model ( Equationeq 1) (). The trend of bromine was also analyzed, as bromine was added to gasoline along with lead (). As leaded gasoline was phased out, there was a commensurate, dramatic decrease in both lead (0.366 μg/m3 to 0.026 μg/m3) and bromine (0.110 μg/m3 to 0.008 μg/m3) between 1998 and 2010. In addition, the correlation between lead and bromine levels for each year was very high, ranging from 0.67 to 0.95. A strong correlation indicates that the two elements shared a common source. Therefore, the dramatic decrease in these two highly correlated elements suggested that leaded gasoline was their major emission source.
Figure 3. Molar ratios, Pearson correlation coefficients, and trends adjusted for month, weekday, temperature, wind speed, and relative humidity for (a) lead and (b) bromine.
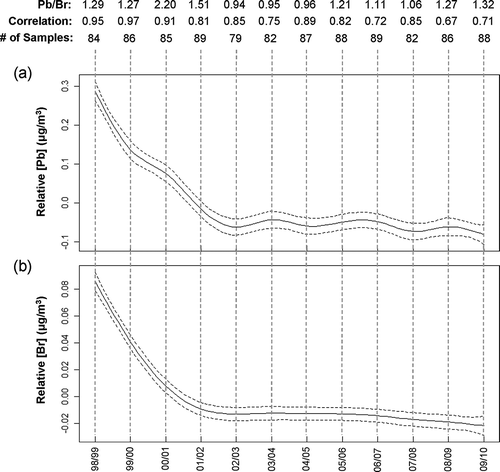
Many studies have used the Pb/Br ratio to determine motor vehicle contributions to ambient lead levels (CitationHarrison and Sturges, 1983). Depending on the fuel additive, the majority of lead-containing particulates emitted are either PbBr2 or PbBrCl. A Pb/Br molar ratio of 1:2 would correspond to PbBr2 while a molar ratio of 1:1 would correspond to PbBrCl. With an exception of one year, the Pb/Br molar ratio in Santiago ranged from 0.94 to 1.51 and remained fairly constant during the study period. Thus, PbBrCl was the most plausible particulate form.
The overall decrease in the correlations between lead and bromine concentrations indicated that gasoline became a less prominent source of lead particulates. However, both lead and bromine were still present in the environment, long after their removal from gasoline, likely incorporated in the soil and road dust. Previous studies have identified resuspension of lead-contaminated soil as a major source of ambient lead in the U.S. and European countries, which is evidence of its chemical persistence (CitationYoung et al., 2002; CitationLaidlaw et al., 2012; Citationde Miguel et al., 1997). In the United States, lead-contaminated soil is the major source of lead exposure for children (CitationCenters for Disease Control and Prevention, 2005; CitationWeitzman et al., 1993). Therefore, despite the dramatic decrease in ambient levels of lead in Santiago, lead exposure will likely continue to persist in the near term.
Reduction of diesel sulfur content
Sulfur content in diesel was reduced from 5,000 to 50 ppm from 1989 to 2010 (). The relationship between ambient and diesel sulfur was remarkably linear, and revealed that the reduction of sulfur from 1,500 ppm to 50 ppm was associated with a decrease in ambient sulfur from 1.59 to 1.08 μg/m3, or by 32% (). This was verified using a model that controlled for month, day of the week, and meteorology ( Equationeq 2), where ambient sulfur was the outcome and diesel sulfur was the predictor of interest (). However, this association showed that even if sulfur were completely removed from diesel—the primary local source of sulfur— sulfur levels would still be 1.07 μg/m3 due to regional source contributions.
Figure 4. Impact of diesel sulfur content reduction on ambient sulfur levels. (a) Maximum allowable sulfur content in diesel for 1989–2010. (b) Average ambient sulfur versus diesel sulfur content. (c) Graph of the meteorology-adjusted relationship between 1998 and 2010. (d) Meteorology-adjusted ambient sulfur concentration trends.
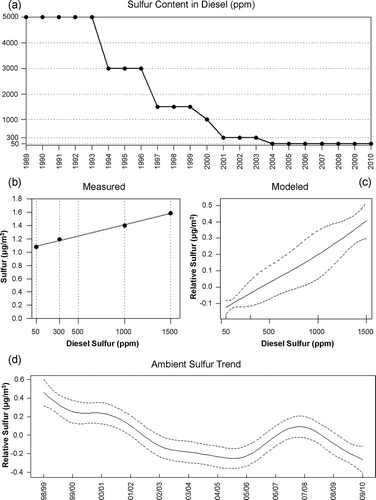
Although regional transport of sulfates is important, there was evidence of increasing local emissions starting 2005. For instance, the meteorology-adjusted sulfur trend exhibited a surge similar to that of PM2.5 in 2005–2008 (). In fact, other PM2.5 elemental species that followed this pattern included K, Cr, Fe, and Ni. These elements are tracers of biomass burning (K), traffic (Cr, Fe), and oil combustion (Ni).
By inspecting the data on temperature and vehicle fleet size, we developed several hypotheses regarding the surge in PM2.5 mass and several species. From 2001 to 2010, the total number of vehicles in Santiago increased by 5.5% annually, which is equivalent to approximately 55,000 vehicles per year (CitationNational Institute of Statistics, 2011). Therefore, it can be expected that traffic-related tracer elements such as Cr and Fe would increase. In addition, the cold-season temperatures in 2007 were unusually low (see Supplemental Information). Colder weather often leads to greater heating activities, such as biomass burning. In turn, the particulates generated by these activities as well as other pollutants can accumulate more readily as inversions are more frequent and pronounced during colder winters. Thus, the unusually cold winter in 2007 can provide a plausible explanation for the peaks observed that year for PM2.5 and many of its species.
Perhaps the most important factor affecting sulfur and oil combustion emissions was the decreased natural gas imports from Argentina starting in 2004. In response to limited quantities of natural gas, many industries transitioned to other fuels, particularly diesel. The lower availability of natural gas in 2004 was consistent with the observed increase in ambient sulfur as well as other elements associated with oil combustion in consequent years. Thus, the combination of decreased natural gas availability, expanding vehicle fleet, and a particularly cold winter in 2007 set the stage for the increasing trend in PM2.5 and its species, and ultimately their peak levels in 2007.
Impact of fuel sales on trends
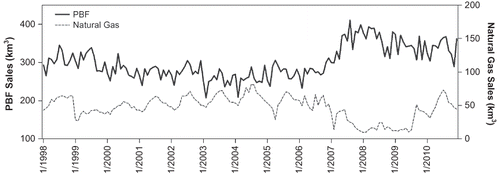
To confirm that decreasing natural gas sales indeed drove the increase in fuel combustion elements, we gathered and analyzed monthly sales data on PBFs (e.g., gasoline, kerosene, petroleum), natural gas, and LPG for 1998–2010. The time-series plot revealed a steady increase in natural gas consumption until 2004, and a decrease thereafter due to the limitation on the quantity of imported natural gas (). Meanwhile, these changes in natural gas consumption patterns were accompanied by opposite trends in PBF sales. This was evidence that the two fuels can be used interchangeably by a majority of their consumers. Consequently, the decrease in natural gas availability starting in 2004 led to a notable increase in PBF sales in 2004–2008.
Figure 5. Monthly PBF and natural gas sales data from 1998 to 2010.
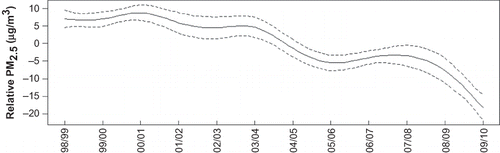
To explore the impact of PBF sales on PM2.5 trends, we estimated PM2.5 trends that were adjusted for PBF sales ( Equationeq 3). After adjusting for PBF sales, the increase in PM2.5 we previously observed in 2005–2008 was mitigated (). In other words, if PBF sales had not risen during this period, PM2.5 would not have increased as much. The PM2.5 trends adjusted for PBF sales were consistent with those obtained from a model that characterized PBF sales and other covariates to have multiplicative rather than additive effects on PM2.5 concentrations (see Supplemental Information). The robustness of the results provided further evidence that PBF sales indeed influenced PM2.5 trends. Therefore, increases in PM2.5 and several of its elemental species between 2005 and 2008 were likely prompted by PBF sale increases. Furthermore, PM2.5 concentrations would have decreased by 25.1 μg/m3 rather than 21.8 μg/m3 between 1998 and 2010 if PBF sales had remained constant.
Figure 6. PM2.5 trends adjusted for monthly PBF sales in 1998–2010.
To our knowledge, the relationship between PBF and ambient PM2.5 has rarely been directly elucidated from ambient data, although many tunnel and chamber studies have demonstrated such relationships (CitationSchauer et al., 1999; CitationRogge et al., 1993; CitationHildemann et al., 1991; CitationCadle et al., 2001). The regression model results also showed that higher PM2.5 levels were associated with greater PBF consumption (). In fact, an increase in PBF consumption from 300 to 350 km3 was associated with an increase in PM2.5 by 6.3 μg/m3. However, this association weakened at the highest PBF consumption levels.
Figure 7. Relationship between relative PM2.5 concentrations and PBF sales.
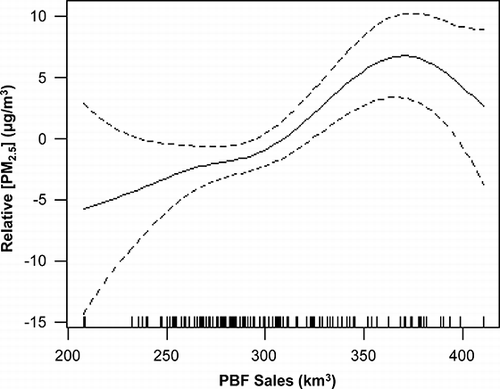
There are two possible explanations for this phenomenon. First, there were fewer data at high PBF consumption levels, which led to wider confidence bands around the predicted values of relative PM2.5 concentrations. Second, the relationship leveled off at high PBF consumption values, which occurred in the most recent years when there were cleaner fuels available and newer cars that boast cleaner emission profiles. This is consistent with findings from a factor analysis study, which showed that motor vehicles were becoming a less prominent source of PM2.5 due to an improved vehicle fleet (CitationMoreno et al., 2010). Therefore, it is plausible that each unit of PBF consumption was associated with lower PM2.5 emissions in more recent years, leading to the weaker relationship at higher consumption levels.
The strong association between PBF and PM2.5 further confirmed that motor vehicle and oil combustion sources remain important emitters of PM2.5. While efforts to introduce a cleaner vehicle fleet and retire the old appear to have somewhat mitigated the impact of mobile sources, regulating diesel sulfur and removing gasoline lead have had more meaningful impacts.
Conclusion
Air quality in Santiago has improved substantially over the past two decades; however, recent annual PM2.5 levels exceeded the new Chilean Ministry for the Environment's annual standard and PM2.5 concentrations in the cold season were particularly of concern. Our analyses of both PM2.5 and its chemical species have shown that there were multiple factors—some controllable and others unavoidable—that affected PM2.5 levels in 1998 to 2010 through a diverse array of mechanisms. The regulations currently in place were not immune to meteorological, economic, and geopolitical stressors during recent years. The PM2.5 trends in the mid-2000s were a prime example of how these factors trumped and reversed the commendable progress that has been made. We identified PBF sales as an important nonmeteorological variable that affected PM2.5 trends. Higher PBF consumption, expanding vehicle fleet, and an unusually cold winter culminated in 2007 in a pronounced maximum in PM2.5 and many tracer species concentrations. Continued efforts to target and evaluate the impact of these stressors are necessary to protect the well-being of the ever-growing population in Santiago, Chile.
Supplemental Material
Download PDF (100.7 KB)Acknowledgment
This publication was made possible by the Chilean Ministry for the Environment (ID 1287-21-LE10), the Harvard School of Public Health Scholarship, and the U.S. Environmental Protection Agency (EPA) grant RD83479801. Its contents are solely the responsibility of the grantee and do not necessarily represent the official views of the U.S. EPA. Further, the U.S. EPA does not endorse the purchase of any commercial products or services mentioned in the publication. We thank Roberto Martinez from Chile's Ministry for the Environment for authorization to use air quality data from the Santiago Air Quality Network. At the Harvard School of Public Health, we especially thank Robert Herrick and Jaime Hart for their comments and review of drafts.
References
- Artaxo , P. , Oyola , P. and Martinez , R. 1999 . Aerosol Composition and Source Apportionment in Santiago de Chile . Nuclear Instrum. Methods B , 150 : 409 – 416 . doi: 10.1016/S0168-583X(98)01078-7
- Barmpadimos , I. , Keller , J. , Oderbolz , D. , Hueglin , C. and Prevot , A.S. 2012 . One Decade of Parallel Fine (PM2.5) and Coarse (PM10-PM2.5) Particulate Matter Measurements in Europe: Trends and Variability . Atmos. Chem. Phys. , 12 : 3189 – 3203 . doi: 10.5194/acp-12-3189-2012
- Cadle , S.H. , Mulawa , P. , Groblicki , P. , Laroo , C. , Ragazzi , R.A. , Nelson , K. , Gallagher , G. and Zielinska , B. 2001 . In-Use Light-Duty Gasoline Vehicle Particulate Matter Emissions on Three Driving Cycles . Environ. Sci. Technol. , 35 : 26 – 32 . doi: 10.1021/es0010554
- Cakmak , S. , Dales , R.E. and Vidal , C.B. 2007 . Air Pollution and Mortality in Chile: Susceptibility Among the Elderly . Environ. Health Perspect. , 115 : 524 – 527 . doi: 10.1289/ehp.9567
- Centers for Disease Control and Prevention . 2005 . Preventing Lead Poisoning in Young Children , Atlanta , GA : CDC .
- Gil , L. , áceres , D. C and Adonis , M. 1997 . Influence of Atmospheric Air Pollution on Indoor Air Quality: Comparison of Chemical Pollutants and Mutagenicity Levels in Santiago (Chile) . Indoor Built Environ. , 6 : 320 – 330 . doi: 10.1177/1420326X9700600602
- Harrison , R.M. and Sturges , W.T . 1983 . The Measurement and Interpretation of Br/Pb Ratios in Airborne Particles . Atmos. Environ. , 17 : 311 – 328 . doi: 10.1016/0004-6981(83)90048-3
- Hildemann , L.M. , Markowski , G.R. and Cass , G.R. 1991 . Chemical Composition of Emissions From Urban Sources of Fine Organic Aerosol . Environ. Sci. Technol. , 25 : 744 – 759 . doi: 10.1021/es00016a021
- Jorquera , H. 2002 . Air Quality at Santiago, Chile: A Box Modeling Approach—I. Carbon Monoxide, Nitrogen Oxides and Sulfur Dioxide . Atmos. Environ. , 36 : 315 – 330 . doi: 10.1016/S1352-2310(01)00417-4
- Jorquera , H. , Palma , W. and Tapia , J. 2000 . An Intervention Analysis of Air Quality Data at Santiago, Chile . Atmos. Environ. , 34 : 4073 – 4084 . doi: 10.1016/S1352-2310(00)00161-8
- Kavouras , I.G. , Koutrakis , P. , Cereceda-Balic , F. and Oyola , P. 2001 . Source Apportionment of PM10 and PM2.5 . J. Air Waste Manage. Assoc. , 51 : 451 – 464 . doi: 10.1080/10473289.2001.10464273
- Koutrakis , P. , Sax , S.N. , Sarnat , J.A. , Coull , B. , Demokritou , P. , Oyola , P. , Garcia , J. and Gramsch , E. 2005 . Analysis of PM10, PM2.5, and PM2.5-10 Concentrations in Santiago, Chile, From 1989 to 2001 . J. Air Waste Manage. Assoc. , 55 : 342 – 351 . doi: 10.1080/10473289.2005.10464627
- Laidlaw , M.A. , Zahran , S. , Mielke , H.W. , Taylor , M.P. and Filippelli , G.M. 2012 . Re-Suspension of lead Contaminated Urban Soil as a Dominant Source of Atmospheric Lead in Birmingham, Chicago, Detroit and Pittsburgh, USA . Atmos. Environ. , 49 : 302 – 310 . doi: 10.1016/j.atmosenv.2011.11.030
- Migon , C. , Robin , T. , Dufour , A. and Gentili , B. 2008 . Decrease of Lead Concentrations in the Western Mediterranean Atmosphere During the Last 20 Years . Atmos. Environ. , 42 : 815 – 821 . doi: 10.1016/j.atmosenv.2007.10.078
- de Miguel , E. , Llamas , J.F. , Chacón , E. , Berg , T. , Larssen , S. , øyset , O. R and Vadset , M. 1997 . Origin and Patterns of Distribution of Trace Elements in Street Dust: Unleaded Petrol and Urban Lead . Atmos. Environ. , 31 : 2733 – 2740 . doi: 10.1016/S1352-2310(97)00101-5
- Moreno , F. , Gramsch , E. , Oyola , P. and Rubio , M.A. 2010 . Modification in the Soil and Traffic-Related Sources of Particle Matter Between 1998 and 2007 in Santiago de Chile . J. Air Waste Manage. Assoc. , 60 : 1410 – 1421 . doi: 10.3155/1047-3289.60.12.1410
- National Environmental Commission of Chile . 1999 . Plan for the Prevention and Control of Air Pollution in Santiago , Santiago : Chile .
- National Institute of Statistics. 2011. Vehicle Fleet in Circulation http://www.ine.cl/canales/chile_estadistico/estadisticas_economicas/edificacion/301209/xlsh/11219.xls (http://www.ine.cl/canales/chile_estadistico/estadisticas_economicas/edificacion/301209/xlsh/11219.xls) (Accessed: 15 January 2011 ).
- Pino , P. , Walter , T. , Oyarzun , M. , Villegas , R. and Romieu , I. 2004 . Fine Particulate Matter and Wheezing in the First Year of Life . Epidemiology , 15 : 702 – 708 . doi: 10.1097/01.ede.0000142153.28496.d0
- R Development Core Team. 2011. R: A Language and Environment for Statistical Computing http://www.r-project.org (http://www.r-project.org) (Accessed: 2 September 2011 ).
- Rappengluck , B. , Oyola , P. , Olaeta , I. and Fabian , P. 2000 . The Evolution of Photochemical Smog in the Metropolitan Area of Santiago de Chile . Amer. Meteor. Soc. , 39 : 275 – 290 . doi: 10.1175/1520-0450(2000)0392.0.CO;2
- Rogge , W.F. , Rogge , Hildemann , L.M. , Mazurek , M.A. and Cass , G.R. 1993 . Sources of Fine Organic Aerosol. 2. Noncatalyst and Catalyst-Equipped Automobiles and heavy-Duty Diesel Trucks . Environ. Sci. Technol. , 27 : 636 – 651 . doi: 10.1021/es00041a007
- Rojas-Bracho , L. , Suh , H.H. , Oyola , P. and Koutrakis , P. 2002 . Measurements of Children's Exposures to Particles and Nitrogen Dioxide in Santiago, Chile . Sci. Total Environ. , 287 : 249 – 264 .
- Romero , H. , Ihl , M. , Rivera , A. , Zalazar , P. and Azocar , P. 1999 . Rapid Urban Growth, Land-Use Changes and Air Pollution in Santiago, Chile . Atmos. Environ. , 33 : 4039 – 4047 . doi: 10.1016/S0048-9697(01)00987-1
- Sax , S.N. , Koutrakis , P. , Rudolph , P.A. , Cereceda-Balic , F. , Gramsch , E. and Oyola , P. 2007 . Trends in the Elemental Composition of Fine Particulate Matter in Santiago, Chile, From 1998 to 2003 . J. Air Waste Manage. Assoc. , 57 : 845 – 855 . doi: 10.3155/1047-3289.57.7.845
- Schauer , J. , Kleeman , M.J. , Cass , G.R. and Simoneit , B.R. 1999 . Measurement of Emissions From Air Pollution Sources. 2. C1 Through C30 Organic Compounds From Medium Duty Diesel Trucks . Environ. Sci. Technol. , 33 : 1578 – 1587 . doi: 10.1021/es980081n
- Smith , D. and Flegal , A.R. 1995 . Lead in the Biosphere: Recent Trends . Ambio. , 24 : 21 – 23 .
- von Storch , H. , Costa-Cabral , M. , Hagner , C. , Feser , F. , Pacyna , J. , Pacyna , E. and Kolb , S. 2003 . Four Decades of Gasoline Lead Emissions and Control Policies In Europe: A Retrospective Assessment . Sci. Total Environ. , 311 : 151 – 176 . doi: 10.1016/S0048-9697(03)00051-2
- Superintendent of Energy and Fuel . 2012 . Communication via e-mail, June 5
- U.S. 2006 . Air Quality Criteria for Lead, Vol. I of II , Research Triangle Park , NC : U.S. EPA . Environmental Protection Agency
- Weitzman , M. , Aschengrau , A. , Bellinger , D. , Jones , R. , Hamlin , J.S. and Beiser , A. 1993 . Lead-Contaminated Soil Abatement and Urban Children's Blood Lead Levels . J. Am. Med. Assoc. , 269 : 1647 – 1654 . doi: 10.1001/jama.269.13.1647
- Young , T.M. , Heeraman , D.A. , Sirin , G. , Gorkem , A. and Ashbaugh , L.L. 2002 . Resuspension of Soil as a Source of Airborne Lead Near Industrial Facilities and Highways . Environ. Sci. Technol. , 36 : 2484 – 2490 . doi: 10.1021/es015609u