Abstract
As part of an ongoing study of soil vapor intrusion (SVI), concentration data for approximately 2000 air and vapor samples were assembled from remedial site investigations and stand-alone assessments conducted at New York State Manufactured Gas Plant (MGP) sites. Vapor samples were collected from ambient outdoor air, indoor air, beneath building slabs, and from outside of buildings. Despite the large sample size, the considerable variability in compound and sample-specific censoring limits inhibited the use of conventional tools for statistical interpretation. This paper describes the development and application of improved statistical tools to address an unusually high degree of data censoring and possible artifacts related to uneven distributions of samples across sites and buildings. In addition to methods for calculating population percentiles and associated confidence intervals, methods for comparing the population of MGP-SVI data with a reference population were also developed and evaluated via illustrative comparisons with the published 2001 EPA Building Assessment Survey and Evaluation (BASE) study of industrial buildings. The focus of this work is on the development and evaluation of new statistical methods; a more complete summary and evaluation of the full NYS MGP-SVI data set will be presented in a companion paper.
Data from vapor intrusion and other environmental studies are often stratified and/or censored, which complicates comparisons with background data or reference populations. In some cases, statistical methods for censored data can be modified to support population-based inference and reduce biases associated with the presence of repeated measurements from multiple sources. Such modifications are particularly appropriate for retrospective data mining studies that are not guided by a formal experimental design.
Supplemental Materials: Supplemental materials are available for this paper. Go to the publisher's online edition of the Journal of the Air & Waste Management Association.
Introduction
Soil vapor influenced by contaminated groundwater, soil, or other subsurface sources can potentially migrate into the indoor air of adjacent buildings, resulting in human exposure that is commonly referred to as the soil vapor intrusion (SVI) pathway. Considerable ongoing research seeks to understand better the SVI pathway and to develop appropriate decision criteria to aid in site management (CitationJohnson et al., 2009; CitationU.S. EPA, 2012). Policymakers face many challenges in establishing such criteria due to the complex nature of the underlying physical, chemical, and biological processes. In 2006, New York State (NYS) issued guidance related to the SVI pathway (New York State Department of Health [CitationNYSDOH], 2006; New York State Department of Environmental Conservation [CitationNYSDEC], 2006). While soil vapor intrusion investigations had been completed at sites in New York State prior to the issuance of this guidance, the updated approach has resulted in more comprehensive and consistent sampling of soil vapor (exterior to buildings), subslab vapor (beneath buildings), crawlspace air and indoor air at sites with volatile organic compound (VOC) contamination. A unique type of site includes former manufactured gas plants (MGPs), which produced gas from coal and petroleum feedstock during the late 1800s through the mid 1950s. Although most of the NYS MGP sites have been nonoperational since the 1950s, many are the subject of ongoing site investigations. The focus of this article is on the development of statistical tools to interpret and draw insight from SVI data collected from former MGP sites in NYS.
One approach to understanding the complex nature of soil vapor intrusion has been through empirical studies of historical SVI investigations performed at multiple locations, as reflected in the U.S. Environmental Protection Agency (EPA) vapor intrusion database (CitationU.S. EPA, 2012). Such studies utilize a data-mining approach to assemble SVI sample information from previously completed studies, typically site-specific field investigations conducted for regulatory compliance purposes. A compilation of background concentrations of VOC compounds using a similar approach is provided in a recent review by CitationDawson et al. (2009). While studies of this nature benefit from the potentially large amount of existing data, the lack of formalized experimental designs and/or consistent sample collection protocols results in practical challenges for data interpretation, as discussed in this paper. In contrast, some regulatory agencies have implemented studies for assessing background indoor/outdoor air quality using formal experimental designs to guide data collection from a specified number of buildings. Of particular relevance to this paper are the “Building Assessment Survey and Evaluation” (BASE) study conducted by the CitationU.S. EPA (2001a), and the background study of fuel-oil heated homes conducted by the NYS Department of Health (CitationNYSDOH, 2005). Studies of this type avoid many of the pitfalls associated with synthesizing information from uncoordinated data collection efforts; however, the scope of interpretation may be constrained by a reduced number of samples and/or assumptions used to define the study boundaries.
The work described in this paper was part of a larger study to develop a comprehensive database from SVI investigations at NYS MGP sites. The overall project was motivated by the need for an improved general understanding of soil vapor contamination and SVI at MGP sites, including but not limited to the range of MGP-related vapor concentrations observable in different sample types, the relationship between MGP sites and “background” conditions, the nature of vapor concentration attenuation between potential sources and receptors, and the influence of building specific factors on SVI. However, as discussed in the following, unique features of the assembled data precluded the use of conventional statistical methods, despite the relatively large number of sites, buildings and samples. Consequently, the focus of this paper is on the development and evaluation of specialized statistical tools; general conclusions related to SVI investigations at NYS MGP sites will be reported in a companion paper.
For complex data sets assembled from multiple sources, the scope of feasible statistical analysis depends not only on the characteristics of the data, but also on the manner in which the statistical questions are formulated. As a first step in exploring issues related to SVI processes at individual sites, it was desired to examine the aggregated behavior of “MGP sites” as a whole by treating all relevant sample data as representative of a single population. However, unlike techniques applied to other environmental media, such as studies of background soil contamination, the sampling and analysis of vapor concentrations are subject to a variety of complicating factors such as seasonal variability, repeated sampling at the same building, samples collected from multiple buildings located on the same property, and/or samples from multiple off-site properties that are potentially affected by the same MGP site contamination. Sample concentrations may also be affected by difference in sampling methodology, such as sampling duration, as well as building conditions, such as heating, ventilation, and air conditioning (HVAC) system operation. Taken together, these influences suggest that data sets assembled using a retrospective data mining approach might be best regarded as a collection of subpopulations (i.e., a stratified sample) that require additional processing to appropriately represent an aggregate population. Stratifications in data sets can often be dealt with by an appropriate data-weighing scheme, although it may not be appropriate to address all stratification issues arising from complex and (or) interdependent factors through such procedures.
In addition to the issues related to possible stratification, the MGP SVI data contained a very large proportion of “nondetect” (left-censored) data, with considerable variation in censoring limits. These differences reflect a number of site- and laboratory-specific factors that influence the analysis of individual vapor samples, as well as a general lack of consistency in sampling and analytical protocols during a period of evolving regulatory guidance. Although various rigorous statistical techniques are available to address data censoring, most methods have not been extended to deal with stratification issues that result in unequally weighted data sets.
In view of the likely similarity between the data collected for this study and other retrospective collections of environmental data, this paper develops and evaluates new statistical methods for data sets characterized by both a substantial and inconsistent degree of left-censoring and a possible stratification of data across multiple sites, buildings, and sampling conditions. Although potentially extendable to a variety of statistical inference, the following applications were emphasized: (1) methods for calculating concentration percentiles for the aggregated MGP SVI population, (2) methods for characterizing the uncertainty in computed percentiles (i.e., confidence intervals), and (3) methods for comparing the aggregated MGP SVI population with a reference (e.g., background) population. In this paper, illustrations of these applications are demonstrated with indoor air concentrations for several compounds.
Data
Data sources
The New York State Department of Environmental Conservation (NYSDEC) and eight utility companies have identified more than 200 former MGP sites that might require investigation (CitationNYSDEC, 2010). This paper uses data from SVI studies conducted at 40 such MGP sites (see Supplemental Information ), including 2129 air or vapor samples collected during investigations that took place up to 2009. Samples from outdoor air, indoor air, and soil vapor were collected using SUMMA canisters and analyzed by contract laboratories using variations of the EPA TO-14/15 methods (CitationU.S. EPA, 1999). Consistent with the scope of these methods, information on more than 70 compounds was included in the database. However, because of the focus on MGP sites, data interpretation was directed at the following volatile and semivolatile organic compounds: benzene, toluene, ethyl benzene, m,p-xylene, o-xylene, 1,2,3-trimethylbenzene, 1,2,4-trimethylbenzene, 1,2,5-trimethylbenzene, indane, indene, and naphthalene, subsequently referred in this paper as MGP compounds. The majority of these volatile and semivolatile organic compounds have been identified as examples of indicator compounds that have been included in site-specific analyte lists for MGP sites in the current NYS SVI guidance (CitationNYSDOH, 2006), with additional compounds included due to the presence of petroleum compounds at some MGP sites.
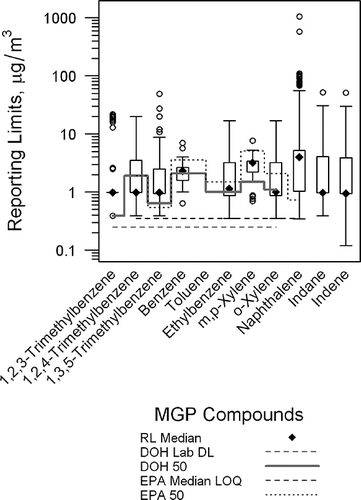
Figure 1. Reporting limits for censored data in indoor air samples. Dotted black line represents U.S. EPA BASE 50th percentile values; solid gray line represents 50th percentile values from NYSDOH study; dashed black line represents median LOQ in U.S. EPA study; and dashed gray line represent laboratory detection limit in NYSDOH study (LOQ, limits of quantitation; EPA 50, EPA 50th percentile value; DOH 50, 50th percentile value from NYSDOH study.) Figure generated using lattice package in R (Sarkar, 2008).
A typical MGP site report consisted of tabulated sample concentrations from indoor air, outdoor air, crawlspace air, and/or soil vapor (subslab and/or exterior), which sometimes, but not always, were collected at the same time. For many sites, indoor air samples were collected from multiple locations within a building, such as a basement, multiple floors, and/or different rooms on the same floor. Conversely, subslab vapor and outdoor air samples were typically collected from only one or two locations for a given building. Soil vapor samples were primarily collected near footprints of former MGP structures or near building foundations.
In addition to providing sample locations and analytical results, some of the site reports included quality assurance (QA) information such as data usability summaries, data validation checklists, field or laboratory duplicates, and/or information about tracer gas tests for soil vapor samples; however, such information was not consistently present. Air concentrations were typically expressed as mass per unit volume (e.g., micrograms per cubic meter, μg/m3), but a small number of reports utilized volumetric units (e.g., ppbv), which were converted for this study to mass units by assuming standard temperature of 25°C and 1 atm pressure. Minor inconsistencies in sampling, analysis, and validation methods were attributed primarily to the timing of the investigations, many of which preceded the publication of final SVI guidance documents by New York State (CitationNYSDOH, 2006) and draft guidance by federal (CitationU.S. EPA, 2002) regulatory agencies. However, for the purpose of this paper, all data reported by a NYSDOH-certified laboratory and submitted to a regulatory agency were used as reported. Apart from sample information, some site-specific reports also contained building information that included location, type of building (residential, commercial, or industrial), type of foundation and/or foundation slab, type of heating and air-conditioning system, presence of attached garages, and various other factors. More than two-thirds of the building types analyzed in this paper were single family residential dwellings, which were primarily associated with a few MGP site investigations that involved large off-site groundwater plumes. The data set also included a significant number of multistory commercial buildings located in the New York City metro area.
Database development
A comprehensive relational database, subsequently referred as the MGP-SVI database, was developed to efficiently store and process information from the multiple SVI investigation reports using the Microsoft Access platform. Database tables were designed to organize and store a variety of information related to the site, building(s) and samples in relational tables. Site attributes included name, address, ZIP code, county, and population density (based on ZIP code and 2010 US Census data). Building attributes for the database table included the type of structure, foundation, heating system, sump, and garage, as well as the relationship to an MGP site. Attributes of vapor samples included collection date, laboratory information, sample matrix (indoor/outdoor/crawlspace air/subslab vapor/soil vapor), concentration reporting limit, data usability summary information, use of tracer gas tests, and relationships to buildings.
Concentration results from all sample matrices (including field and laboratory duplicates) were converted manually into a consistent format and imported into normalized database tables. When feasible, database entries were independently checked against hard copy reports to minimize transcription errors. Of particular importance to this study, database sample records included information about both the estimated concentration and the compound- and sample-specific reporting limit, as recommended in CitationHelsel (2005a), which also enabled identification of left censored data.
Methods for Data Analysis
Although the MGP-SVI database was designed to support a broad range of exploratory analysis, several important applications were emphasized in developing interpretative tools. Data from all sites were initially aggregated and treated as a single population of “MGP sites.” Preliminary analysis included the calculation of overall summary statistics and percentiles for the 11 volatile and semivolatile organic compounds mentioned previously across all samples, as well as exploratory analyses to characterize the range of concentration reporting limits and evaluation of the influence of selected sampling methods and site conditions. As discussed in the following, specialized methods were needed to address the large number of censored concentration data and possible artifacts due to sample clustering. In addition, options for performing various hypothesis tests were evaluated to support comparisons between the entire MGP site population and independently characterized background populations, as well as comparisons between subgroups of the MGP site population. Although the NYSDOH background study (CitationNYSDOH, 2005) represents a more appropriate reference for comparing NYS residential data, methods for population-based comparisons are illustrated in this paper using the U.S. EPA BASE study, which addressed a broader scope but exhibited similar trends in air concentration percentiles. In extracting data from the U.S. EPA study, it is noted that the term “limit of quantitation” was interpreted as the concentration threshold below which a precise numerical value could not be assigned even if the compound was detected.
Summary statistics
Methods for computing descriptive statistics for data sets with censored observations have evolved within a variety of disciplines; in general, traditional “substitution” methods are increasingly being replaced by more rigorous nonparametric or imputation methods, as implemented in numerous commercial or open source statistical software packages. In particular, the nonparametric Kaplan–Meier (KM) method is well established and widely used to deal with censored data (CitationHelsel, 2005a; CitationSingh et al., 2006; CitationU.S. EPA, 2012) without assumptions regarding the underlying statistical distribution of the data. Alternatively, maximum likelihood estimation (MLE) methods can readily accommodate censored data by computing parameters for an assumed statistical distribution that maximizes the probability of observing the given data set; typically, a log-normal distribution is assumed in the analysis of environmental data.
Because of the large number of left-censored data in the MGP-SVI database, comparisons were performed to evaluate the relative performance KM and MLE methods. In addition, computations of percentile values were performed using a substitution method (one-half the reporting limit value assigned for censored data), as well as with a data subset with the censored values removed (subsequently called the rejection method). To illustrate these comparisons in this paper, three MGP compounds, toluene, ethylbenzene, and naphthalene, were selected because they were associated with substantially different proportions of censored data (4.6% for toluene, 34% for ethylbenzene, and 78% for naphthalene). Compound-specific percentiles were estimated using the R-based statistical software package (CitationR Development Core Team, 2010). In particular, the R package Non-Detects and Data Analysis (NADA; CitationLee, 2009) was used to implement the Kaplan–Meier and MLE methods. The NADA package transforms left-censored data to right-censored data by subtracting each datum from a large number (commonly referred to as “flipping” the data) and then uses functions from the R survival analysis package (CitationTherneau et al., 2009) to perform statistical computations on the flipped data, using equal weights for all data points. For this study, the relevant NADA routines were modified to perform computations for weighted left-censored data. For comparisons with the MLE method, the underlying distribution was assumed to be lognormal.
The air samples in the version of MGP-SVI database accessed for this paper included multiple samples from approximately 244 buildings. However, the distribution of samples across buildings was nonuniform, with some buildings sampled multiple times and/or at multiple indoor locations. To explore potential artifacts from such unintended stratification, a two-tiered weighting scheme was implemented for computing summary statistics in which an overall combined weight for each individual sample was assigned as the product of weights from the two tiers. In the first tier, each sample from building j was assigned a weight of 1/nj , where nj represents the number of all samples from a single building (collected at different times and/or indoor locations). For the second tier (weights for each building), two strategies were developed and compared: (A) Weights for each building were assigned proportional to the number of building-specific samples, nj , reflecting the assumption that extensively sampled buildings should generate more weight, and (B) all buildings were considered of equal importance and assigned equal weights. The combined weight for each sample was then obtained by multiplying building and individual sample weights. Strategy A resulted in equal weights for all samples, while strategy B resulted in unequal sample weights (equal to 1/nj ). These weighting strategies are equivalent to treating each sample in the MGP-SVI data population either as a simple random sample or as a stratified random sample grouped by individual buildings (CitationGilbert, 1987). Similar procedures could be developed to address other stratification issues; illustrative calculations for the building scenario are presented to highlight the potential utility of data weighting. Summary statistics for equally weighted censored data (strategy A) can be calculated using routines available with standard software packages such as NADA or Minitab. However, the same routines cannot be applied for unequally weighted data (strategy B) without some modification as described earlier.
Nonparametric confidence intervals for descriptive statistics were computed using bootstrapping procedures for censored data (CitationEfron, 1981) as implemented in the Boot package in R (CitationCanty et al., 2010). To address potential artifacts related to the inconsistent numbers of samples in different buildings, new methods were needed to distinguish variability of data between strata (buildings) and within strata, similar to the concepts developed as already discussed for the calculation of percentiles. In the MGP-SVI database, censored data are represented by an ordered pair of a concentration value and an integer flag that indicates whether the datum is a measured value (including data with “J” qualifiers) or a substituted censoring limit (typically designated with a “U” qualifier). For computing percentile confidence limits based on Kaplan–Meier methods, three alternative bootstrapping strategies were developed to deal with data weighting: (I) simple case statistical resampling with replacement, (II) conditional bootstrapping and, (III) building-based bootstrap resampling. For the simple case resampling (strategy I), the sampling process included censored data; that is, the reported datum and the censoring indicator were sampled as an ordered pair. For the conditional bootstrapping (strategy II), data values and indicators were sampled independently to create an ordered pair for bootstrapping, as described by (CitationEfron, 1981). In this strategy, the censoring indicators of the sampled data were assigned separately by sampling of indicators based on the distribution of censoring limits of the original data set. For building-based resampling (strategy III), instead of sampling individual data, the building identifiers were sampled randomly from the original dataset. Resampled data sets were constructed by including all samples from these resampled buildings. Strategies I and II resulted in the same sample size for each statistically resampled unit. Strategy III resulted in different sample sizes for statistically resampled units because each building had different numbers of samples. An additional “two-stage” bootstrapping method (based on sampling buildings in the first stage and then resampling within a building in second stage) was not considered in this study because previous work has revealed inaccuracies for weighted Kaplan–Meier estimates implemented using a similar approach (CitationGalimberti et al., 2002).
Hypothesis testing
Site-specific environmental data are frequently evaluated by comparison with a reference-based standard or a “background” population believed to represent unimpacted conditions. For example, a percentile of interest could be compared with a reference value using the computed confidence interval described in the previous section. In some cases, a more comprehensive comparison might be desired based on the full distribution of observations.
For the MGP-SVI database, it might be desirable to compare the entire aggregation of sample observations with data from other studies such as the U.S. EPA BASE project, in the absence of reference-based standards for specific MGP compounds. Numerous parametric and nonparametric methods for such hypothesis testing are available for uncensored data sets. However, when censored data are present, most methods require substitution of a censored datum with a fixed or variable numeric value obtained by computation based on an assumed distribution. For this study, nonparametric hypothesis tests were considered appropriate because the relatively large numbers of censored data hindered the application of distributional assumptions.
To compare the full distribution of data (rather than a measure of central tendency), a hypothesis test can be formulated using the survival function S(t) of each group. Nonparametric hypothesis tests for two or more groups that contain right-censored data are discussed in (CitationHarrington et al., 1982), but similar methods were not located for left-censored data. However, existing methods can be suitably modified for left-censored data (CitationHelsel, 2005b) by “flipping” the data as explained previously. Such methods are well established for equally weighted data (CitationXie et al., 2005).
To accommodate unequally weighted right-censored data, the KM estimator of the survival function is modified from its standard formulation as follows:
Using the terminology of survival analysis, for equally weighted right censored data (wi
= 1), represents number of observations (censored or uncensored) just prior to “time” t
i
(or number of individuals “at risk” just prior to t
i
) and
represents the number of uncensored observations prior to time ti
, (or number of “deaths”). For equally weighted data, Equationeq (1) reduces to the standard KM estimator:
For the type of data-mining study considered in this work, unequal weighting of data might be desirable to support population-based inference. For example, some individual studies could have utilized repeated sampling or multiple sample locations within individual buildings, and it would therefore be intuitive to weight the data based on the building-specific numbers of samples. To address this scenario, a test statistic based on weighted observations (similar to (CitationXie et al., 2005)) was developed to compare two populations (k = 0, 1) in terms of the survival functions, with the following null and alternative hypotheses (Ho, HA):
Ho: The survival functions of the two populations are equal.
HA: The survival functions of the two populations are not equal.
As discussed in the previous section, the individual weight wi k of each observations can be assigned as (1/ni k ), where ni k is the number of samples in the ith building in the kth population. With the second population (k = 1) designated as the reference population, a test statistic G ρ is defined as:
In general, the expected value of G
ρ is zero if there is no difference in the number of observed between the test population and expected number of concentrations calculated from the pooled sample from both populations. When ρ = 0 in Equationeq (3), the term
is unity, and for equally weighted right-censored data, the test statistic G
ρ reduces to the standard log-rank test (CitationHarrington et al., 1982). Conversely, when ρ = 1, the test statistic G
ρ corresponds to the Peto and Peto modification of the test (CitationHarrington et al., 1982) for equally weighted data. In general, the Peto and Peto test is considered to be more robust than other rank-based tests (CitationLatta, 1977); it has also been applied to lognormal environmental data with multiple detection limits by Millard and Deverel (CitationMillard et al., 1988), although the assumption of lognormality is not required in general.
The illustrative hypothesis tests were performed on “flipped” data using a bootstrap approach similar to the methods described above for the percentile confidence intervals. Such an approach is needed to support the calculation of confidence levels (p values) without assumptions about the distribution of the underlying population. For comparison purposes, tests were performed using two bootstrapping techniques. The first strategy was similar to bootstrapping method III discussed earlier, in which buildings were assigned to samples probabilistically using a Bernoulli distribution with the probabilities determined by the proportions of buildings in the populations. The second approach was similar to bootstrapping method I described earlier, in which individual samples were assigned to populations using a Bernoulli distribution with probabilities determined by the proportions of samples in the populations. The value of G ρ in Equationeq (3) was calculated for the simulated groups multiple times to obtain distribution of the difference of observed and expected values for a group. The p value for the hypothesis test for the data set with original group allocations was then calculated based on the resulting distribution. Similar hypothesis tests were also performed by assigning equal weights to individual samples.
A summary of all variations of the statistical methods, weighting, and bootstrapping strategies evaluated in this work is presented in .
Table 1. Variations of statistical methods used in this work
Results
Reporting limits in MGP-SVI database
The occurrence of censored data in environmental data sets is quite common; the MGP-SVI database is not unique in this respect. However, in designed experiments, data collection and analysis methods typically are controlled so that the resulting data sets have relatively few censored or nondetect data and the censoring limits usually are consistent across samples. In contrast, the MGP-SVI data set contained large numbers of censored data with highly variable censoring/reporting limits (see ). To illustrate the potential significance of this issue, reporting limits for some compounds were compared with the median concentration as well as the median “limit of quantitation” (LOQ) for indoor air from the U.S. EPA BASE Study (CitationU.S. EPA, 2001a). More than 50% of the MGP-SVI concentrations for 1,2,3-trimethylbenzene, 1,3,5-trimethylbenzene, indane, indene, and naphthalene were reported as “nondetect” for indoor air and subslab samples (see ). Overall, the range of reporting limits varied up to four orders of magnitude across samples, as shown in the box and whisker plot in . Of particular interest, censoring for naphthalene and 1,3,5-trimethylbenzene was observed at concentration values higher than median U.S. EPA BASE values for many indoor samples ().
Table 2. Sample characteristics for MGP-VI database (N = number of samples, RL = reporting limit in μg/m3)
The reporting limits for vapor samples are influenced by several factors that would be expected to affect all analytes similarly, including sampling apparatus, laboratories, sampling duration, and dilution during laboratory processing. This consistency was evident in correlation plots constructed for reporting limits for some MGP compounds from the same samples, as most correlation coefficients were greater than 0.95 (see Supplemental Information ). The exception to this trend was naphthalene, which exhibited lower correlations (less than 0.78) than all other compounds, suggesting that laboratory criteria for assigning naphthalene reporting limits were not consistent across different studies. Furthermore, while a detection limit of 0.2–0.5 μg/m3 is generally achievable for naphthalene with the U.S. EPA TO-15 method (CitationFortune et al., 2010), much higher reporting limits values were associated with the samples in the version of the database used for this paper.
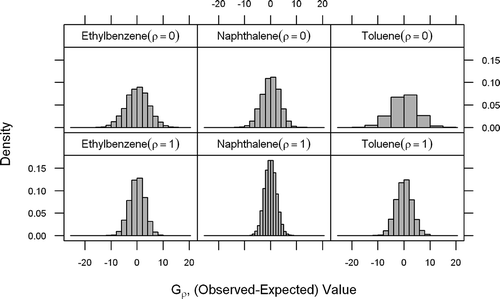
Figure 2. Bootstrap distributions for different hypothesis tests (case B-III). Figure generated using lattice package in R (Sarkar, 2008).
For some compounds such as indane, indene, 1,2,3- and 1,3,5-trimethylbenzene, and naphthalene, the elevated reporting limits for all sample matrices might have been influenced by the absence of established method detection limits in the U.S. EPA TO-15 procedure (CitationU.S. EPA, 1999), which requires the analytical system to meet specific criteria for each Title III compound on the target compound list; the compounds just listed here are not listed in the Title III of the Clean Air Act (except for 1,2,4-trimethylbenzene) (CitationU.S. EPA, 2001b).
Percentile computations
Using the modified statistical methods described earlier, percentiles of observed MGP vapor concentrations could be calculated despite the presence of large numbers of censored data; the corresponding confidence intervals were calculated using bootstrapping methods (). To illustrate the performance of alternative methods, computations for toluene, ethylbenzene, and naphthalene in indoor air are shown in and . These compounds were selected based on the detection percentages in indoor air, which ranged from high (˜95%) for toluene to moderate for ethylbenzene (˜66%) and low (˜22%) for naphthalene.
Table 3a. Summary of selected statistical computations for 50th percentile concentration (all concentration values and confidence limits are expressed in μg/m3; percentile values in μg/m3 using substitution method [SUB-A] and by rejecting censored data appear [REJ-A] below the names of the compound)
Table 3b. Summary of selected statistical computations for 90th percentile concentration (all concentration values and confidence limits are expressed in μg/m3; percentile values in μg/m3 using substitution method [SUB-A] and by rejecting censored data [REJ-A] appear below the names of the compound)
The indoor concentrations percentile values calculated using equal weights for all samples (strategy A) were generally higher than the values obtained by considering equal weights for all buildings (strategy B), for both Kaplan–Meier and MLE methods. When applied using the same weighting scheme, the Kaplan–Meier and MLE methods gave slightly different results but were generally in agreement. The results from substitution and rejection methods for toluene and ethylbenzene were in fair agreement with the results from Kaplan–Meier and MLE methods. This result was expected for toluene, as the detection frequency (˜95%) was higher than the percentile values used for comparison (50th and 90th percentile). In contrast, for ethylbenzene the median detection limit is near the lower portion of the range of censoring limits (see ), resulting in little or no difference in the percentile values computed using different methods. However, the 90th percentile values for naphthalene computed using either the substitution or rejection method did not agree with Kaplan–Meier and MLE methods. This difference can be attributed to the combination of low detection percentage and the asymmetry of the reported censoring limits (i.e., the median censoring value was located near the upper limit of the observed range for naphthalene; see ).
For the bootstrapping methods, the average percentiles calculated with 5000 repetitions on the bootstrapped data set were in good agreement with the values calculated using the original dataset and exhibited little bias. Bootstrapping results using strategy I and strategy II produced similar results for the Kaplan–Meier method and bootstrapping strategy II was therefore not for applied to MLE variation. For all cases, the bootstrapped confidence intervals exhibited wider bands for both weighting strategies A and B when bootstrap resampling was based on buildings (bootstrap strategy III) instead of individual samples (bootstrapping strategies I and II). These results suggest that the uncertainty in vapor concentration summary statistics is affected by variability both between and within individual buildings. Although not illustrated here, a similar approach could be adopted to account for the population uncertainty attributable to variability across multiple sites with different characteristics.
The bootstrapped frequency distributions of selected percentiles are shown in the Supplemental Information Figures 3a–3c. In general, the calculated distributions for the 90th percentile values were smoother than the distributions for 50th percentile value, with the exception of the 90th percentile conditional bootstrap for naphthalene, which is influenced by a large percentage of censored data and highly variable detection limits. Also, the bootstrap distributions for building based bootstrapping (KM-B-III), as compared to other bootstrapping methods (KM-A-I and KM-A-II), exhibited a greater spread, indicating that building-related factors influenced the computed summary statistics. In general, the confidence bands for the 50th percentile values were relatively narrow, with the majority of observations near the median value. The wider confidence band for 90th percentile values for naphthalene obtained with the Kaplan–Meier method (as compared to the MLE methods) can be attributed to the low detection percentage of the naphthalene data and the underlying assumption of distribution associated with MLE method. In general, both Kaplan–Meier and MLE methods can provide a good estimate of median of data (CitationMiller, 1983); however, the variability of extreme percentiles can be affected by choice of method as well as censoring pattern and the proportion of censored data.
Hypothesis testing
The results of hypothesis testing to compare the MGP-SVI dataset with data from the EPA Base study are presented in , based on different bootstrapping and sample weighting options using 5000 repetitions. These results involve a preliminary subset of the MGP-SVI data and are presented only to illustrate the potential influence of the selected statistical methodology on test results. shows the simulated bootstrapping distributions of the test statistic G ρ for strategy III with weighing strategy B, which are roughly symmetrical and consistent with a normal distribution. In general, all variations of the test produced very low p values, suggesting a real statistical difference between the two populations. However, the calculated values for G ρ were smaller when the data are weighted (the options B-I and B-III), which indicates a potential statistical bias introduced when individual building/locations are sampled inconsistently. In particular, the calculated p value for naphthalene with bootstrapping strategy III, which incorporates variability across buildings, was higher compared to bootstrapping strategy I, which utilized weighting based only on the number of individual samples. This difference is likely influenced by the high percentages of censored observations for naphthalene, as well the greater variability in censoring limits across buildings.
Table 4. Results of hypothesis test to compare MGP with U.S. EPA BASE data (G ρ values are for EPA BASE group; p-values based on 5000 repetitions)
Conclusions for the one-sided alternate hypothesis, S0(t) > S1(t), or vice versa can also be made by observing the sign of calculated for the two-sided alternative hypothesis. The calculated p values corresponding to the two-sided alternative hypothesis would be reduced by a factor of two for assessing p values for the one-sided alternative hypothesis; for example, a one-sided test should be used when “direction of difference is specified as a part of study design” (CitationHelsel, 2005b).
Discussion
The development of the methods presented in this paper was motivated by the availability of a large SVI database that spans the diversity of site and building conditions across NYS MGP sites; a complete analysis of the full data set will be reported in a companion paper. When data sets contain elevated and inconsistent reporting limits, the appropriate selection of computational techniques is important to the rigor and robustness associated with descriptive statistics and population-based inference. For the data considered in this paper, relatively consistent concentration percentiles were calculated using the nonparametric Kaplan–Meier method and the (lognormal) maximum likelihood estimation methods. However, modification of these techniques to include data weighting revealed that the inconsistent distribution of samples across multiple buildings, as well as building-specific differences in censoring limits, could substantially influence the confidence limits associated with upper percentiles. Although full-distribution comparisons would be less sensitive to such methodological differences, some forms of inference, such as hypothesis testing for a selected percentile versus a reference value, could be more substantially affected. Additionally, for data sets characterized by extreme degrees of censoring (very high percentages and/or limits), formal statistical comparisons may simply be infeasible.
The full-distribution hypothesis test developed in this paper is ideally applied when both populations are included within a designed study characterized by similar and consistent censoring limits. However, it is likely that reference data sets established by statutory agencies will be used in special circumstances, particularly for SVI applications. Where possible, new SVI investigations should be conducted to conform to current data quality standards with detection limits similar to the background studies, which will enhance the applicability of the procedures described here. Also, caution should be used when a very small proportion of buildings is believed to be environmentally affected, as population-based test statistics may be relatively insensitive. In such cases site/building-specific comparisons may be more suitable.
For the MGP-SVI data set described in this paper, the large numbers of censored data reflect, in part, the evolution of sampling protocols for SVI site investigations, with substantially less censoring associated with more recent studies. Thus, improvements in the required concentration reporting limits are likely to benefit all applications, although stratification issues will not be substantially affected. In general, the use of the tools described in this work should be considered in the context of the project-specific statistical objectives, the relevant sampling and analytical protocols, the characteristics of the reference population, and the nature of data censoring, particularly in the vicinity of relevant concentration thresholds.
Supplemental Materials
Download Zip (864.5 KB)Acknowledgment
This study was funded by National Grid in conjunction with the Energy and Environmental Alliance of New York (EEANY). Anshuman Singh's doctoral studies were partially supported by a National Science Foundation IGERT traineeship award, number DGE-0333417.
References
- Canty, A., and B. D. Ripley. 2010. boot: Bootstrap R (S-plus) functions: R package version 1.2-42 http://statwww.epfl.ch/davison/BMA (http://statwww.epfl.ch/davison/BMA)
- Dawson , H.E. and McAlary , T. 2009 . A compilation of statistics for VOCs from post-1990 indoor air concentration studies in North American residences unaffected by subsurface vapor intrusion . Ground Water Monitoring & Remediation , 29 ( 1 ) : 60 – 69 . doi: 10.1111/j.1745-6592.2008. 01215.x
- Efron , B. 1981 . Censored data and the bootstrap . Journal of the American Statistical Association , 76 ( 374 ) : 312 – 319 . doi: 10.1080/01621459.1981. 10477650
- Fortune , A. Tuday , M. 2010 . Comparison of naphthalene ambient air sampling & analysis methods at former manufactured gas plant (MGP) remediation sitesInternational Journal on Soil, Sediment, and Water . 3 ( 1 ) : 1
- Galimberti , S. Sasieni , P. 2002 . A weighted Kaplan–Meier estimator for matched data with application to the comparison of chemotherapy and bone-marrow transplant in leukaemia . Statistics in Medicine , 21 ( 24 ) : 3847 – 3864 . doi: 10.1002/sim.1357
- Gilbert , R.O. 1987 . Statistical Methods for Environmental Pollution Monitoring , New York , NY : John Wiley and Sons .
- Harrington , D.P. and Fleming , T.R. 1982 . A class of rank test procedures for censored survival data . Biometrika , 69 ( 3 ) : 553 – 566 . doi: 10.2307/2335991
- Helsel , D.R. 2005a . More than obvious: Better methods for interpreting nondetect data . Environmental Science & Technology , 39 ( 20 ) : 419A – 423A . doi: 10.1021/es053368a
- Helsel , D.R. 2005b . Nondetects and Data Analysis: Statistics for Censored Environmental Data , Hoboken , NJ : Wiley-Interscience .
- Johnson , P.C. Ettinger , R.A. 2009 . Empirical assessment of ground water-to-indoor air attenuation factors for the CDOT-MTL Denver site . Ground Water Monitoring & Remediation , 29 ( 1 ) : 153 – 159 . doi: 10.1111/j.1745-6592.2008.01224.x
- Latta , R.B. 1977 . Generalized Wilcoxon statistics for the two-sample problem with censored data . Biometrika , 64 ( 3 ) : 633 – 635 . doi: 10.2307/2345346
- Lee, L. 2009. Nondetects and data analysis for environmental data: Package NADA 1.5-2 http://cran.r-project.org/web/packages/NADA (http://cran.r-project.org/web/packages/NADA)
- Millard , S.P. and Deverel , S.J. 1988 . Nonparametric statistical methods for comparing two sites based on data with multiple nondetect limits . Water Resources Research , 24 ( 12 ) : 2087 – 2098 . doi: 10.1029/WR024i012p02087
- Miller , R. G. Jr. 1983 . What price Kaplan-Meier? . Biometrics , 39 ( 4 ) : 077 – 1081 . doi: 10.2307/2531341
- New York State Department of Environmental Conservation. 2010. The MGP program at NYSDEC http://www.dec.ny.gov/chemical/24904.html (http://www.dec.ny.gov/chemical/24904.html) (Accessed: August 9, 2012 ).
- New York State Department of Environmental Conservation . October 2006 . DER-13: Strategy for prioritizing vapor intrusion evaluations at remedial sites in New York , October , Troy , NY : NYSDEC .
- New York State Department of Health. 2005. Summary of indoor and outdoor levels of volatile organic compounds from fuel oil heated homes in NYS, 1997–2003 (revised November 14, 2005) http://www.nyhealth.gov/environmental/indoors/air/fuel_oil.htm (http://www.nyhealth.gov/environmental/indoors/air/fuel_oil.htm) (Accessed: 9 August 2012 ).
- New York State Department of Health . 2006 . Final guidance for evaluation soil vapor intrusion in State of New York , Troy , NY : Bureau of Environmental Exposure Investigation .
- R Development Core Team 2010. R: A language and environment for statistical computing http://www.R-project.org (http://www.R-project.org)
- Sarkar , D. 2008 . Lattice: Multivariate Data Visualization with R , New York , NY : Springer .
- Singh, A., R. Maichle, et al. 2006. On the Computation of a 95% Upper Confidence Limit of the Unknown Population Mean Based Upon Data Sets with Below Detection Limit Observations. U.S. Environmental Protection Agency. EPA/600/R-06/022 http://www.epa.gov/osp/hstl/tsc/Singh2006.pdf (http://www.epa.gov/osp/hstl/tsc/Singh2006.pdf)
- Therneau, T., and T. Lumley 2009. survival: Survival analysis, including penalised likelihood.: R package version 2.35-8 http://CRAN.R-project.org/package=survival (http://CRAN.R-project.org/package=survival)
- U.S. Environmental Protection Agency . 1999 . Compendium Method TO-15, Determination Of volatile organic compounds (VOCs) in air collected in specially-prepared canisters and analyzed by gas chromatography/mass spectrometry (GC/MS) , Cincinnati , OH : Center for Environmental Research Information Office of Research and Development .
- U.S. Environmental Protection Agency . 2001a . Building Assessment Survey and Evaluation (BASE) study , USEPA Air and Radiation (6609J). EPA-402-C-06-002 . http://www.epa.gov/iaq/base/index.html
- U.S. Environmental Protection Agency . 2001b . Consolidated list of chemicals subject to the Emergency Planning and Community Right-To-Know Act (EPCRA) and Section 112(r) of the Clean Air Act , Office of Solid Waste and Emergency Response . http://www.epa.gov/ceppo/
- U.S. Environmental Protection Agency . November 2002 . OSWER draft guidance for evaluating the vapor intrusion to indoor air pathway from groundwater and soils (subsurface vapor intrusion guidance) , November , U.S. Environmental Protection Agency . http://www.epa.gov/osw/hazard/correctivereaction/eis/vapor.htm
- U.S. Environmental Protection Agency . 2012 . EPA's vapor intrusion database: evaluation and characterization of attenuation factors for chlorinated volatile organic compounds and residential buildings , Washington , DC : U.S. EPA Office of Solid Waste .
- Xie , J. and Liu , C. 2005 . Adjusted Kaplan–Meier estimator and log-rank test with inverse probability of treatment weighting for survival data . Statistics in Medicine , 24 ( 20 ) : 3089 – 3110 . doi: 10.1002/sim.2174