Abstract
Aerosol samples collected from July 2007 to March 2008 were used to obtain major aerosol constituents in an urban location in the Pearl River Delta Region (PRD), China. The minimum organic carbon (OC)/elemental carbon (EC) ratio was used to calculate the primary and secondary organic carbon and the extinction effect of the secondary aerosol on visibility was estimated. As indicated in the analysis, the mass of secondary aerosol takes up 50% of the total mass of PM2.5; the OC/EC ratio is larger than 2 and there are significant characteristics of secondary aerosol generation; the levels of secondary OC are comparable with those of sulfate; and there is obvious enrichment of secondary aerosol on more polluted days. In a dry environment, the extinction weight is 59% for the secondary aerosol, while it is as high as 82% if the environment is highly humid (relative humidity [RH] = 95%). The hygroscopic growth of the aerosol can reduce visibility greatly; the secondary aerosol shares much larger quotas on more polluted days. For the Pearl River Delta (PRD), secondary aerosol and carbonaceous aerosol, especially secondary organic carbon (SOC), are a very acute problem; the study of the generating mechanism and sources for secondary aerosol is the key to the effort of controlling visibility in this region. The equation set forth in IMPROVE experiments can only be referenced but is not applicable to evaluate the extinction effect of individual aerosol components on visibility in the PRD region.
The extinction effects on visibility by different constituents are studied in this work using compositional data derived from the measurements, with special efforts on examining the extinction of secondary aerosol and the enrichment and extinction contributions of the constituents with the variation of pollution level and relative humidity, so as to provide a scientific basis for the mitigation of atmospheric aerosol pollution and improving visibility in the PRD of China.
Introduction
The atmospheric aerosol pollution from urbanization processes and resultant environmental effects are among the hot topics in present-day research on the atmospheric environment. As demonstrated in the observational studies of the past few years, fine particles are the main source of aerosol pollution for the cities in the Pearl River Delta (PRD) in that PM2.5/PM10 is more than 0.65, PM1/PM2.5 more than 0.86, and PM1/PM10 more than 0.56, all without exception. The diurnal change of urban PM2.5 reflects the effects of secondary aerosol formed as a result of photochemical reactions around midday. In the nuclei mode and accumulative mode, abundant particles of atmospheric aerosol with the size less than 1 μm are mainly responsible for substantial attenuation of visibility (CitationDeng, 2008). The radiative properties of aerosol are determined by its chemical compositions, which have rarely been studied before in research on the worsening visibility in the PRD.
On the basis of compositional data, the atmospheric aerosol can be categorized into three main groups: water-soluble inorganic compositions (sulfate, nitrate, ammonium, sea salt, etc.), carbonaceous aerosol (OC: organic carbon, EC: elemental carbon), and crust elements (Si, Al, Fe, etc.). It is usually believed that most of the crust elements exist in coarse particles, while most of the water-soluble inorganic aerosol and carbonaceous aerosol are found in fine particles. All aerosols generated due to chemical transformation (i.e. photochemical reactions) are called secondary aerosol, because this is not released directly from natural sources or anthropogenic activities, and this includes sulfate, nitrate, ammonium, and secondary organic carbon (SOC). Most aerosol species (e.g., (NH4)2SO4, NH4NO3) can contribute to light scattering, while the species with an imaginary part, such as elemental carbon (EC), also can cause light absorption. The mass extinction efficiency (MEE) and mass scattering efficiencies (MSE) depend not only on the particle size but also on chemical composition.
The IMPROVE (Interagency Monitoring of Protected Visual Environment) project established empirical formulas (CitationMalm et al., 1994; CitationPitchord et al., 2007) to evaluate the contribution of bulk PM2.5 chemical species to the total light extinction. The IMPROVE formula has been widely used to apportion contributions of individual major aerosol constituents to light extinction. CitationDebell et al. (2006) summarized that in the northwestern United States, the contribution of organic matter (OM) to light extinction could be as high as 50–60%, while in the eastern United States ammonium sulfate is the dominant contributor (>50% contribution) to the reconstructed extinction. Ammonium sulfate was also the most significant source in Beijing (CitationJung et al., 2009). Over the Pearl River Delta, (NH4)2SO4 was also a major contributor, accounting for 20–60% of the extinction (CitationWang, 2003; CitationCheung et al., 2005). But occasionally, due to the severe impact of local emissions, EC became the most important contributor, accounting for around 40% of the total extinction (CitationCheng et al., 2008). Relative humidity (RH) is also a key parameter governing the aerosol optical properties. Under ambient conditions, aerosol hygroscopic growth with the increase of RH may result in the increase of the aerosol size and decrease of the real part of the aerosol refractive index. The hygroscopic behavior of aerosols exhibits a hysteresis. A pure salt particle (e.g., (NH4)2SO4) exposed to increasing RH will undergo an abrupt change from a solid particle to a droplet at a particular RH (in a process referred to as deliquescence) that is specific to its chemical composition.
A number of filter-based samplings were conducted in the south of China to study the water-soluble compositional spectra in the past (Wu, 2006, Citation2001, 1995, Citation1994; CitationXia, 2007), and some observational studies have also been performed in recent years on carbonaceous aerosol (CitationSun, 2008), and on the effect of chemical composition of PM2.5 on visibility in Guangzhou (Tao et al., 2007), but these observations were often short term, just maintained for 1 month; the results from short-term observations do not have enough persuasiveness, especially for explaining the visibility problem. In order to understand more thoroughly the present pollution level of the PRD against the background of rapid urbanization, it is necessary to learn more about the chemical compositions of atmospheric aerosol over the closely located cities over the PRD, with particular efforts on the extinction contributions of the secondary aerosol. This paper investigates the characterizations of secondary aerosol and its extinction effects on visibility over the Pearl River Delta Region, China, by using 9-month data.
Method and Data
Collected filter samples of atmospheric aerosol are weighed and analyzed for the mass concentration and chemical constituents. A sampling program has been conducted once every 6 days atop the operational building (about 70 m above ground) of Guangdong Meteorological Bureau (longitude 113° 16′ 60′′, latitude 23° 07′ 00′′, altitude 90 m above sea level), Guangzhou, since July 2007, in joint efforts with the Hong Kong University of Science and Technology (HKUST); each sample was collected for 24 hr. In total, 42 sets of filters have been secured by March 2008, amounting to 5 sets of measurements per month except for July 2007, for which there are only 2 sets of samples. The sampled PM is PM2.5. The samples were weighed and chemically analyzed at HKUST. For the chemical constituent analysis, water-soluble sulfate, nitrate, ammonium and sea salt, and carbonaceous aerosol are the main target species, concentrations of which are measured using ion chromatography and a thermal optical transmittance (TOT) carbon analysis method. The extinction effects on visibility by different constituents are intensively studied in this work using compositional data derived from the measurements, with special efforts on examining the extinction of secondary aerosol and the enrichment and extinction contributions of the constituents with the variations of pollution level and relative humidity. The visual range data from a visibility sensor (instrument: Belfort 6000) are used to evaluate the calculated visual range using the IMPROVE method, so as to provide a scientific basis for the mitigation of atmospheric aerosol pollution and visibility in the PRD.
Characteristics of Compositional Spectra of Atmospheric Aerosol over PRD
Primary and secondary organic carbon (POC and SOC) and OC/EC ratio
Owing to good stability, EC does not transform chemically in the atmosphere and is thus often used as a tracer for combustion sources. According to CitationCastro et al., 1999, the minimum of the OC/EC ratio for the sampling site can be used as the threshold to compute SOC, that is, SOC = OCtotal – (OC/EC)minimum × EC. As shown in , the ratio of (OC/EC)minimum is 2.06. It is then estimated that in the OC observed for this work, POC is about twice as much as EC, while the remaining is SOC. As a result, the contributions of POC and SOC can then be estimated roughly. As the masses of sulfate, nitrate, and ammonium have already been measured experimentally, the amount of secondary aerosol, is then calculated to be the sum of sulfate, nitrate, ammonium, and SOC.
Figure 1. Monthly variation of the ratio of OC to EC in July 2007 - March 2008.
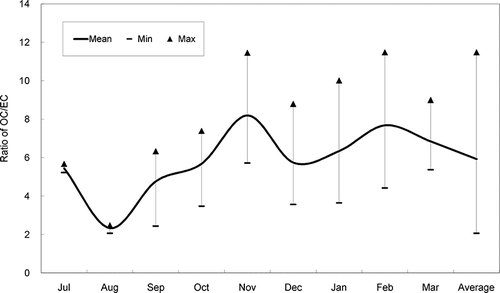
As shown in , the ratio of OC to EC is always larger than 2, with the highest monthly mean (7.6) and maximum value (11.5) in November and mean minimum (2.3) in August; the ratio is relatively small in August; the OC/EC is noted to be slightly higher in autumn, winter, and spring than in summer. This indicates that SOC forms more significantly in the former three seasons than in summer. In summer, despite more intense photochemical radiation, there is significantly less large-scale formation of SOC, something that may have close links with the concentrations of the precursors, which are much lower in summer (summer is the monsoon season in the PRD region, and the air mass is mostly from clean ocean). The seasonal feature (in 2007–2008) of OC/EC differs very much from the analysis of CitationCastro et al. (1999). The OC/EC observed in this study changes in the range of 2–8 on average with an overall mean of 6.5, which is comparable with both the one measured for the PRD (CitationLiu et al., 2002) and the one taken for Lin'an and Shandianzi (CitationYan, 2007), while being much higher than those reported for many other Chinese cities (CitationHo et al., 2003; Yu et al., 2004) and the observations for the PRD winter (CitationCao et al., 2003, Citation2004; CitationZheng et al., 2006). According to CitationCao et al. (2003), the winter OC/EC ratio for PRD varies mainly between 1.63 and 2.7, averaging 2.40, comparable with the Beijing mean of 2.64 (CitationHe et al., 2001, Citation2003; CitationDan et al., 2003) and the Shanghai mean of 2.33 (CitationYe et al., 2003). The reasons why the OC/EC values are much higher than in other research are maybe that on the one hand, the OC is increased and EC decreased during recent years in the PRD region (CitationGuangdong Provincial Meteorological Bureau, 2011); on the other hand, the differences are closely related with the time and location where the samples are taken and how the operationally-defined EC and OC are determined.
Compositional data of atmospheric aerosol and secondary aerosol abundance
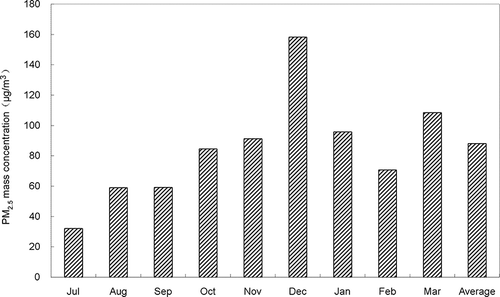
presents the monthly variation of mass concentration of PM2.5 from July 2007 to March 2008. It shows that the maximum appears in December with a mean of 161 µg/m3 and the minimum occurs in July with an average of 32 µg/m3. By comparison, the mass concentration of PM10 varies between 70 µg/m3 and 234 µg/m3 for the PRD, and the winter mean PM2.5 is as high as 200 µg/m3 (CitationCao et al., 2003), and the autumn mean PM2.5 about 100 µg/m3 (CitationAndreae et al., 2008), with PM2.5 taking up PM10 by more than 58%, for Guangzhou. The results in the literature are generally in agreement with those of the present study.
Figure 2. Monthly variation of PM2.5 mass concentration in July 2007 - March 2008.
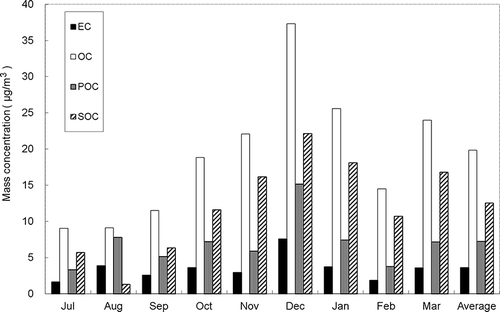
shows the monthly variation of the mass concentration of EC and OC for the time from July 2007 to March 2008. They vary between 1.7 µg/m3 and 7.6 µg/m3 and between 9.1 µg/m3 and 37.3 µg/m3, respectively, with the mean of 3.6 µg/m3 and 19.8 µg/m3, respectively; they amount to 3–9% and 20–28% of the PM2.5 mass, averaging 4.8% and 23.4%, respectively. The maximum EC and OC concentrations occur in December 2007, being 7.6 µg/m3 and 37.3 µg/m3, respectively, and taking up 5% and 24% of the PM2.5 mass, respectively; the minimum EC and OC concentrations occur in July 2007, being 1.7 µg/m3 and 9.1 µg/m3, respectively, and taking up 5% and 28% of the PM2.5 mass, respectively. For the mass concentration, the SOC varies between 1.3 µg/m3 and 18.1 µg/m3 and the POC between 3.3 µg/m3 and 15.1 µg/m3, with the mean being 12.6 µg/m3 and 7.3 µg/m3, respectively, taking up 3% to 18% and 6% to 18% of the PM2.5 mass, with the average being 13.7% and 9.6%, respectively. Except for August, the mass concentration of SOC is all larger than that of POC.
Figure 3. Monthly variation of the mass concentration of EC and OC in July 2007 - March 2008.
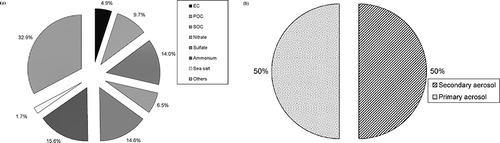
gives the mean constituents of PM2.5 aerosol and the mass weight of secondary aerosol. It shows that on average, POC, SOC, EC, SO4 2- (sulfate), NO3 − (nitrate), NH4 + (ammonium), NaCl (sea salt), and other unmeasured components take up 10%, 14%, 5%, 15%, 7%, 15%, 2%, and 32%, respectively; the mass quota of secondary aerosol takes up about 50% of the total mass of PM2.5. It is noted that the sum of carbonaceous aerosol (OC + EC) is always larger than sulfate + nitrate in every month; the level of SOC is comparable with that of sulfate, the concentration of sulfate is much larger than that of nitrate in most of the months, and ammonium and other unmeasured components also have larger weight.
Figure 4. (a) The mean constituents of PM2.5 aerosol. (b) The mass percentage of secondary aerosol.
Enrichment of secondary aerosol in relatively clean and polluted environment
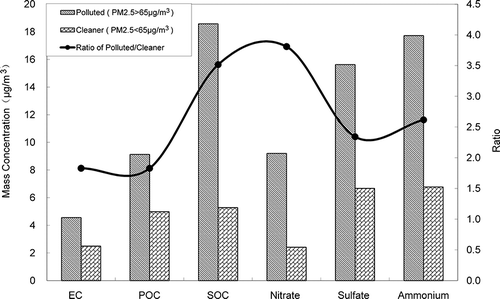
“Relatively polluted” and “relatively clean” when specified are relative to daily averages of PM2.5 > 65 µg/m3 and PM2.5 < 65 µg/m3, respectively. gives the contrast of OC/EC for the time from July 2007 to March 2008. It is clear that the OC/EC ratio is much larger in relatively polluted situation than in relatively clean one. Higher levels of OC/EC suggest higher OC aerosol generated through secondary reaction, as shown in many previous studie (CitationGray and Gass, 1986; CitationTurpin and Huntzicker, 1995; CitationChow et al., 1996; CitationCastro et al., 1999). There is, therefore, relatively significant enrichment of SOC against the background of pollution, as suggested by association of a higher ratio of OC/EC in relatively polluted situation. gives the comparison between secondary aerosols (SOC, nitrate, sulfate, and ammonium) and primary aerosol (EC, POC) with relatively polluted and clean environment from July 2007 to March 2008. It shows that the secondary aerosol is more significantly enriched than the primary aerosol, and the enrichment is the most significant with SOC and nitrate when there is pollution.
Figure 5. The OC/EC ratio in relatively polluted and clean environment in July 2007 - March 2008.
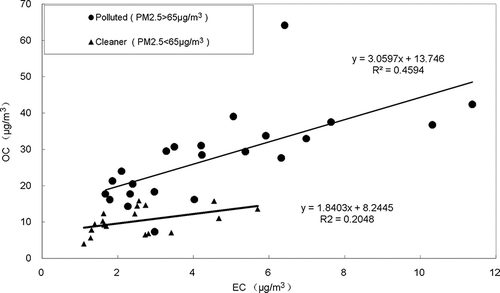
Figure 6. The comparison of the secondary aerosol (SOC, nitrate, sulfate and ammonium) with primary aerosol (EC and POC) in relatively polluted and clean environment in July 2007 - March 2008.
While previous work pays much attention to the constituents of sulfate as the secondary aerosol (CitationZhang and Han, 2003; CitationZhang et al., 2004; CitationTian et al., 2005; CitationWu et al., 1995), carbonaceous aerosol, especially SOC, is a very acute problem, as shown in the latest observations of this study, because SOC and nitrate are very much enriched in the relatively polluted situation.
Aerosol Constituents Spectra and Extinction Quota of Secondary Aerosol in Dry and Wet Conditions Over PRD
The following equation set forth in IMPROVE can be used to obtain the extinction effect of aerosol constituents on visibility (CitationMalm et al., 1994; CitationSisler and Malm, 1994):
In Equationeq 1, [OMC] = 1.4([POC] + [SOC]), [CM] is sea salt, [others] is dust and soil, and 10 is the extinction from gas molecules. As these hygroscopic factors are absent in the PRD data, f(RH) ≈ 1.0, f(RH) ≈ 3.0, and f(RH) ≈ 6.0 for dry and for high relative humidity of RH = 80% and RH = 95%, respectively, are used here in our work based on IMPROVE monitoring network; the extinction contribution of secondary aerosol with varying humidity and chemical compositions is discussed based on Equationeq 1 and the preceding three assumptions for relative humidity.
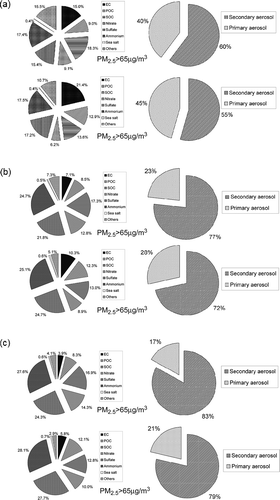
gives the extinction percentages of mean constituents and secondary aerosol with varying hygroscopic growth for dry, RH = 80%, and RH = 95%. It shows that in the dry environment, the extinction weight is in a shape much different from that of the mass concentration (), which may be attributed to the difference in the extinction capabilities of various constituents, as shown in Equationeq 1. The cross section of extinction for unit mass of such species as (NH4)2SO4, NH4NO3, OMC, EC, soil, and CM is 3 m2/g, 3 m2/g, 3 m2/g, 10 m2/g, 1 m2/g, and 0.6 m2/g, respectively. It can be seen that black carbon's extinction increases by 10-fold relative to mass concentration, while the extinction of organic matter, sulfate, nitrate, and ammonium grows by threefold, making the latter species the main players during the extinction in dry environment. In the wet environment, however, as their hygroscopic growth is generally larger than unit mass of extinction cross section at RH > 80% as shown in IMPROVE experiments, these species have extra increment of extinction quota. On average, the contribution weight is 10%, 17%, 17%, 16%, 8%, 18%, 0.4%, and 14%, respectively for POC, SOC, EC, sulfate, nitrate, ammonium, sea salt, and other crust elements, in the dry environment. Compared with the weight of mass concentration, carbonaceous aerosols, especially SOC and EC, gain some of the percentage contributions to, while sea salt and other unmeasured species have lower percentage contributions. The extinction contribution is about 59% for secondary aerosol, a gain of about 9% over the mass-based percentage. In the wet environment, the extinction contributions of sulfate, nitrate, and ammonium increase dramatically, being as high as 75% and 82% at RH = 80% and RH = 95%, respectively. It is then clear that secondary aerosol plays a dominant role in both mass concentration and extinction, particularly so in environments high relative humidity, when it comes to the environmental issue for the PRD.
Figure 7. The extinction percentages of mean constituents and secondary aerosol of PM2.5 with varying relative humidity. (a) Dry condition. (b) RH = 80%. (c) RH = 95%.

shows that in the relatively polluted and dry environment, the extinction contribution of secondary aerosol is already 60%; it rises to 77% and 83% at RH = 80% and RH = 95%, respectively; the extinction contribution is 5% more in a relatively polluted than in a relatively clean environment. The pattern of the extinction percentages from eight species categories had little change in the polluted and clean environments. Compared with , there is a large difference in the mass concentrations of secondary aerosol in the polluted and clean environments. So, comparing the polluted and clean environments, there are large differences in mass concentrations and extinction coefficients, but little change in the contributions from different species to the extinction coefficients. It is apparent that secondary aerosol poses a more acute pollution problem when the environment is relatively polluted.
Figure 8. The extinction percentages of mean constituents spectra and secondary aerosol in relatively polluted and relatively clean conditions. (a) Dry condition. (b) RH = 80%. (c) RH = 95%.
gives the extinction coefficients and the hygroscopic growths of the extinction coefficient and scattering coefficient with varying relative humidity in July 2007 to March 2008. The extinction coefficient is calculated using Equationeq 1 and the scattering coefficient is the major part of the extinction coefficient without the absorption coefficient from EC. In general, the monthly distribution of the extinction coefficient is very similar in shape to that of mass concentration (), with the maximum in December (403 Mm−1, dry environment) and the minimum in July (85 Mm−1, dry environment). The extinction coefficient increases significantly with the growth of relative humidity, and the hygroscopic growth of the extinction coefficient is slightly smaller than that of scattering coefficient, which is because the extinction coefficient includes the EC, which is hydrophobic. On average, the hygroscopic growth is 2.1 and 2.3 (RH = 80%) and 3.4 and 3.8 (RH = 95%) for the extinction and scattering coefficients, respectively. The largest increments of the extinction coefficient are found in September and October, with the maximum hygroscopic growth being 2.3 and 2.6 (RH = 80%) and 3.9 and 4.5 (RH = 95%), respectively. Estimates of the hygroscopic effect show that there could be four or two times the increase in the extinction and scattering coefficients with high relative humidity (about 95%) or low relative humidity (about 80%), respectively.
Figure 9. (a) The extinction coefficients and (b) the hygroscopic growths of the extinction coefficient and scattering coefficient with varying relative humidity in July 2007 - March 2008.
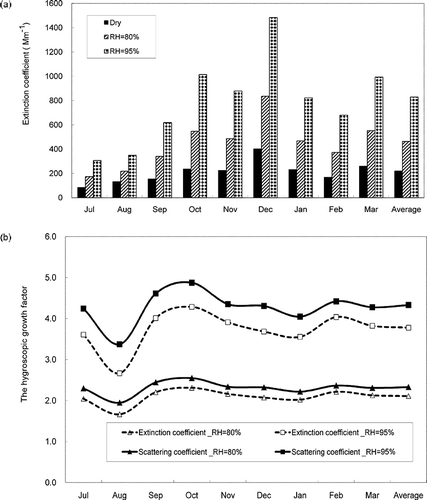
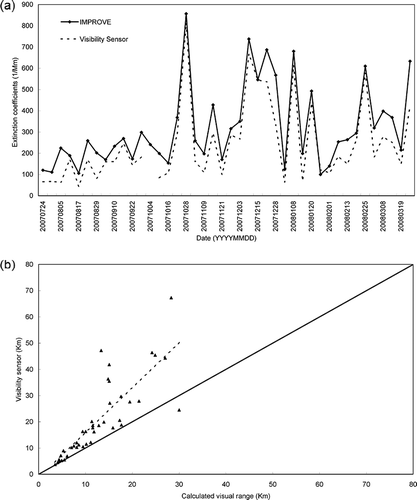
Figure 10 gives the comparisons of extinction coefficient and visual range between measurements by the visibility sensor (Belfort 6000) and calculation using IMPROVE with Equationeq 1. shows the variations of the trend of the two data sets are similar. Several maximum values of extinction coefficients matched well, but almost all calculated extinction coefficients are larger than the measured values (see ). The differences between the data sets are smaller when the visual range is less than 15 km, and the errors become larger (see ) when the measured visual range is large than 15 km. The reasons may be the following: On one hand the measured visual range large than 15 km is hard to believe due to the principle of the Belfort 6000 visibility sensor; on the other hand, when the air is clean the measurements based on filter samples are also associated with a higher degree of uncertainty. The analysis shows that when the visual range is less than 15 km, the IMPROVE Equationeq. 1 only can be referenced in the PRD region; the equation gives a higher extinction coefficient (lower visual range) with relative error about 5–40% compared with the visibility sensor. When the visual range is large than 15 km, there is not adequate data to evaluate the usability of the IMPROVE Equationeq. 1 with relative error up to about 20–70%. The reason maybe that the mass extinction efficiencies(MEE), mass scattering efficiencies (MSE), and hygroscopic growth factors set in Equationeq. 1 based on IMPROVE experiments are not applicable in PRD.
Figure 10. (a) The comparisons of extinction coefficient and (b) visual range between visibility sensor and calculation using IMPROVE Equationequation (1).
As indicated from the preceding analysis, the secondary aerosol accounts for more than 50% of PM2.5 in terms of mass, its extinction contribution is greater than 55%, and the aerosol is much enriched in relatively polluted conditions; if the humidity effect is taken into account, its mass and extinction contribution will have larger percentages. As shown in the latest studies (CitationWu et al., 2006, Citation2007; CitationDeng, 2008), the ratio of mass concentration (PM1/PM2.5) of aerosol in PRD is higher than 0.86 on average; particles smaller than 1 µm are in the absolute majority, with the group of particles (0.25 ≤ D ≤ 1 μm) taking up more than 99.4% of the particles total (D > 0.25 μm) and its medium diameter standing at 0.3 μm only. Therefore, it suffices to say that the aerosol pollution in the PRD is mainly caused by the secondary aerosol particles that are smaller than 1 μm in diameter, or even much smaller than that.
Summary
For the mean chemical composition of the aerosol, the mass quota is 10% for POC, 14% for SOC, 5% for EC, 15% for sulfate, 7% for nitrate, 15% for ammonium, 2% for sea salt, and 32% for other unmeasured species; the ratio of OC/EC is larger than 2, with obvious characteristics of SOC formation; and the mass contribution of secondary aerosol takes up about 50% of PM2.5.
Carbonaceous aerosol (OC + EC) is found at levels greater than sulfate and nitrate combined in each of the months; while the SOC is comparable with sulfate for most of the months, sulfate is greater than nitrate. On the relatively more polluted days (PM2.5> 65 μg/m3), there is much enrichment of secondary aerosol, and carbonaceous aerosol, especially SOC, poses an acute problem, since SOC and nitrate are much enriched in relative pollution.
On average, the extinction contribution is about 59% in the dry environment and the extinction quota can be as high as 75% for RH = 80% and 82% for RH = 95%, respectively; there is a 5% increase of the extinction contribution by secondary aerosol in the relatively polluted situation as compared with the relatively clean conditions, indicating that secondary aerosol makes a larger extinction contribution with the relatively polluted conditions.
The equation set forth in the IMPROVE experiments can only be referenced to evaluate the extinction effect of aerosol compositional spectra on visibility in the PRD region; the equation gives a higher extinction coefficient (i.e., lower visual range) with a high relative error. How to set the appropriate mass extinction efficiencies (MEE), mass scattering efficiencies (MSE), and hygroscopic growth factors is still challenging in the PRD region.
Acknowledgment
This paper has been jointly supported by projects from the National Natural Science Foundation of China (numbers 41175117, 40875090, 40418008), the National Basic Research Program of China (973 Program, number 2011CB403400), China Meteorological Special Research (number GYHY201106050), Guangdong Provincial Science and Technology project (number GYHY201306042, 2010A030200012), and Science and Technology Innovation Team Plan of Guangdong Meteorological Bureau (number 201103).
References
- Andreae , M.O. , Schmid , O. , Yang , H. , Yu , J.Z. and Zhang , Y.H. 2008 . Optical properties and chemical composition of the atmospheric aerosol in urban Guangzhou China . Atmos. Environ. , doi: 10.1016/j.atmosenv.2008.01.030
- Cao , J.J. , Lee , S.C. Ho , K.F. 2003 . Characteristics of carbonaceous aerosol in Pearl River Delta Region, China during 2001 winter period . Atmos. Environ. , 37 : 1451 – 1460 . doi: 10.1016/j.atmosenv.2008.01.030
- Cao , J.J. , Lee , S.C. Ho , K.F. 2004 . Spatial and seasonal variation of atmospheric organic carbon and elemental carbon in Pearl River Delta region, China . Atmos. Environ. , 38 : 4447 – 4456 . doi: 10.1016/j.atmosenv.2008.01.030
- Castro , L.M. , Pio , C.A. , Harrison , R.M. and Smith , D.J.T. 1999 . Carbonaceous aerosol in urban and rural European atmospheres: Estimation of secondary organic carbon concentrations . Atmos. Environ. , 33 : 2771 – 2781 . doi: 10.1016/j.atmosenv.2008.01.030
- Cheng , Y.F. , Wiedensohler , A. Eichler , H. 2008 . Aerosol optical properties and related chemical apportionment at Xinken in Pearl River Delta of China . Atmos. Environ. , 42 : 6351 – 6372 . doi: 10.1016/j.atmosenv.2008.01.030
- Cheung , H.C. , Wang , T. , Baumann , K. and Guo , H. 2005 . Influence of regional pollution outflow on the concentrations of fine particulate matter and visibility in the coastal area of southern China . Atmos. Environ. , 39 : 6463 – 6474 . doi: 10.1016/j.atmosenv.2008.01.030
- Chow , J.C. , Ouchida , P. , Jones , M. and Prasad , S. 1996 . Descriptive analysis of PM2.5 and PM10 at regionally representative locations during SJVAQS/AUSPEX . Atmos. Environ. , 30 : 2079 – 2112 . doi: 10.1016/j.atmosenv.2008.01.030
- Dan , M. , Zhuang , G. , Li , X. , Tao , H. and Zhuang , Y. 2003 . The characteristics of carbonaceous species and their sources in PM2.5 in Beijing . Atmos. Environ. , 38 : 3443 – 3452 . doi: 10.1016/j.atmosenv.2008.01.030
- Debell, L.J., K.A. Gebhart, W.C. Malm, et al. 2006. Spatial and seasonal patterns and temporal variability of hazy and its constituents in the United States: Report IV. http://vista.cira.colostate.edu/improve/Publications/Reports/2006/2006.htm (http://vista.cira.colostate.edu/improve/Publications/Reports/2006/2006.htm)
- Deng , X.J. 2008 . The aerosol characterizations and its impacts on visibility and surface ozone in the Pearl River Delta Region (PRD) , PhD thesis of Physical School of Peking University. (in Chinese) . doi: 10.1016/j.atmosenv.2008.01.030
- Deng , X.J. , Tie , X.X. Wu , D. 2008 . “ Long-term trend of visibility and its characterizations in the Pearl River Delta Region (PRD), China ” . In Atmos. Environ doi: 10.1016/j.atmosenv.2008.01.030
- Gray , H.A. and Gass , G.R. 1986 . Characteristics of atmospheric organic and elemental carbon particle concentrations in Los Angeles . Environ. Sci. Technol. , 20 : 580 – 589 . doi: 10.1016/j.atmosenv.2008.01.030
- Guangdong Provincial Meteorological Bureau . 2011 . Guangdong Atmospheric Component Bulletin doi: 10.1016/j.atmosenv.2008.01.030
- He , K. , Yang , F. Ma , Y. 2001 . The characteristics of PM2.5 in Beijing, China . Atmos. Environ. , 35 : 4959 – 4970 . doi: 10.1016/j.atmosenv.2008.01.030
- He , Z. , Kim , Y.J. Ogunjobi , K.O. 2003 . Carbonaceous aerosol characteristics of PM2.5 particles in Northeastern Asia in summer 2002 . Atmos. Environ. , 38 : 1795 – 1800 . doi: 10.1016/j.atmosenv.2008.01.030
- Ho , K.F. , Lee , S.C. Chan , C.K. 2003 . Characterization of chemical species in PM2.5 and PM10 aerosols in Hong Kong . Atmos. Environ. , 37 : 31 – 39 . doi: 10.1016/j.atmosenv.2008.01.030
- Jung , J. , Lee , H. Kim , Y.J. 2009 . Optical of atmospheric aerosols obtained by in situ and remote measurements during 2006 campaign of Air Quality Research in Beijing (CAREBeijing-2006) . J. Geophys. Res. , 114 : D00G02 doi: 10.1016/j.atmosenv.2008.01.030
- Liu , X.M. , Shao , M. , Zeng , L.M. and Zhang , Y.H. 2002 . Study on EC and OC compositions of ambient particles in Pearl River Delta Region . Chin. J. Environ. Sci. , 23 : 54 – 59 . in Chinese doi: 10.1016/j.atmosenv.2008.01.030
- Malm , W.C. , Sisler , J.F. Huffman , D. 1994 . Spatial and seasonal trends in particle concentration and optical extinction in the United States . J. Geophys. Res. , 99 : 1347 – 1370 . doi: 10.1016/j.atmosenv.2008.01.030
- Pitchord , M. , Malm , W. Schichtel , B. 2007 . Revised algorithm for estimating light extinction from IMPROVE particle speciation data . J. Air Waste Manage. Assoc. , 57 : 1326 – 1336 . doi: 10.1016/j.atmosenv.2008.01.030
- Sisler , J.F. and Malm , W.C. 1994 . The relative importance of soluble aerosols to spatial and seasonal trends of impaired visibility in the United States . Atmos. Environ. , 28 : 851 – 862 . doi: 10.1016/j.atmosenv.2008.01.030
- Sun , X. 2008 . Analyses of aerosol OC/EC spectra of haze process in Guangzhou , Master's thesis, Atmospheric Department of Sun Yat-sen University, Guangzhou, China. (in Chinese) . doi: 10.1016/j.atmosenv.2008.01.030
- Tao , J. , Ho , K.F. Chen , L.G. 2009 . Effect of chemical composition of PM2.5 on visibility in Guangzhou, China, 2007 spring . Particuology , 7 : 68 – 75 . doi: 10.1016/j.atmosenv.2008.01.030
- Tian , H. , Ma , J.Z. , Li , W.L. and Liu , H.L. 2005 . Simulation of forcing of sulfate aerosol on direct radiation and its climate effect over middle and eastern China . Q. J. Appl. Meteorol. , 16 : 322 – 333 . in Chinese doi: 10.1016/j.atmosenv.2008.01.030
- Turpin , B.J. and Huntzicker , J.J. 1995 . Identification of secondary organic aerosol episodes and quantification of primary and secondary organic aerosol concentrations during SCAQS . Atmos. Environ. , 29 : 3527 – 3544 . doi: 10.1016/j.atmosenv.2008.01.030
- Wang, T. 2003. Study of visibility and its causes in Hong Kong. Final report to the Environmental Protection Department of Hong Kong, Ref. AS01-286. http://www.epd.gov.hk/epd/english/environmentinhk/air/studyrpts/files/study_of_ visibility_reduction_and_its_causes_in_hk.pdf (http://www.epd.gov.hk/epd/english/environmentinhk/air/studyrpts/files/study_of_ visibility_reduction_and_its_causes_in_hk.pdf)
- Wu , D. and Chen , W.C. 1994 . Intra annual variation features of mass distribution and water-soluble composition distribution of aerosols over Guangzhou . Sci. Atmos. Sin. , 52 : 499 – 505 . in Chinese doi: 10.1016/j.atmosenv.2008.01.030
- Wu , D. , Tie , X. and Deng , X.J. 2006 . Chemical characterizations of soluble aerosols in southern China . Chemosphere , 64 : 749 – 757 . doi: 10.1016/j.atmosenv.2008.01.030
- Wu , D. , Huang , H.H. and Deng , X.J. 2001 . The physical and chemical features of water-soluble composition of graded aerosols in the surface-layer over Huangpu industrial area in Guangzhou . Acta Meteorol. Sin. , 59 ( 2 ) : 213 – 219 . in Chinese doi: 10.1016/j.atmosenv.2008.01.030
- Wu , D. , Gan , C.L. and He , Y.H. 1995 . The distribution feature of giant particles of sulfate in Guangzhou during summer . Meteorol. Monthly , 21 : 44 – 46 . in Chinese doi: 10.1016/j.atmosenv.2008.01.030
- Wu , D. , Bi , X.Y. Deng , X.J. 2007 . Effect of atmospheric haze on the deterioration of visibility over the Pearl River Delta . Acta Meteorol. Sin. , 21 : 215 – 223 . doi: 10.1016/j.atmosenv.2008.01.030
- Xia , D. 2007 . Analyses of aerosol mass and soluable compositional spectra in Guangzhou , Master's thesis, Atmospheric Department of Sun Yat-sen University, Guangzhou, China. (in chinese) . doi: 10.1016/j.atmosenv.2008.01.030
- Yan , P. 2007 . Study on aerosol optical properties at background region in eastern China. PhD thesis , Beijing , , China : Physical School of Peking University . in Chinese doi: 10.1016/j.atmosenv.2008.01.030
- Ye , B. , Ji , X. Yang , H. 2003 . Concentration and chemical compositon of PM2.5 in Shanghai for a 1-year perio . Atmos. Environ. , 37 : 499 – 510 . doi: 10.1016/j.atmosenv.2008.01.030
- Yu , J.Z. , Tung , J.W. Wu , A.W.M. 2003 . Abundance and seasonal characteristics of elemental and organic carbon in Hong Kong PM10 . Atmos. Environ. , 38 : 1511 – 1521 . doi: 10.1016/j.atmosenv.2008.01.030
- Zhang , M.G. and Han , Z.W. 2003 . A numerical study on distribution of sulfate, nitrate and ammonium aerosols over East Asia during the TRACE-P Campaign . Plateau Meteorol. , 22 : 1 – 6 . in Chinese doi: 10.1016/j.atmosenv.2008.01.030
- Zhang , M.G. , Xu , Y.F. , Itsushi , U. and Hajime , K. 2004 . A study of sulfur transport and transformation over East Asia in the springtime. I. Model system and its verification . Chin. J. Atmos. Sci. , 28 : 321 – 329 . in Chinese doi: 10.1016/j.atmosenv.2008.01.030
- Zheng , M. , Gayle , S. Hagler , W. 2006 . Composition and sources of carbonaceous aerosols at three contrasting sites in Hong Kong . J. Geophys. Res. , 111 : D20313 doi: 10.1016/j.atmosenv.2008.01.030