Abstract
Size segregated suspended particulate matter (PM2.5 and PM2.5-10) were collected using Gent low-volume air sampler at four different receptor site-classes in Lagos Mega City, Nigeria. The particulate mass loading was quantified and the concentration was analyzed to examine the pattern and variation from one receptor site-class to another. The PM2.5/PM10 ratio varied among the site-classes with the residential and marine sites having the least and highest ratio of 0.31± 0.13 and 0.49 ± 0.17 respectively. Particulate loading was higher on weekdays than on weekends (by a factor of about 1.5) in all but the marine site-class.The mean PM2.5/PM10 ratio is 0.41 ± 0.15, which suggests that traffic emission is not the principal source of the Particulate Matter (PM). The INAA assay of the particulates detected ten elements: As, Br, Ce, K, La, Mo, Na, Sb, Sm and Zn. Except for Br, Mo and Sb, the detected elements were more pronounced in the coarse-fractioned filter. Principal Component Factor Analysis (PCFA) of the detected elements identified some common sources (traffic-related, traffic emission, sea-salt and industrial emission) for both PM fractions at the four receptor site-classes.
An assessment of the ambient air quality of the study area has been carried out. Some residential areas can have high particulate matter (PM) loading even more than industrial areas due to contributions from local and transport from neighboring sites. The site-classes have common PM sources and PM loadings are generally lower on weekends than on weekdays, with the coarse fraction being dominant. Measures should be put in place to reduce contributions to PM loading by biomass burning, traffic-related, and industrial emissions, as they have been identified as common and prominent anthropogenic sources of PM.
Introduction
Primary particulate matters are emitted into ambient air by anthropogenic and natural processes. Anthropogenic processes include combustion from car engines, solid fuel (coal and biomass), household combustion, industrial activities, erosion of paved and unpaved roads, abrasion of brakes and tires, and mines. Secondary particles are formed in the air, usually by chemical reactions of gaseous pollutants. These particles are products of atmospheric transformation of nitrogen oxides, mainly emitted by traffic and some industrial processes, and sulfur dioxide resulting from the combustion of sulfur-containing fuels. These particles are mostly found in the fine fraction (CitationWorld Health Organization [WHO], 2005). PM2.5 are particulate matters with aerodynamic diameter d ae < 2.5 μm, PM2.5–10 with 2.5 ≤ d ae ≤ 10 μm, and PM10 with d ae < 10 μm.
Studying ambient airborne particulate matter (PM) is of utmost importance because of the serious health implications it has on humans. It has been established in various studies and that the inhalable fractions, PM1 and PM2.5, can penetrate deep into the lung and alveoli (CitationDockery et al., 2000; CitationPope and Dockery, 2006; CitationHopke et al., 2006). PM also has the potential to contribute significantly to climate change and visibility (CitationArya, 1999; CitationQuality of Urban Air Review Group [QUARG], 1996; CitationCharlson et al., 1992; CitationIntergovernmental Panel on Climate Change [IPCC], 2001).
In an earlier study in similar receptor sites in Lagos, the PM concentrations were higher than the 150 μg/m3 set by the United States National Ambient Air Quality Standards (NAAQS) by factors of 2–4, except for one of the residential sites with a value of 18 μg/m3 (CitationObioh et al., 2005). The authors reported that PM concentrations in Lagos varied between 150 and 240 μg/m3 for PM2.5 and between 370 and 600 μg/m3 for PM10. The assay of the samples carried out with total reflection X-ray fluorescence (TXRF) detected Fe, Ca, K, V, Cr, Cu, Zn, Se, Br, Sr, and Pb. CitationOluyemi and Asubiojo (2001) reported 15 elements, viz. Si, Al, Ti, Fe, V, Ca, K, Na, Cl, Mn, Br, Mg, S, Pb, and Zn, determined by a combination of wave-dispersive X-ray fluorescence (WDXRF) and atomic absorption spectroscopy (AAS). The concentration of the elements ranged between 10 and 2310 ng/m3 at the various sites. Prominent among sources identified with the ranges of their contributions at the sites were soil 35–54%, marine 26–34%, automobile exhaust 0.3–3.5%, refuse incineration 2–3%, and regional sulfate 2–12%.
Lagos has a population density of about 2500 persons/km2 and 70% of the nation's industrial and commercial activities take place in Lagos (CitationTaiwo, 2005; CitationOlowoporoku, 2007). Virtually all of the industries’ power supplies come from heavy-duty diesel-powered generating sets. About 40% of all new vehicle registrations and total fuel consumption in Nigeria takes place in Lagos. There are about 2600 km of roads in Lagos that are frequently congested, with over 1 million vehicles (petrol and diesel powered) plying the roads on a daily basis. The decay in infrastructures and lack of adequate planning contribute greatly to air pollution in the recently classified Mega-City (CitationItua, 2006). The poor road network and obstructions coupled with the huge volume of traffic and the resultant traffic jam often result in increased emission of elemental and organic carbon, resuspended soil dust, brake and clutch lining, nitrogen oxides, and other traffic-related particulates (CitationVardoulakis et al., 2003; CitationLaschober et al., 2004; CitationBocca et al., 2006; CitationSalma and Maenhaut, 2006; CitationAmato et al., 2009). Hence, there is the need for an adequate and up-to-date investigation of the quantity and sources of ambient airborne PM; especially PM2.5 in the city considering its serious health implications.
In this study, the fine and coarse fractions of the PM were simultaneously sampled. The variation and trend (weekdays and weekend) of the mass concentrations of these particulate fractions were examined. The elemental characterization of the PM samples was carried out with instrumental neutron activation analysis (INAA) and the mean concentration of the elements was determined in all the samples from the entire sampling campaign. Possible sources of PM2.5 and PM2.5–10 were identified by principal component factor analysis (PCFA) using the maker elements for such sources.
Experimental
Study area
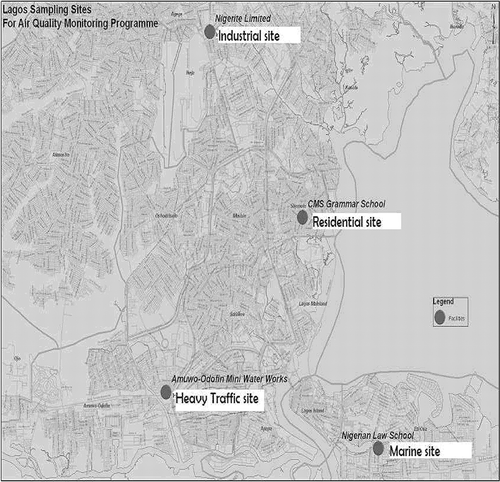
The receptor sites selected for sampling, as shown in , are Amuwo-Odofin Mini Water Works premises, Mile 2 (6.28°N, 3.19°E and 55 ft above sea level); sea food market (Law School), Victoria Island (6.26°N, 3.26°E and 44 ft above sea level); C.M.S Grammar School, Bariga (6.32°N, 3.23°E and 125 ft above sea level); and Oba Akran Road (Nigerite Limited), Ikeja (6.36°N, 3.20°E and 135 ft above sea level).
Figure 1. Map showing the entire study area and the actual sampling points.
Mile 2 is a four-lane highway that links Nigeria to other West African countries and Vitoria Island is a marine environment near the Atlantic Ocean as well as the Lagos lagoon. Victoria Island witnesses high volume of traffic during specific hours of the day. Bariga is a densely populated residential area. It experiences moderate volume of traffic most hours of the day. Oba Akran Road is predominantly an industrial axis with a concentration of varying classes of industries. These sites were selected because of differential impact from predominant source types expected to be reflected in the concentrations and ratios of the two particle size fractions.
Sampling
Samples of fine (PM2.5) and coarse (PM2.5–10) airborne particulate matter were collected on Nuclepore polycarbonate filters using the low-volume Gent air sampler (CitationHopke et al., 1997). This sampler was equipped with a Norwegian Institute for Air Research (NILU) stacked filter unit (SFU). The SFU carried, in different stages, two 47-mm filters with 8 and 0.4 μm pore sizes for the coarse and fine fractions, respectively. Sampling was done at the rate of 15–16 L/min, and at this rate, the unit should act as a dichotomous sampler. Airflow through the 8-μm pores will result in collection of particles with aerodynamic diameter (d ae) of 2.2 μm (approximate) with 50% efficiency. Particles with d ae < 2.2 μm are then collected on the 0.4-μm filter (CitationCahill et al., 1979).
Forty samples each of PM2.5 and PM2.5–10 were collected at the selected locations. Sampling took place twice every fortnight from February through October 2010 between 7:00 a.m. and 7:00 p.m. irrespective of the prevailing atmospheric conditions and human activities. Sampling heights were kept at 1.7 m from ground level, with the filter holder held face down to avoid passive dust loading. The sampler was cited downwind and such that it was free from direct contact with the would-be sources of pollutants or some form of shielding that might prevent free circulation of air.
The used filter papers were folded into two, with the loaded side facing inward to prevent particle losses. The filters were then stored in well-labeled polythene bags in desiccators with the polythene bags slightly open so that the loaded filter could equilibrate.
Gravimetric and nuclear analysis
The filters were humidity conditioned in desiccators for, at least, 48 hr before and after sampling. The Nuclepore filters were weighed on electric micro-weighing balance (Sartorius model CP2P-F) with a minimum resolution of 0.001 mg at a temperature between 20 and 25 °C and relative humidity between 32% and 45%. Filter mass before and after sampling was obtained as the average of three measurements, when observed variations were less than 5%. The PM loading on the filter is the difference between these two weights. The mass concentration, C (μg/m3), of the loaded filter was obtained from the relation:
Each filter was divided in two, about a half was rolled up and put into a thin foil of aluminum and irradiated for 5 hr at a thermal neutron flux of 9.11 × 1012 cm−2 sec−1 (f = 73 ± 2; α = −0.019 ± 0.0001; T n (K) = 336 ± 3) in the Portuguese Research Reactor (CitationAlmeida et al., 2003). After irradiation, the sample was removed from the aluminum foil and transferred to a polyethylene container. For each irradiated sample, two gamma spectra were measured; one spectrum was measured 2–3 days after the irradiation and the other after 4 weeks. One-millimeter-diameter wires of 0.1% Au-Al alloy (Institute for Reference Materials and Measurements reference material 530) were co-irradiated as comparators. Measurements were carried out with a germanium detector using the k0-INAA method. The National Institute of Standards and Technology (NIST) Coal Fly Ash standard 1633a, which was co-irradiated with the samples, was used as quality control. A total of 40 field and 2 blank filters were analyzed. Blank filters were treated as regular samples. All measured species in the blank were very homogeneously distributed; hence, loaded filters concentrations were corrected by subtracting the filter blank contents. The detection limits for the elements were those automatically reported by the k0-INAA software. The INAA technique has been optimized for the irradiation and quantification of As, Br, Cd, Cr, Fe, Na, Sb, Sn, and Zn (CitationAlmeida et al., 2003). Elemental composition of both PM2.5 and PM2.5–10 was subjected to PCFA with varimax rotation for source identification.
Quality control
shows that the average elemental concentration (μg/g) obtained for the standards (Coal Fly Ash standard reference material [SRM-1633a]) were in agreement with the certified values. The results obtained were in agreement within the certified values with deviations between 1.5% and 8.8% except for Zn (with a 12% deviation from the certified value).
Table 1. Elemental concentration values for standard reference material (SRM-1633a)
Results and Discussion
Mass concentration of particulate matter
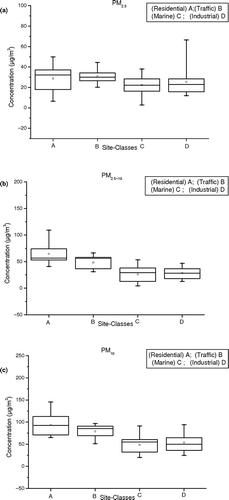
The statistical analyses of the mass concentrations of both particle fractions in the four site-classes are shown in . We observe that the residential and heavy-traffic site-classes have the highest loadings of the coarse and fine PM fractions, respectively. This suggests that resuspended soil dust and burning/combustion, respectively, could likely be the major contributors to the airborne PM in the residential and heavy-traffic site-classes.
Table 2. Summary of PM2.5 and PM2.5–1 0 mass concentration
The mean mass concentrations of PM2.5 and PM2.5–10 varied widely at the residential and heavy-traffic site-classes () but not at the marine and industrial sites. For instance, the mean mass concentrations for PM2.5 and PM2.5–10 in the residential site-class are 28 and 65 μg/m3, respectively, whereas in the marine site-class it was 25 and 26 μg/m3. This was probably due to the fact that resuspension of soil dust, which is a major source of the coarse fraction, was prevalent in the residential and heavy-traffic site-classes. The mean mass concentration ranged between 3 and 67 μg/m3 for PM2.5 and between 4 and 110 μg/m3 for PM2.5–10. The sampling site at Victoria Island (marine) had the least mean airborne particulate load (PM10) value of 50 μg/m3, compared with Bariga (residential) where it was about 90 μg/m3. Victoria Island is surrounded by water body and most times the environment is wet and humid; hence, there was little contribution to PM from roadway- or construction-work-related fugitive dust emissions. shows the box-whisker plot for the particle fractions at the site-classes.
Figure 2. (a) Box-whisker plot for PM2.5 for the site-classes. (b) Box-whisker plot for PM2.5–10 for the site-classes. (c) Box-whisker plot for PM10 for the site-classes.
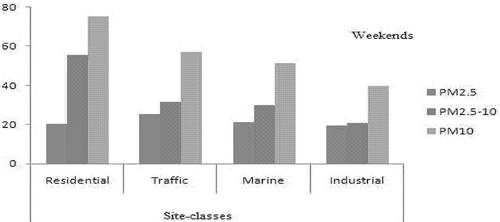
About 28% of the total samples were collected on Saturdays and Sundays. A comparison of particulate load on weekdays (Mondays through Fridays) and weekends (Saturdays and Sundays) showed that particulate load on weekdays are greater by a factor of 1.5 except for the marine environment where the difference is insignificant. This exception is probably due to the fact that Victoria Island houses a few recreation centers that experience higher patronage during the weekends. There are quite a number of corporate offices and establishments where a considerable number of the offices are opened to business on weekends, especially on Saturdays. The seafood markets also witness a “beehive” of activities over the weekend, usually from late Fridays to Sundays. As a result the traffic around the roads and human activities in most areas around, Victoria Island remains virtually the same all through the days of the week. The residential and industrial environments experience a drop in particulate load during the weekends because of light traffic. There is a reduction in human activities and most industries operate skeletally during the weekends. The distributions of the PM mass loading in the site-classes for weekdays and weekends are shown in and , respectively.
Figure 3. Weekdays mean mass concentration (μg/m3) of particulate matter.
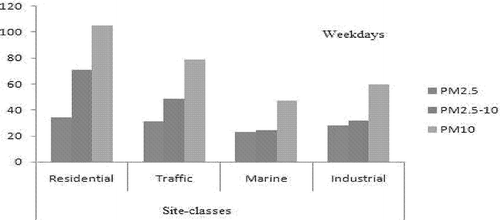
Figure 4. Weekends mean mass concentration (μg/m3) of particulate matter.
Mean PM2.5/PM10 ratio for the entire sampling period was 0.41 ± 0.13. This indicates that the coarse fraction has participated by a fairly larger proportion in the ambient airborne PM content. This result is in agreement with similar studies carried out in the cities of Mexico, Greece, and some rural and semirural areas of the United States. Mean values of 0.42 ± 0.1 and 0.44 and a range of 0.39–0.69 were obtained in Mexico, Greece, and the United States, respectively (CitationU.S. Environmental Protection Agency [EPA], 2001; CitationVega et al., 2002; CitationEvagelopoulos et al., 2006).
The lowest mean value of 0.31 ± 0.13 for the PM2.5/PM10 ratio (implying more than 65% of the ambient airborne PM falls in the coarse fraction) was obtained in the residential area, which supposedly was due to resuspension of particulates from the unpaved roads by vehicular activity. The highest mean value of 0.49 ± 0.17 (meaning there was an almost equal contribution from both fractions to the ambient airborne PM) was observed in the marine environment. The general trend is that the ratio is higher in marine environment and lower in residential environment. In this study, the marine environment had an almost equal contribution from both fractions of PM, which could be due either to the fact that emission from traffic (which can be very high at specific times of the day) had contributed greatly to PM2.5 concentration or perhaps in the marine site; coarse particles show atmospheric residence time shorter than other places because of their proximity to big water reservoirs. The concentration of PM2.5–10 in the residential site could have been enhanced by fugitive dust emission from the unpaved roads and contributions from other external sources.
The consideration of PM2.5/PM10 ratio is quite important, as high ratios attribute particulate air pollution to vehicle emissions and secondary particles, formed in the atmosphere from gases. On the other hand, smaller ratios are related to strong dust emissions and resuspension due to high traffic volume (CitationEPA, 2001). Several factors could drive the change in PM2.5/PM10 ratio. This factor includes vehicular emission, high-temperature process, photochemical reactions, and fewer resuspension of soil dust.
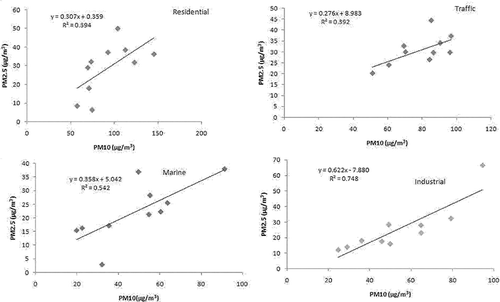
shows the scatter plots for the concentration of PM2.5 against the concentration of PM10 in each of the site-classes. The regression equation and correlation are also indicated on the plots. The correlations between PM2.5 and PM10 at the residential, traffic, marine, and industrial site-classes are 0.39, 0.39, 0.54, and 0.75, respectively. Lower correlations suggest that a chunk of the two particle fractions were not contributed from the same source. A correlation coefficient of 0.75 obtained for the correlation between PM2.5 and PM2.5–10 in the industrial site-class is a pointer to the fact that a large percentage of both particle fractions are contributed by the same sources.
Figure 5. Scatter plot for PM2.5 versus PM10 at the four site-classes.
Average elemental concentrations (μg/g)
shows the mean and standard errors (uncertainties) of the concentration levels of the elements in the coarse (PM2.5–10) and fine (PM2.5) fractions of the ambient air PM. The mean values presented in are obtained from a data set of 40 samples. The range of highest concentrations were detected for Zn, Br, K, and Na, whereas the rare earth elements (La, Ce, and Sm) were detected in ultratrace concentrations. Of the 10 elements, Na and K are found to be the most abundant metals. All elements except Br, Mo, and Sb are predominant in the coarse fraction. Mo was detected extensively in the industrial site-class, in contrast to other site-class, and this corroborates a study conducted in Detroit (CitationGildemeister, 2001) where Mo was reported to be associated with the industrial environment. Arsenic was not detected in the fine fraction in the industrial site-class, suggesting that combustion process is not the main source of arsenic in this site-class. Molybdenum was also not detected in the coarse fraction in the residential and heavy-traffic site-classes, which is likely due to the fact that molybdenum in these sites are not from fugitive dust emissions.
Table 3. Summary of concentration of elements in PM2.5 and PM2.5–1 0
The ratio of La and the lanthanides: La/Ce = 0.48 and La/Sm = 7.4, compares favorably with rare earth element (REE) signature ratio of La/Ce = 0.6 and La/Sm = 6.2 (CitationKulkarni et al., 2006). The values are in the approximate range of crustal material and automobile catalyst (CitationHuang et al., 1994). These results imply that the REE detected are likely from soil resuspension and vehicular emissions.
Source identification by principal component factor analysis (PCFA)
show the elemental loadings resulting from varimax rotation. Multivariate factor analysis was adopted to assist in the identification of dominant source (CitationOgulei et al., 2005; CitationWang et al., 2008). Loadings are the coefficients of correlation between individual factors and the elements. A loading close to 1 indicates that the element is characteristic of that particular source. Communalities of all elements in the data set were in the range 0.38–1.00, indicating that each element was satisfactorily apportioned to the identified factors.
Table 4. PCFA on PM2.5 and PM2.5–1 0 elemental concentration (μg/g) at the residential site-class
Table 5. PCFA on PM2.5 and PM2.5–1 0 elemental concentration (μg/g) at the traffic site-class
Table 6. PCFA on PM2.5 and PM2.5–1 0 elemental concentration (μg/g) at the marine site-class
Table 7. PCFA on PM2.5 and PM2.5–1 0 elemental concentration (μg/g) at the industrial site-class
Potential sources of rare earth metals (REEs) include soils and catalysts used in automobiles and petroleum refinery operations (CitationOlmez and Gordon, 1985; CitationKulkarni et al., 2006, Citation2007). In the residential site-class (), three factors were identified for each of the particle fraction by PCFA. The first factor for the fine fraction showed higher loading for Br, Ce, and Sm, with the highest percentage of variance (49.9%). This pattern of elements indicates that their possible dominant origin could be traffic emission (CitationHildemann et al., 1991). The second factor explained 31.8% of variance, with high loading of K, Sb, and Zn. The main source of this group of element is biomass burning/vehicular-related sources (CitationAndreae, 1983; CitationVan Grieken, 1992; CitationMarcazzan et al., 2001). The third factor, with high loadings of As and Mo with a percentage variance of 16.0%, can be attributed to coal combustion/industrial emission (CitationChow and Watson, 1998; CitationBorbly-Kiss et al., 1999). Perhaps Mo is transported from the industrial site, indicating wind blowing from northwest to east and southeast at certain hours. For the coarse particle fraction, the first factor, with a high loading of La, Sm, and Zn accounting for 44.1% of total variance, could be said to be traffic-related (brake lining and tyre wearing) (CitationBocca et al., 2006; CitationSmichowski et al., 2004). The second factor, accounting for 33.9% of total variance, has a high loading of As, Ce, and Na. The pattern of elements is indicative of the fact that the possible sources of this factor could be sea salt and industrial emission (CitationSanchez-Rodas et al., 2007; CitationAlastuey et al., 2006). A high loading of Br characterized the third factor, which accounted for 17.9% of total variance. The dominant source of this factor could be attributed to traffic emission.
Three and two factors were identified for the fine and coarse particulate fractions, respectively, in the traffic site-class. For the fine fraction, the first factor, having a high loading of Br, Na, Sb, and Zn, accounted for 52.4% of total variance. This factor could be attributed to traffic emission and sea salt. The elemental pattern of the second factor, with a high loading of As and La accounting for 32.4% of total variance, indicates that charcoal combustion could be the possible source of this factor. Charcoal is used as a source of energy for domestic cooking purposes in Nigeria. The third factor, with a high loading of Mo accounting for 14% of total variance, could be attributed to industrial emission. For the coarse fraction, the first factor has a high loading of As, Ce, Sm, and Zn, accounting for 52.2% of total variance. The main source of this group of element is industrial/traffic-related emission. The second factor, accounting for 47.1% of total variance having a high loading of Br, Na, and Sb, could be attributed to traffic emission and sea salt.
In the marine site-class, three factors were identified for each of the two fractions of PM. For the fine fraction, the first factor, accounting for 54.1% of total variance, has a high loading of La, Sb, and Sm. The prominent source of this factor could be traffic-related (CitationGomez et al., 2005). The second factor accounted for 31.7% of total variance, with a high loading of Na, whereas the third accounted for 12.3% of total variance, with a high loading of Mo. The possible origin of the second factors is sea salt, whereas the source of the third factor could not be identified. For the coarse fraction, the first factor, exhibiting a high loading of As, Ce, Mo, and Na accounting for 48.4% of total variance, could be attributed to industrial emission and sea salt. The scenario is that particles made up by Mo are transported in the wind from the industrial site. These particles increase in size during transport and arrive at the marine site as coarse. The second factor accounted for 31.4% of total variance, with a high loading of Br, La, and Zn, whereas the third accounted for 16.4% of total variance, with a high loading of Sb. The possible dominant sources of these factors are traffic emission and traffic-related (brake lining), respectively.
Three factors were identified for the fine fraction, whereas two were identified for the coarse fraction in the industrial site-class. For the fine PM fraction, factor 1, with a high loading of K, Mo, and Zn accounting for 54.9% of total variance, can be attributed to contributions from biomass burning and industrial emission. The second factor, with a high loading of Na and Sb, accounted for 32.2% of the total variance. The main origins of this factor could be sea salt and traffic-related. Traffic is probably the sources of factor 3, with a high loading of Br accounting for 12.8% of the total variance. For the coarse fraction, the first factor accounted for 68.1% of the total variance, with a high loading of Na and Sb. This factor could be due to contributions from sea salt and traffic-related particles. Factor 2, accounting for 30.4% of the total variance with a high loading of K, La, Mo, Sm, and Zn, could be attributed to contributions from biomass burning and industrial emissions.
Conclusion
This study has shown that the coarse particle fraction is the most dominant in the residential and heavy-traffic sampling sites, with an average PM2.5/PM10 ratio of between 0.31 and 0.40, whereas the contributions from the two particle fractions are almost the same in the marine and industrial sites with an average PM2.5/PM10 ratio of 0.49. A significant difference was observed between particulate loads on weekdays and weekends in the sampling sites except at the Victoria Island. The mean PM2.5/PM10 ratio in all the samples from the entire sampling campaign is 0.41 ± 0.13, a clear indication that automotive emission is not the principal source of pollutants at the sampling sites. The contributing sources in the four site-classes are similar but with varying degrees of contributions. Common sources identified for the site-classes are traffic-related, traffic emission, sea salt, and industrial emission.
Acknowledgment
The authors acknowledges the support of Instituto Superior Tecnico, Instituto Tecnológico e Nuclear (IST/ITN), Portugal, for the research visit granted one of them (F.S. Olise). Dr. F.S. Olise appreciates the many correspondences, encouragement, and goodwill received from Dr. Maria do Carmo Freitas (retired) of IST/ITN.
References
- Alastuey , A. , Querol , X. , Plana , F. , Viana , M. , Ruiz , C. , ánchez , A. S , de la Campa , A. , de la Rosa , J. , Mantilla , E. and Garcia Dos Santos , S. 2006 . Identification and chemical characterisation of industrial PM sources in SW Spain . J. Air Waste Manage. Assoc. , 56 : 993 – 1006 . doi: 10.1080/10473289.2006.10464502
- Almeida , S. , Freitas , M. , Reis , M. and Pio , C. 2003 . Quality asssessment on airborne particulate matter of ko-INAA . J. Radioanal. Nucl. Chem. , 257 : 609 – 613 . doi: 10.1023/A:1026177202468
- Amato , F. , Pandolfi , M. , Escrig , A. , Querol , X. , Alastuey , A. , Peya , J. , Perez , N. and Hopke , P. 2009 . Quantifying road dust resuspension in urban environment by multilinear engine: A comparison with PMF2 . Atmos. Environ. , 43 : 2770 – 2780 . doi: 10.1016/j.atmosenv.2009.02.039
- Andreae , M.O. 1983 . Soot carbon and excess fine potassium: Long-range transport of combustion-derived aerosols . Science , 220 : 1148 – 1151 . doi: 10.1126/science.220.4602.1148
- Arya , S.P. 1999 . Air Pollution Meteorology and Dispersion , New York : Oxford University Press .
- Bocca , B. , Caimi , S. , Smichowski , P. and Gomez , D. 2006 . Monitoring Pt and Rh in urban aerosols from Buenos Aires, Argentina . Sci. Total Environ. , 358 : 255 – 264 . doi: 10.1016/j.scitotenv.2005.04.010
- Borbély-Kiss , I. , Koltay , E. , Szabó , G. , Bozó , L. and Tar , K. 1999 . Composition and sources of urban and rural atmospheric aerosol in eastern Hungary . J. Aerosol Sci. , 30 : 369 – 391 . doi: 10.1016/S0021-8502(98)00051-2
- Cahill , T. A. , Eldred , R.A. , Barone , J.B. and Ashbaugh , L.L. 1979 . Ambient Aerosol Sampling with Stacked Filter Units , Washington , DC : U.S. Department of Transportation . Technical report, report no. FHWA-RD-78-178
- Charlson , R.J. , Schwartz , S.E. , Hales , J.M. , Cess , R.D. , Coackley , J.A. , Hansen , J.E. and Hofmann , D.J. 1992 . Climate forcing by anthropogenic aerosol . Science , 225 : 423 – 430 . doi: 10.1126/science.255.5043.423
- Chow , J.C. and Watson , J.G. 1998 . Western Washington 1996–97 PM2.5 Source Apportionment Study Technical report no. 98. Seattle, WA: Puget Sound Air Pollution Control Agency
- Dockery , D.W. , Pope , C.A. III , Xu , X. , Spengler , J.D. , Ware , J.H. , Fay , M.E. , Ferris , B.G. and Speizer , F.E. 2000 . Association of fine particulate matter from different sources with daily mortality in six US cities . Environ. Health Perspect. , 108 : 941 – 947 .
- Evagelopoulos , V. , Zoras , S. , Triantafyllou , A.G. and Albanis , T.A. 2006 . PM10–PM2.5 time series and fractal analysis . Global NEST J. , 8 : 234 – 240 .
- Gildemeister , A.E. 2001 . Urban atmospheric mercury: The impact of local sources on deposition and ambient concentration in Detroit, MI. Ph.D. dissertation , Ann Arbor , , Michigan : The University of Michigan .
- Gomez , D. , Smichowski , P. , Gine , M. and Sanchez-Bellato , A. 2005 . Antimony: A traffic-related element in the atmosphere of Buenos Aires, Argentina . J. Environ. Monit. , 7 : 1162 – 1168 . doi: 10.1039/b508609d
- Hildemann , L.M. , Markowski , G.R. and Cass , G.R. 1991 . Chemical composition of emissions from urban sources of fine organic aerosol . Environ. Sci. Technol. , 25 : 744 – 759 . doi: 10.1021/es00016a021
- Hopke , P.K. , Mar , T.F. , Ito , K. , Koenig , J.Q. , Larson , T.V. , Eatough , D.J. , Henry , R.C. , Kim , E. , Laden , F. , Lall , R. , Naes , L. , Stölzel , M. , Paatero , P. and Thurston , G.D. 2006 . PM source apportionment and health effects. 3. Investigation of inter-method variations in associations between estimated source contributions of PM2.5 and daily mortality in Phoenix, AZ . J. Expos. Sci. Environ. Epidemiol. , 16 : 311 – 320 . doi: 10.1038/sj.jea.7500465
- Hopke , P.K. , Xie , Y. , Y , Raunemaa , T. , Biegalski , S. , Landsberger , S. , Maenhaut , W. , Artaxo , P. and Cohen. , D. 1997 . Characterization of the Gent stacked filter unit PM10 sampler . Aerosol Sci. Technol. , 27 : 726 – 735 . doi: 10.1080/02786829708965507
- Huang , X. , Olmez , I. , Araz , N.K. and Gordon , G.E. 1994 . Emissions of tracer elements from motor vehicles . Potential marker elements and source composition profile. Atmos. Environ. , 28 : 1385 – 1391 . doi: 10.1016/1352-2310(94)90201-1
- Intergovernmental Panel on Climate Change . 2001 . Climate Change 2001, Third Assessment Report , Geneva : Intergovernmental Panel on Climate Change . Technical report
- Itua , E. 2006 . Vehicular Emission (Air Quality) Monitoring Study in Lagos, Nigeria www.environmental-expert.com (accessed July 6, 2009)
- Kulkarni , P. , Chellam , S. , Flanagan , J.B. and Jayanty , R. 2007 . Microwave digestion-ICP-MS for elemental analysis in ambient airborne fine particulate matter: Rare earth elements and validation using a filter borne fine particle certified reference material . Anal. Chim. Acta , 599 : 170 – 176 . doi: 10.1016/j.aca.2007.08.014
- Kulkarni , P. , Chellam , S. and Fraser , M.P. 2006 . Lanthanum and lanthanides in atmospheric fine particles and their apportionment to refinery and petrochemical operations in Houston, TX . Atmos. Environ. , 40 : 508 – 520 . doi: 10.1016/j.atmosenv.2005.09.063
- Laschober , C. , Limbeck , A. , Rendl , J. and Puxbaum , H. 2004 . Particulate emissions from on-road vehicles in the Kaisermuhlen-tunnel (Vienna, Austria) . Atmos. Environ. , 38 : 2187 – 2195 . doi: 10.1016/j.atmosenv.2004.01.017
- Marcazzan , G.M. , Vaccaro , S. , Valli , G. and Vecchi , R. 2001 . Characterization of PM10 and PM2.5 particulate matter in the ambient air of Milan (Italy) . Atmos. Environ. , 35 : 4639 – 4650 . doi: 10.1016/S1352-2310(01)00124-8
- Obioh , I. , Olise , F. , Owoade , O. and Olaniyi , H. 2005 . Chemical characterisation of suspended particulates along air corridors of motorways in two Nigerian cities . J. Appl. Sci. , 5 : 347 – 350 . doi: 10.3923/jas.2005.347.350
- Ogulei , D. , Hopke , P. , Zhou , L. , Paatero , P. , Park , S. and Ondov , J. 2005 . Receptor modeling for multiple time resolved species: The Baltimore supersite . Atmos. Environ. , 39 : 3751 – 3762 . doi: 10.1016/j.atmosenv.2005.03.012
- Olmez , I. and Gordon , G.E. 1985 . Rare earths: Atmospheric signatures for oil-fired power plants and refineries . Science , 229 : 966 – 968 .
- Olowoporoku , D. 2007 . Air Quality Management in Lagos , Bristol : Air Quality Management Centre . Technical report
- Oluyemi , E. and Asubiojo , O. 2001 . Ambient air particulate matter in Lagos, Nigeria: A study using receptor modelling with x-ray fluorescence analysis . Bull. Chem. Soc. Ethiopia , 15 : 97 – 108 . doi: 10.1126/science.229.4717.966
- Pope , C.A. and Dockery , D.W. 2006 . Health effects of fine particulate air pollution: Lines that connect . J. Air Waste Manage. Assoc. , 56 : 709 – 742 . doi: 10.1080/10473289.2006.10464485
- Quality of Urban Air Review Group . 1996 . Airborne Particulate Matter in the United Kingdom. The Third Report of the Quality of Urban Air Review Group , London : Department of Environment, Quality of Urban Air Review Group . Technical report
- Salma , I. and Maenhaut , W. 2006 . Changes in elemental composition and mass of atmospheric aerosol pollution between 1996 and 2002 in a central European city . Environ. Pollut. , 143 : 479 – 488 . doi: 10.1016/j.envpol.2005.11.042
- Sanchez-Rodas , D. , Ana , M. , de la Campa , S. , de la Rosa , J. , Oliveira , V. , Gomez-Ariza , J. , Querol , X. and Alastuey , A. 2007 . Arsenic speciation of atmospheric particulate matter (PM10) in an industrialised urban site in southwestern Spain . Chemosphere , 66 : 1485 – 1493 . doi: 10.1016/j.chemosphere.2006.08.043
- Smichowski , P. , ómez , D. G , Dawidowski , L. , Giné , M. , Sánchez Bellato , S. and Reich , S. 2004 . Monitoring trace metals in urban aerosols from Buenos Aires city. Determination by plasma-based techniques . J. Environ. Monit. , 6 : 286 – 294 . doi: 10.1039/b312446k
- Taiwo , O. 2005 . The Case of Lagos Air Quality Improvement Project , Lagos : Lagos Metropolitan Area Transport Authority (LAMATA . Technical report
- U.S. Environmental Protection Agency . 2001 . Criteria document on particulate matter, draft report , Washington , DC : United States Environmental Protection Agency . Technical report
- Van Grieken , R. 1992 . Electron microprobe characterization of individual aerosol particles collected by aircraft above the southern bight of the North Sea . Atmos. Environ. , 7 : 1231 – 1237 .
- Vardoulakis , S. , Fisher , B. , Pericleous , K. and Gonzalez-Flesca , N. 2003 . Modelling air quality in street canyons: A review . Atmos. Environ. , 37 : 155 – 182 . doi: 10.1016/S1352-2310(02)00857-9
- Vega , E. , Reyes , E. , Sanchez , G. , Ortiz , E. , Chow , M. J , Watson , J. and Edgerton , S. 2002 . Basic statistics of PM2.5 and PM10 in the atmosphere of Mexico City . Sci. Total Environ. , 287 : 167 – 176 . doi: 10.1016/S0048–9697(01)00980–9
- Wang , W.C. , Chem , K.S. , Chem , S.J. , Lin , C.C. , Tsai , J.H. , Lai , C.H. and Wang , S.K. 2008 . Characteristics and receptor modeling of atmospheric PM2.5 at urban and rural sites in Pingtung, Taiwan . Aerosol Air Quality Res. , 8 : 112 – 129 .
- World Health Organization . 2005 . Air Quality Guidelines for Particulate Matter, Ozone, Nitrogen Dioxide and Sulfur Dioxide , Geneva : World Health Organization . Technical report