Abstract
Concentrations of 91 volatile organic compounds (VOCs) ranging from C5 to C12 were measured at three sites in Ankara, the capital of Turkey, in the summer of 2003 and winter of 2004. Samples were collected at roadside, residential and background stations at consecutive 4-hr intervals over a 24-hr period for six weeks in each season. Air samples were collected onto cartridges packed with Tenax TA and Carbopack B resins and analyzed by thermal desorption, followed by gas chromatography coupled to a mass selective detector (GC/MSD). Time resolved data provided information on ambient levels, temporal and spatial variations and sources of VOCs in Ankara. Toluene is the most abundant compound at all sites with and average concentration of 13.1 ?g m-3. The mean concentrations of benzene are 12.6, 5.2, and 2.4 ?g m-3 during winter at roadside, residential and background stations, respectively. Diurnal variation in the data together with toluene to benzene concentration ratio (T:B) that is close to 2.0 indicated the influence of traffic related emissions at residential and roadside stations during winter season. Higher T:B ratio observed at residential and background stations during summer period and correlation analysis indicated additional VOC sources. Temporal variations and low m,p-xylene to ethylbenzene ratio (mpX:E) indicated that transported air mass is the major VOC source influencing VOC concentrations measured at the background station.
VOC measurement at three sites in Ankara, the capital of Turkey showed that VOC concentrations measured at the roadside station are reasonably higher than concentrations measured at residential and background sites. Diurnal variations of VOC concentrations revealed that traffic emissions at roadside and residential locations are a significant VOC source in Ankara. On the other hand, VOC levels measured at the background site are transported from more polluted parts of Ankara.
Supplemental Materials: Supplemental materials are available for this paper. Go to the publisher's online edition of the Journal of the Air & Waste Management Association.
Introduction
Volatile organic compounds (VOCs) are of concern due to their direct effects on human health and indirect impacts on ecosystems through their contribution to tropospheric ozone formation. Many VOCs are classified as known or suspected carcinogens (U.S. EPA, 1990).
Many of the 188 hazardous air pollutants listed in the 1990 U.S. Clean Air Act Amendment are VOCs. Reactions of VOCs with nitrogen oxides (NOx) in the atmosphere result in formation of photochemical smog, which is known to harm both human health and ecosystems (CitationFinlayson and Pitts, 1993; CitationLippmann, 1991). Both their toxicity and ozone-forming potential attracted attention on VOCs in the last decade and led to extensive measurements of their levels and assessment of their sources in urban airsheds in –different parts of the world (CitationSrivastava et al., 2005; CitationYang et al., 2005; CitationNa, Kim, and Moon, 2003; CitationPankow et al., 2003; CitationBarletta et al., 2002; CitationBravo et al., 2002; CitationEdwards et al., 2001; CitationLiu et al., 2000). However, there are few measurements of VOCs in different urban and industrial areas in Turkey, including measurements performed at Izmir, (CitationMüezzinoğlu, Odabaşı, and Onat, 2001; CitationElbir et al., 2007), Bursa (CitationCivan, Kuntasal, and Tuncel, 2011), Ankara (CitationYurdakul, Civan, and Tuncel, 2012), an industrial area in İzmir (CitationÇetin, Odabaşı, and Seyfioğlu, 2003), and İstanbul (Demir et al., 2011).
Ankara is the second largest city and has 3.5 million inhabitants. Although there are no VOC emission inventories for Ankara, traffic is expected to be the major VOC source, as there are no major industries in the city. The vehicle density in Ankara is 1 vehicle per 4.9 people (SSI, 2004), which is the highest among all Turkish cities. Statistics for the last 30 years also demonstrated that the rate of increase in number of motor vehicles (i.e., 1.52) is higher than the rate of population increase (i.e., 1.07), indicating that motor vehicle-related air pollution might play a more critical role in overall air pollution problem in Ankara in the coming years.
In this study results of VOC measurements performed in Ankara in 2003 and 2004 are discussed. Measurements were carried out at three locations in the city and for 6 weeks in the summer of 2003 and winter of 2004. Levels of VOCs and factors controlling their temporal and spatial variation are discussed. Ninety-one organic compounds were detected in collected samples. Fifty-three of these are quantified in >50% of the samples. The analytical part of the study was published previously (CitationKuntasal et al., 2005). The use of data for source apportionment using chemical mass balance (CMB) and positive matrix factorization (PMF) will be discussed in another publication.
Experimental Methods
Sampling sites
Measurement of VOCs was carried out at three different sites in Ankara. The sites were representative for three different microenvironments, namely, a residential area, a roadside location, and a background site, which is not in the immediate vicinity of strong VOC sources. Locations of sampling points are depicted in on a population density distribution map of the city.
Figure 1. Locations of sampling points.
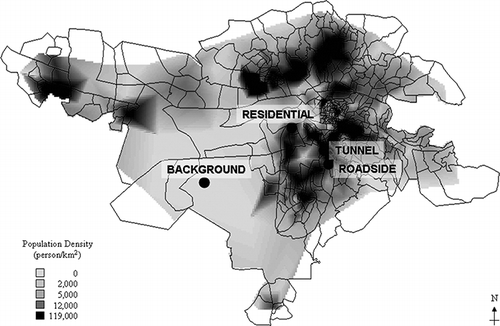
The residential station is located in the densely populated Bahçelievler district, which is mainly occupied by residential apartment buildings, schools, hospitals, and small retail shops. The station was placed in the backyard of an apartment building, which was about 100 m away from a main street. This is a typical residential area for Ankara, where the air quality is mainly influenced by domestic activities and limited vehicle movements. The site is not in the immediate vicinity of the busy streets. The nearest road with heavy traffic is approximately 600 m away.
The roadside station is located on Atatürk Boulevard, which is a major street located at the city center. This part of the city is mainly occupied by commercial buildings, foreign embassies, banks, and various government buildings. The sampling station was located at a heavy traffic junction about 2 m from the curb. Therefore, motor vehicle traffic was the major air pollution source at this site.
The background station is located at the Middle East Technical University (METU) campus, approximately 10 km away from the downtown area and approximately 1.5 km away from the nearest residential area. The nearby forested area, the campus traffic, dormitories, and campus housing areas are the nearby sources that can affect VOC concentrations. Therefore, this station was rather a suburban site where the air pollution is influenced by both local anthropogenic and natural sources and transported air masses.
Sampling methodology
Summer samples were collected between July 23 and September 6, 2003, and winter samples between January 14 and March 1, 2004. Samples were collected in five consecutive 4-hr intervals over a 24-hr period. The five periods included a morning session between 8:00 a.m. and 12:00 noon, a noon session between 12:00 noon and 4:00 p.m., an afternoon session between 4:00 p.m. and 8:00 pm, an evening session between 8:00 pm and midnight, and a night session between midnight and 8:00 a.m.
Since sampling and analytical methodology were published elsewhere (CitationKuntasal et al., 2005), a brief summary is presented here. Ambient air was drawn into the prepacked and conditioned sampling tubes by a vacuum pump (SKC, Inc., Eighty Four, PA) at a flow rate of 10 mL min−1 for 4 hr. The sampling inlet was at 1.5 m from the ground at the residential and roadside stations and at 4 m for the background station. Samples were immediately brought to the laboratory at the end of sampling for analysis.
The sampling tubes were glass-lined stainless steel (GLT) with 4 mm internal diameter and 10.6 cm length and were packed with Tenax TA and Carbopack B resins. Tubes were conditioned at 300°C for 12 hr prior to sampling. High-purity nitrogen flowed through the tube at a rate of 100 mL min−1 during conditioning. The conditioned tubes were capped tightly with brass caps having polytetrafluoroethylene (PTFE) seals and kept in precleaned glass storage tubes that were partially filled with charcoal and anhydrous calcium sulfate to provide dry and hydrocarbon-free air for storage. The storage tubes were capped with PTFE caps and kept in a freezer at –18°C until sampling. The storage procedure was applied to both clean tubes before they were shipped to stations and sampled tubes until they were desorbed in the laboratory.
Analytical methodology
Samples were analyzed by a system consisting of a thermal desorption (Scientific Instrument Services, model TD 4 short path thermal desorber)/gas chromatography (GC)–mass spectrometry (MS) (Hewlett-Packard 6890 GC and 5973 MS). The multisorbent tubes were thermally desorbed at 200°C for 5 min under 20 mL min−1 carrier gas flow. The desorbed analytes were cooled by liquid carbon dioxide to –70°C and trapped cryogenically in front of the analytical column. The cryogenic trap was then quickly heated to 250°C for rapid introduction of the analytes into the column for separation by GC and identification and quantification by MS. The analytical column was a 60 m × 0.32 mm J&W (Palo Alto, CA, USA) DB-1 with 1 μm dimethlypolysiloxane coating. The GC oven temperature was initially –30°C for 3 min. It was then raised at 6°C min−1 ramp rate to 220°C and kept at that temperature for 1 min. The mass detector was operated in the electron ionization mode with a mass range between 30 and 300 amu. The MS quad and MS source temperatures were 150°C and 230°C, respectively.
The concentrations were quantified by an external standard calibration at five different concentration levels. A gas phase mixture of VOCs including 148 individual compounds provided by the Environmental Technology Center, Environment Canada (Ottawa, Canada), was used for calibration. Daily calibration checks with midpoint standard concentrations were performed.
Quality assurance and control of data
Quality assurance efforts such as collection and analysis of laboratory and field blanks, breakthrough tests, method detection limit, and storage stability tests were performed (Oğuz-CitationKuntasal et al., 2005). Only a very brief summary of data quality control (QC) procedures is presented. Quality control of data was done by plotting and assessing (i) times series, (ii) scatter plots, and (iii) fingerprint plots for individual species for each session using SPLUS 6.0 software.
Time-series plots were inspected for large “jumps” or “dips” in concentrations, periodicity of peaks, calibration carryover, expected diurnal behavior (e.g., lower concentrations of isoprene during night time), expected relationships among species, and high single-hour concentrations of less abundant species. Fingerprint plots were drawn for each individual session including all target compounds. These plots provided an overall view of daily changes. Morning, noon, afternoon, evening, and night sessions were inspected separately. Fingerprint plots were inspected for outliers that were indicated by deviation from the general pattern.
Scatter plots were drawn to demonstrate correlations between individual species and between individual specie and total VOC. The plots were inspected for benzene versus toluene, species that elute close together, and isomers. Anomalies such as scattered data points being contrary to the general correlation of the data were searched. In case of observed anomalies, chromatograms were reevaluated for possible misidentification or misquantification. In addition, field and laboratory logbooks were reevaluated for any possible contamination or problem. Meteorological parameters such as mixing height, temperature, and wind speed were evaluated to understand whether the anomaly was due to a pollution episode. If no logical reason was found for anomalous data, data were flagged but retained in the data set. Flagged data varied between approximately 0.8% for toluene and 3% for styrene. None of these data was excluded from analysis entirely. These flagged data were treated as regular data points in statistical data treatment; however, they were assigned less weight in multivariate analysis for source apportionment, which will be discussed in other publications.
Results and Discussion
Meteorology and traffic counts
Hourly meteorological data were obtained from General Directorate of Meteorology. Long-term (between 1974 and 2010) monthly average temperature, wind speed (WS), and precipitation data are given in . Monthly average temperature ranged between 0.3°C (January) and 23.5°C (July), which is typical for the continental climate of Central Anatolia, where winters are very cold (temperatures low as –15°C are common during winter) and summer temperatures are mild. Average annual wind speed is 2.3 m sec−1. This low WS is an important feature of the Ankara meteorology. Average values of temperature, wind speed, and rainfall measured at Ankara during our summer and winter campaigns are briefly compared with data from corresponding seasons in a long-term data set obtained from the General Directorate of Meteorology. Average temperatures measured during summer and winter campaigns were 22.9°C and 1.8°C, respectively. Summer and winter average temperatures measured between 1974 and 2010 are 22.8°C and 2.4°C, respectively. Average wind speeds recorded during summer and winter campaigns were 2.5 m sec−1 and 2.8 m sec−1, respectively. Corresponding average wind speeds in long-term data are 2.4 m sec−1 for summer and 1.9 m sec−1 for winter. Similarly, rainfall measured during our summer and winter sampling periods was 60 mm and 125 mm, respectively. Average rainfall for the corresponding periods in long-term data of the General Directorate of Meteorology are 70 mm for the summer season and 118 mm for the winter season. This comparison clearly demonstrates that meteorological features prevailing during this study were not significantly different from the long-term meteorology of the region.
Table 1. Long-term (1974–2010) monthly average temperature, wind speed, and rainfall in Ankara
Diurnal variations in mixing height and “PASQUILL” stability classes observed during the study are given in Stability classes E, F (very stable), and G (inversion) are the most common ones observed at night. B, C, and D are the common stability classes during daytime. Observed diurnal variation in stability indicates that the atmosphere favors dispersion of pollutants during day hours, but dispersion is significantly slowed down at night. Both stability classes and mixing height were calculated using PCRAMMET (U.S. EPA, 1999) software. Data that were neccesary to calculate hourly mixing height and stability classes by PCRAMMET, including hourly wind speed, temperature, cloud cover. and mixing hieght calculated from rawinsonde rises in the morning and at noon hours, were obtained from the Keçören meteorological station of the General Directorate of Meteorology.
Figure 2. Mixing height and stability classes during winter (a) and summer (b) campaigns.
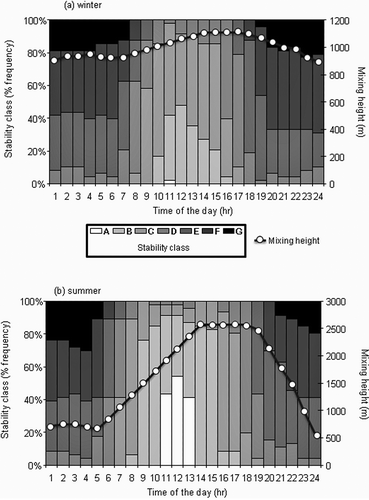
Contributions of A and B stability classes, which represent unstable conditions, favoring dispersion of pollutants, increase during daytime in summer. However, domination of “very stable” and “inversion” conditions at night hours in winter continues in the summer as well.
The mixing height, which is calculated using the PCRAMMET (U.S. EPA, 1999) preprocessor, depicts a typical pattern with high values at noontime and low values at night. Variation in mixing height is more pronounced during summer. In summer, mixing height varies between 500 m and 2500 m; however, it changes to between 850 m and 1100 m in winter.
The meteorological parameters discussed so far suggest that Ankara, because of the topography of the region, suffers frequent stagnant conditions, which result in pollution episodes, particularly during winter and at night. Genç, Yesilyurt, and Tuncel (2010) calculated the hourly ventilation coefficient for Ankara for the years 1999 and 2000. The ventilation coefficient, which is the product of wind speed and mixing height, is a good indicator of the dispersion potential of the atmosphere (CitationGoyal and Rao, 2007). These authors demonstrated that the atmosphere over Ankara has “poor” dispersion potential during 80% and 43% of the time in winter and summer seasons, respectively, which confirms our interpretation of meteorology.
Annual rainfall in the city is 402 mm, which is among the lowest annual rainfall amounts recorded in the whole country. Prevailing annual wind directions are northeast (NE) (23%) and east-northeast (ENE) (20%). Calm conditions occur during 8% of the time (WS < 1.0 m sec−1).
Variations in traffic volume in the city are generally a good indicator for the temporal variations in VOC emissions. In this study, traffic flow through the Akay tunnel in the city was recorded by a video camera during sampling campaigns. Numbers of different types of vehicles passing through the tunnel per day were calculated through the analysis of video records, separately for the summer and winter seasons. Results of traffic counts are depicted in
Figure 3. Number and types of vehicles passing through Akay tunnel: (a) total number of vehicles and (b) distribution of total vehicle count among vehicle types.
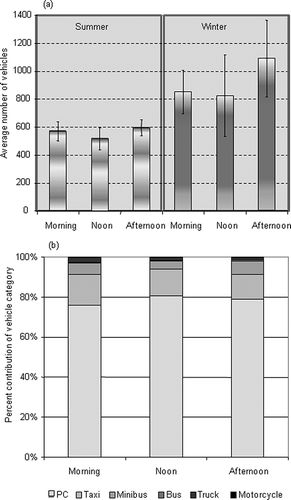
Traffic counts show diurnal, weekly, and seasonal variations. The average number of vehicles passing through the tunnel is 561 vehicles/hr and 922 vehicles/hr during summer and winter, respectively. Approximately 40% reduction in traffic volume in summer months is probably due to migration of people to coastal areas in summer. The number of vehicles recorded in the summer months also doesn't show a statistically significant difference between weekdays and weekends. However, during winter the vehicle counts recorded on weekdays are approximately 1.5 times higher than counts recorded on weekend days. Similarly, Saturday traffic counts are 1.6 times higher than Sunday counts, probably because private companies work on Saturdays and no one works at Sundays. Traffic density through the tunnel shows typical diurnal variation, which is depicted in , with a higher number of vehicles passing through the tunnel in morning and afternoon rush hours. This pattern did not change between summer and winter counts.
Vehicles passing through the tunnel are separated into six categories: passenger cars (PC), taxi, minibus, bus, truck, and motorcycle. Passenger cars are the dominant vehicle type passing through the tunnel at all times. They account for approximately 85% of the total vehicles.
Taxis, at approximately 15% of total traffic counts, followed PCs. Although the contribution of buses to total counts is only 0.5%, their contribution to air pollution can be more significant than their numbers suggest, because most of the buses operating in the city are old and do not undergo proper inspection and maintenance.
Passenger cars in Ankara work with gasoline, diesel, and liquefied petroleum gas (LPG) fuels making up 94%, 6%, and 1% shares, respectively (SSI, 1998). As for taxis, LPG is used as a primary fuel in most of them (more than 90%). Taxis also use diesel and gasoline fuels in smaller amounts. Minibusses, busses, and trucks mostly use diesel fuel.
General features of data
In total, 125 and 206 samples were collected in summer and winter campaigns, respectively. The distributions of samples among sampling segments are given in . In winter 136 of these samples were collected during weekdays and 70 were collected at weekends. Weekday and weekend samples during the summer campaign were 87 and 38, respectively. Distributions of these samples collected in summer and winter and on weekdays and weekends among time segments in the day were relatively homogeneous. Because of this homogeneous distribution, confidence in the results was not significantly influenced by the difference between the number of samples. Samples collected in different time segments varied between 47 and 38 in winter campaign and between 29 and 22 in summer campaign.
Table 2. Distrubition of samples among sampling segments in winter and summer study campaigns
In total, 91 VOC species were successfully identified and quantified in the samples. Median concentrations and ranges of most abundant VOCs are presented in for three sites. The detailed concentration data for all VOCs that were detected in more than 50% of the samples collected at all stations, for summer and winter seasons, are given in the supplementary material. In these tables total VOC concentration is defined as the sum of the concentrations of 91 quantified species. The highest total VOC concentrations were measured at the roadside station during winter (175 μg m−3) and summer (114 μg m−3), and the lowest values were measured at the background station during winter (25 μg m−3) and summer (35 μg m−3). High standard deviations observed in this study are typical for log-normally distributed data and are due to significant daily and diurnal variations observed throughout the study.
Table 3. Median, concentrations and ranges of the most abundant 20 VOCs at residential, background, and roadside stations
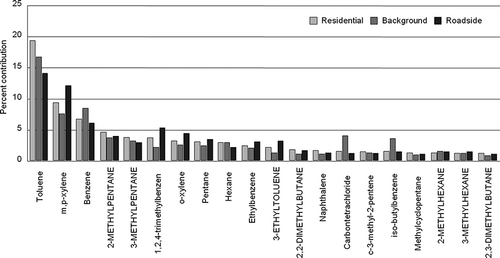
Total aromatic concentrations dominate the overall VOC concentrations measured at all sites and seasons with a contribution of more than 50%. The total concentration of paraffins is the second highest with an average contribution of more than 25% at all sites, and olefins and halogenated VOCs have the lowest contribution to total VOC concentrations (together less than 15%) measured at all sites. The dominance of aromatics is partly due to availability of a large number of aromatic compounds and partly due to high concentrations of some aromatic compounds, such as 1,2,4-trimethylbenzene, o-xylene, ethylbenzene, naphthalene, benzene, m,p-xylene, and particularly toluene, and does not mean that the concentrations of all aromatic compounds are high compared to compounds in other groups.
The contributions of the top 15 VOC species measured at all sites are presented in Toluene is the most abundant compound at all sites with the highest percent contribution to total VOC concentrations of approximately 15%, 18%, and 20% at roadside, background, and residential stations, respectively. Toluene can be emitted from a variety sources such as vehicle exhaust, solvent usage, gasoline evaporation, printing, and adhesives (CitationNa et al., 2004; CitationWatson, Chow, and Fujita, 2001; CitationScheff et al., 1989). The possibility of multiple source categories is probably the reason for the high abundance of toluene observed. Toluene is followed by m,p-xylene and benzene. The most abundant paraffinic species are 2-methylpentane and 3-methylpentane.
Figure 4. Contributions of 20 most abundant VOCs to total VOC mass at residential, background, and roadside stations.
Comparison of VOC concentrations measured in this study with results obtained in similar studies both in Turkey and in other parts of the world is important to put measured concentrations in perspective. Comparison of VOC concentrations obtained in this study with those reported for other cities in Turkey and around the world is presented in .
Table 4. Comparison of the average VOC concentrations (μg m−3) with the literature
Concentrations of VOCs measured in urban atmosphere vary widely depending on parameters such as distance of stations from the roads, sampling height, sampling seasons, sampling duration, and frequency. To minimize the effect of distance to the source, data generated at the roadside station in this study are compared with data from stations that are in the close vicinity of traffic. Although we tried to compare our data with data generated with as similar sampling protocols as possible, it is not possible to find exact match, and some of the differences for the data in can still be due to differences in sampling locations and sampling protocol. Comparison is also limited to BTX compounds, as they were the most frequently measured VOCs. Data for other VOCs in literature are not as abundant.
Concentrations of VOCs shown in show significant variations among different cities, partly due to the differences in sampling protocols and partly due to different burdens of organic compounds in the atmosphere. VOC concentrations measured in Ankara are generally among the lowest in the table. There is an effective national air quality regulation in Turkey, which contains standards to limit vehicle emissions. However, those rules and regulations were poorly enforced in 2003 and 2004, when this study was carried out. In those years there were also a fair number of vehicles in the traffic that were not equipped with catalytic converters. Because of all these reasons, we expected to see higher VOC levels in Ankara compared to the levels measured in better regulated cities, but surprisingly, VOC levels in Ankara were lower than VOC levels in most of the better regulated cities. When traffic counts of Ankara were compared with counts in Ottawa it turned out that the number of vehicles in traffic at Ottawa is a factor of four higher than the number of vehicles in traffic at Ankara. Although emissions per vehicle are higher than emissions per vehicle in better regulated cities, this is offset by substantially higher traffic density in those cities. Although we do not have information on traffic counts for other cities in , number of vehicles in traffic appears to be a key parameter for general VOC levels in an urban atmosphere. On the other hand, the concentrations were the highest at İzmir, Turkey, and the concentrations measured in Ankara were about 10 times lower than those measured in İzmir. Such a big difference in measured concentrations could be explained by differences in sampling and analysis protocol, emission sources, and meteorology. The sampling was conducted only for few days at each site during the İzmir study, and thus it is difficult to distinguish whether these days were the pollution episode days.
Variation of VOC concentrations among three stations
Concentrations of selected VOCs in the three stations and their roadside-to-residential ratios are depicted in All the VOCs have the highest concentrations at the roadside station, which is followed by residential and background stations, except for carbon tetrachloride, which has comparable concentrations at all sites. On average VOC concentrations at roadside station are approximately 2.5 times higher than corresponding concentrations measured at the residential station. The ratio varies between 1.6 for carbon tetrachloride and toluene and 3.1 for 3-ethyltoluene.
Figure 5. Spatial distribution of VOCs in Ankara atmosphere.
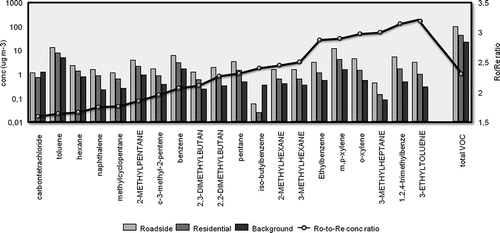
The roadside-to-residential concentration ratios of carbon tetrachloride, toluene, hexane, and naphthalene are 1.8, 1.7, 1.7, and 1.8, respectively. These ratios are the lowest among all VOC ratios between these two stations. These VOCs are also the compounds that have well-documented nontraffic sources. Naphthalene is the main ingredient in mothballs (CitationKuczkowski, 2006) and is widely used in Turkey. Toluene is shown to be emitted from a variety sources such as vehicle exhaust, solvent usage, gasoline evaporation, printing, and adhesives (CitationNa et al., 2004; CitationWatson et al., 2001; CitationScheff et al., 1989), and hexane and carbon tetrachloride are well-known solvents (CitationNazaroff and Weschler, 2004). Consequently, relatively low roadside-to-residential ratios for this group of VOCs are probably due to the influence of nontraffic sources on their measured concentrations.
Concentrations of VOCs measured at the roadside station are, on average, a factor of six higher than corresponding VOC concentrations measured at the background station.
The only exceptions to this general trend are observed in roadside-to-background concentration ratios of 1,2,4-trimethylbenzene, 3-ethyltoluene, 2-methyl-2-butene, 2,2-dimethylpentane, 4-ethyltoluene, and 1,3,5-trimethylbenzene. The roadside-to-background concentration ratios of these compounds are significantly higher than ratios observed in other VOCs. This difference is probably due to degradation of these compounds during transport from downtown stations to background station (approximately 15 km), because most of these compounds are reactive VOCs with relatively short residence times in the atmosphere (CitationDerwent, 1995; CitationMillet et. al., 2004).
Temporal variations of VOCs
In general, temporal variations in VOC concentrations can be related to three factors: (a) variations in VOC source strength, (b) variations in meteorological conditions, and (c) seasonal and short-term variations of photochemical activity. Variation in source strength has dominating influence on variations in VOC concentrations in close proximity to the source. However, when distance between source and receptor increases, meteorological parameters (CitationWang et al., 2005; CitationYang et al., 2005; CitationCheng et al., 1997) and photochemical activity (CitationNa and Kim, 2001) may become more important factors affecting variations in VOC concentrations. Diurnal, weekday–weekend, and seasonal variations in VOC concentrations measured in this study are discussed in the following.
Diurnal variations.
Diurnal variation in the total VOC concentrations measured at three stations is presented in for both summer and winter campaigns. Total VOC concentrations are high for 8:00 a.m. to noon (morning), 4:00–8:00 p.m. (afternoon), and 8:00 p.m. to midnight (evening) sampling periods and low for noon to 4:00 p.m. (noon) and midnight to 8:00 a.m. (night) sessions. These high concentrations in the morning and afternoon sampling coincide with the traffic rush hours. The afternoon rush hour is fairly long in summer, and part of it is included in our evening sampling period. Low concentrations observed for the night session are due to a decrease in emissions.
Figure 6. Diurnal variation in total VOC concentrations: (a) summer and (b) winter.
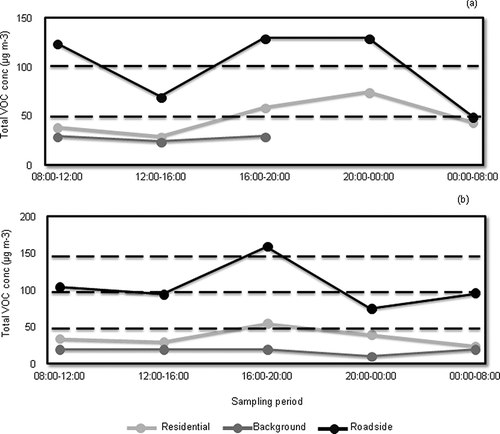
The decrease in concentrations during the noon session is due to both a decrease in traffic load and an increase in atmospheric instability. The ventilation coefficient, which is the product of mixing height and wind speed, varied between approximately 400 m2sec−1 at night and 8000 m2 sec−1 during summer. Diurnal variation in ventilation condition is not as dramatic in the winter season. It increases from 500 m2 sec−1 at night to approximately 1500 m2 sec−1 (Genç et al., 2010). Better ventilation conditions during the noon period is also supported by more unstable atmosphere in Ankara at noontime, as discussed in previous sections. These meteorological factors, together with reduced traffic load after the morning rush hour, can explain lower total VOC concentrations at our noon samples.
The diurnal pattern of total VOC concentrations observed at the residential station during the summer campaign is very similar to that observed at the roadside station. Total VOC concentrations measured at the background station, however, showed almost no diurnal variation in this period.
Diurnal variations in total VOC concentrations measured at all stations during winter campaign depicted a pattern similar to that observed during the summer campaign except for lower evening concentrations measured during the winter campaign. This is partly due to less traffic during evening hours in winter compared to daytime traffic load and partly due to daylight saving time application. In winter, the evening sampling period was between 8:00 p.m. and midnight, whereas in summer it was between 9:00 p.m. and 1:00 a.m. These sampling periods correspond to traffic rush hour in the city. Diurnal variability in total VOC concentrations in the background station was insignificant, as in the summer campaign.
Well-defined diurnal patterns observed at the roadside and residential stations demonstrate that VOC concentrations at these stations are controlled by traffic emissions during most of the measurement period. The lack of such a traffic pattern at the background station in both summer and winter demonstrates that in the outer parts of the city where traffic activity is not as high as that observed at residential and roadside sites, the VOC concentrations are not directly controlled by traffic emissions. In such areas, emissions from nontraffic sources, transport from more polluted parts of the city, particularly reactivity of individual VOCs, and meteorology can be more influential in determining observed VOCs levels.
Weekday-weekend variations.
The weekday-to-weekend ratios of selected VOCs at roadside, residential, and background stations are depicted in , for both summer and winter campaigns.
Figure 7. Weekday-to-weekend ratio for selected elements calculated for the roadside, residential, and background stations.
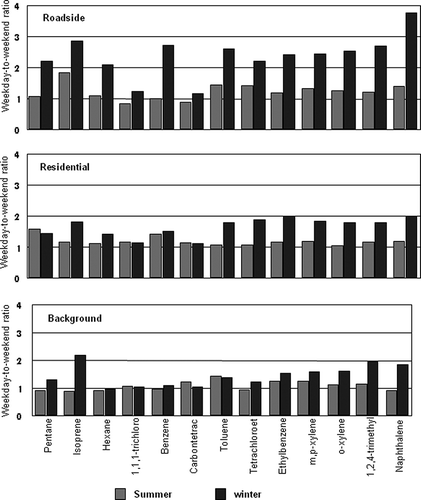
During the summer campaign, weekday concentrations of all measured VOCs are similar to their corresponding weekend concentrations at all stations with 95% statistical confidence. This observation agrees well with traffic counts, where number of vehicles counted during weekends is found to be similar to the number of vehicles counted on weekdays during the summer sampling campaign, as discussed previously. During the winter campaign, on the other hand, there are well-defined and statistically significant differences in both traffic counts and VOC concentrations, with higher VOC concentrations on the weekdays.
Similarities of weekend and weekday concentrations of VOCs in summer and their higher concentrations on weekdays during winter are also supported by weekday-to-weekend variations in concentrations of inorganic pollutants measured in the air quality network of the city. Data for inorganic pollutants, namely, NO and CO, were obtained from the Sıhhiye monitoring station, which is a residential station, fairly close to busy roads. Average weekday-to-weekend concentration ratio was 1.16 in the summer and 1.5 in winter for NO and 1.1 in summer and 1.45 in winter for CO. These ratios are fairly similar to VOC concentration ratios measured at our residential and background sites.
At the roadside station, winter concentrations of measured VOCs are factors of 2 to 3 higher during weekdays compared to their weekend concentrations, with 95% confidence. The only exception to this trend is observed in the concentrations of carbon tetrachloride and 1,1,1-trichloromethane. For these compounds, concentrations measured during weekdays are the same as their concentrations measured during weekends with 95% statistical confidence. Since traffic is the dominating source of VOCs at the roadside station, observed weekday–weekend difference can be explained by higher weekday traffic counts during winter campaign.
The weekday-to-weekend ratios of winter VOCs at the residential and background stations are also higher than unity for most VOCs and the difference is statistically significant at 95% confidence level. However, the difference between weekday and weekend concentrations is smaller than those observed at the roadside station, suggesting either higher contribution of nontraffic sources, which operate on both weekends and weekdays at the residential site, or less influence of weekday traffic on our residential station, which is not in the immediate vicinity of the roads with high traffic density. There are no significant VOC sources in the immediate vicinity of the background station. VOC concentrations observed in this station are transported from downtown Ankara and affected not only by the amount transported, but also by degradation of VOCs during transport. Since such a transport brings VOCs from residential areas in the city, observed weekday–weekend variation at the background site is expected to be similar with the variation in the residential sites.
The weekday–weekend variations in VOC concentrations measured in our three stations indicated that concentrations in all three stations are determined primarily by traffic emissions; however, the effect of motor vehicles is diluted by nontraffic sources at the residential and background sites.
Seasonal variations.
Winter-to-summer concentration ratios of 64 VOCs that are detected in more than 60% of the collected samples are given in for the roadside, residential, and background stations. For most compounds measured at the roadside station, winter concentrations are higher than or comparable to corresponding concentrations of VOCs measured during summer campaign. Summer and winter concentrations of VOCs measured at the residential station are similar with 95% statistical significance. The only exception to this general trend are c-3-methyl-2-pentane, 2-pentene, bromoform, styrene, and naphthaline, which have higher concentrations in winter. At the background station, with few exceptions, VOC concentrations measured in summer campaign are higher than those measured in winter.
Figure 8. Winter-to-summer concentration ratios of VOCs at (a) residential, (b) roadside, and (c) background stations.
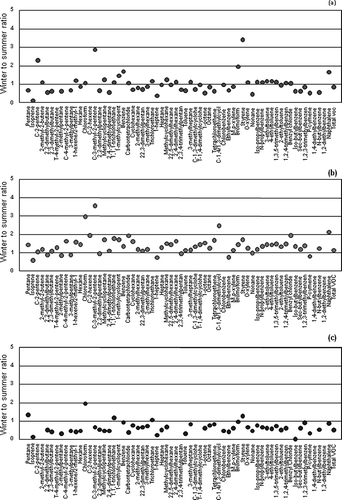
Average winter to summer concentration ratios of 64 VOCs at roadside, residential, and background stations are 1.45, 1.03, and 0.69, respectively. Higher winter VOCs concentrations measured at the roadside station can be explained by the higher number of motor vehicles passing by the station during winter, which is also observed in traffic counts. Similarity of summer and winter concentrations of VOCs at residential station is probably due to contribution of nontraffic sources, particularly evaporative ones, on the VOC concentrations measured at the residential site. On the other hand, observed higher VOC levels during summer at the background station can be due to better dispersion conditions prevailing during summer. This is supported by stability calculations, which were discussed previously. At a typical urban atmosphere, if emission of a species is the same in summer and winter, its concentrations tend to be higher in winter due to lower mixing height and poor ventilation conditions. However, these very same conditions also limit the dispersion and transport of pollutants to the background sites around the city. A similar pattern was also observed for the trace-element data generated at the same background site (CitationYatın et al., 2000).
Pentanes and butanes are dominant components of gasoline vapor; however, they are also observed in exhaust emissions as the unburned fraction of gasoline (CitationWatson et al., 2001; CitationDoskey et al., 1999; CitationConner, Lonneman, and Seila, 1995). Both pentanes and butanes (including n-pentane, 2,2-dimethylbutane, 2,3-dimethylbutane, 2-methylpentane, 3-methylpentane, 2,2-dimethylpentane, methylcyclopentane, 2,4-dimethylpentane, and 2,3-dimethylpentane) have higher winter concentrations at the roadside station, like all other exhaust markers in the data set. However, their concentrations at the residential and background stations are higher during summer. This probably demonstrates that various butane and pentane concentrations at sampling points that are not in the immediate vicinity of the roads are affected by evaporative emissions from parked cars or from gasoline stations in the city. Contribution of nontraffic sources on VOC concentrations measured at the residential station is also supported with the higher toluene concentration measured during the summer campaign. Toluene has well-documented nontraffic sources, such as paint and other solvent applications (CitationLiu et. al., 2008; CitationBuzcu and Fraser, 2006). Winter-to-summer ratios for toluene concentration at the roadside, residential, and background stations are 1.2, 0.7, and 0.4, respectively. Winter toluene concentration is higher at the roadside station, like all other traffic markers; however, toluene concentrations are higher at the residential station (P < 0.05) during summer, when evaporation is expected to be most effective.
The winter-to-summer ratio of isoprene concentrations is different from all other VOCs. The ratios at residential, background, and roadside stations are 0.12, 0.13, and 0.70, respectively. Isoprene is the VOC with the lowest winter-to-summer ratio in all three stations. Higher summer concentrations at all sites are statistically significant at the 90% confidence level (P < 0.10). Isoprene is a well-known marker for biogenic emissions, and increase in isoprene emissions from plants during summer is frequently reported in the literature (CitationWatson et al., 2001; CitationNa and Kim, 2001; CitationBorbon et al., 2001) and attributed to photosynthetic processes in plant leaves, which are enhanced by increase in solar flux and temperature (CitationGuenther et al., 2000). Isoprene is also emitted from motor vehicles (CitationBorbon et al., 2001; CitationBorbon et al., 2002). Although isoprene has higher concentrations during summer months at the roadside station as well, the ratio measured at the roadside station is significantly higher than the other two, which is probably due to isoprene emitted from motor vehicles.
Ratio analysis
Concentration ratios of species may be informative about the major sources contributing to VOC levels at the receptor. We have investigated the usefulness of two of these ratios for the data generated in this study.
The toluene-to-benzene ratio (TB ratio) in fresh exhaust emissions is reported to be approximately 2.0 (CitationChan et al., 2002; CitationGee and Sollars, 1998; Sagabiel et al., 1996; CitationScheff and Wadden, 1993). The median TB ratios in the ambient air and tunnel samples collected in Ankara are presented in . During both summer and winter periods, the TB ratios observed at roadside and tunnel stations are approximately 2.0 as indicated in the literature for vehicle exhaust sources. The ratio is similar for residential and background stations in both seasons. During the winter campaign, the TB ratios observed at residential and background stations are close to 2.0, indicating vehicles are the major source for VOCs at these sites. During the summer campaign, however, TB ratios observed at residential and background stations are about 4.5, indicating another source of toluene at these sites in addition to the motor vehicles. As reported in the previous studies, summer toluene sources can be wildfires in the background sites and gasoline evaporation in the residential sites (CitationKavouras and Zielinska, 2012). It should be noted that a similar conclusion (data generated at residential and background stations show the influence of nontraffic sources during summer) was also reached when temporal variations of VOC concentrations were discussed in previous sections.
Table 5. T:B and mp-X:E ratios measured during summer and winter campaignsat residential, road-side and background stations
The ratio of m,p-xylene to ethylbenzene (mpX:E) suggested by CitationNelson and Quickley (1983) is commonly used to investigate aging in air masses. Since atmospheric lifetimes of m,p-xylene and ethylbenzene are about 3 hr and 8 hr, respectively (CitationAtkinson, 1990), m,p-xylene disappears more rapidly than ethlybenzene through photochemistry, and the ratio decreases with aging. Thus, higher mpX :E ratio suggests fresh local emissions, whereas lower ratios are related to more photochemical activity and associated emissions from some distance (CitationMiller et al., 2011; CitationTiwari, Hanai, and Masunagh, 2010). Ratios expressed as “high” are generally reported as approximately 3.0. Previous studies has been demonstrated that lower mpX :E ratios (approximately between 1.0 and 1.5) are generally observed in the industrial area and higher ratios (approximately between 2.5 and 3.5) in the traffic area (CitationMiller et al., 2012; CitationMiller et al., 2011; CitationHsieh et al., 2011; CitationMonod et al., 2001).
The median mpX:E ratios observed at different sites in Ankara are presented in . During the winter sampling the ratios of mpX:E at the roadside and tunnel stations are approximately 4.3. A ratio close to 4.0 is also observed at the residential site. Evidently, these high ratios demonstrate a fresh air parcel in the environment of roadside and tunnel stations and come from vehicle emissions.
The mpX:E ratio measured at the background site is smaller than those recorded at the roadside and residential stations. These mpX:E ratio revealed the fact that photochemical reactions were still active in the background site and thus emissions in the area are probably due to distant sources. The mpX:E ratios in summer data are in two ways different from winter data: (1) The ratios observed in all three stations are smaller than corresponding ratios in winter. This is due to enhanced photochemistry and faster loss of m,p-xylene during summer. (2) The difference between the ratios in residential and background stations is larger in the summer campaign.
Comparable mpX:E ratios observed at the roadside and residential sites indicate that they are both under the influence of fresh emissions. A larger difference between background and other sites, on the other hand, reflects longer transport time from high emission areas in the city.
Conclusion
Temporal variation of VOC levels in Ankara, Turkey, and factors affecting these variations are discussed. Samples were collected at three different microenvironments, namely, a roadside location, a residential site, and a suburban site, which is referred to as background in the paper. Total VOC concentrations measured at the roadside station were approximately factors of 2 and 6 higher than the corresponding concentrations measured at residential and background sites, respectively. Diurnal variations of VOC concentrations measured at residential and roadside locations signaled the influence of traffic emissions on the observed values. Diurnal and seasonal variations demonstrated that roadside data are dominated by traffic influence both in summer and winter campaigns. The residential site is also under strong influence of traffic sources, but vehicles are not the only source determining VOC levels at the residential site. Concentrations of VOCs at the residential site are under clear influence of nontraffic sources, such as solvent evaporation, particularly in summer. Another key finding in the study is that the VOC levels measured at the background site are not emitted in close proximity to the city, but are transported from more polluted parts of Ankara. These results will be useful to develop control strategies for VOCs at Ankara.
Supplementary Material
Download Zip (422.7 KB)Acknowledgment
Dr. Semra G. Tuncel from Middle East Technical University provided GC/MSD laboratory facilities for the analyses. Gürkan Kuntasal, Ozan Aktan, Kutay Erbayat, and Mihriban Civan provided support during sampling and analysis. Dr. Azade Kentel, Ziya Sülünbe, and Dr. Bilgehan Ögel provided permits for sampling locations. The authors thank all for their contributions and key support in the collection of the data reported in this paper.
References
- Atkinson , R. 1990 . Gas phase tropospheric chemistry of organic compounds: review . Atmos. Environ. 24A , doi: 10.1016/0960-1686(90)90438-S
- Barletta , B. , Meinardi , S. , Simpson , I.J. , Khwaja , H.A. , Blake , D.R. and Rowland , F.S. 2002 . Mixing ratios of volatile organic compounds (VOCs) in the atmosphere of Karachi, Pakistan . Atmos. Environ. , 36 : 3429 – 3443 . doi: 10.1016/S1352-2310(02)00302-3
- Borbon , A. , Fontaine , H. , Veillerot , M. , Locoge , N. , Galloo , J.C. and Guillermo , R. 2001 . An investigation into the traffic-related fraction of isoprene at an urban location . Atmos. Environ. , 35 : 3749 – 3760 . doi: 10.1016/S1352-2310(01)00170-4
- Borbon , A. , Locoge , N. , Veillerot , M. , Galloo , J.C. and Guillermo , R. 2002 . Characterization of NMHCs in a French urban atmosphere: overview of the main sources . Sci. Total Environ. , 292 : 177 – 191 . doi: 10.1016/S0048-9697(01)01106-8
- Bravo , H. , Sosa , R. , Sanchez , P. , Bueno , E. and Gonzalez , L. 2002 . Concentrations of benzene and toluene in the atmosphere of the south western area at the Mexico City Metropolitan Zone . Atmos. Environ. , 36 : 3843 – 3849 . doi: 10.1016/S1352-2310(02)00292-3
- Buzcu , B. and Fraser , M. P. 2006 . Source identification and apportionment of volatile organic compounds in Houston, TX . Atmos. Environ. , 40 : 2385 – 2400 . doi: 10.1016/j.atmosenv.2005.12.020
- Çetin , E. , Odabaşı , M. and Seyfioğlu , R. 2003 . Ambient volatile organic compound (VOC) concentrations around a petrochemical complex and a petroleum refinery . Sci. Total Environ. , 312 : 103 – 112 . doi: 10.1016/S0048-9697(03)00197-9
- Chan , C.Y. , Chan , L.Y. , Wang , X.M. , Liu , Y.M. , Lee , S.C. , Zou , S.C. , Sheng , G.Y. and Fu , J.M. 2002 . Volatile organic compounds in roadside microenvironments of metropolitan Hong Kong . Atmos. Environ. , 36 : 2039 – 2047 . doi: 10.1016/S1352-2310(02)00097-3
- Cheng , L. , Fu , L. , Angle , R.P. , Sandhu , H.S. and 7 , doi:10.1016/1352-2310(96)00170- . 1997 . Seasonal variations of volatile organic compounds in Edmonton, Alberta . Atmos. Environ. , 31 : 239 – 246 .
- Civan , M.Y. , Kuntasal , Ö.O. and Tuncel , G. 2011 . Source apportionment of ambient volatile organic compounds in Bursa, a heavily industrialized city in Turkey . Environ. Forens. , 12 : 357 – 370 . doi: 10.1080/15275922.2011.622345
- Conner , T.L. , Lonneman , W.A. and Seila , R.L. 1995 . Transportation related volatile hydrocarbon source profiles measured in Atlanta . J. Air Waste Manage. Assoc , 45 : 383 – 394 . doi: 10.1080/10473289.1995.10467370
- Demir , S. , Saral , A. , şık , D. I , Akyildiz , A. , Kuzu , S.L. , Mert , S. , Demir , G. and Goncaloglu , B. I. Characterization of ambient volatile organic compounds and their diurnal variations in istanbul, Turkey . Fresenius Environ. Bull. , 20 ( 11 ) 2951 – 2958 .
- Derwent , R.G. , Davies , T.J. , Delaney , M. , Dollard , G.J. , Field , R.A. , Dumitrean , P. , Nason , P.D. , Jones , B.M.R. and Pepler , S.A. 2000 . Analysis and interpretation of the continuous hourly monitoring data for C2–C8 hydrocarbons at 12 United Kingdom sites during 1996 . Atmos. Environ. , 34 : 297 – 312 . doi: 10.1016/S1352-2310(99)00203-4
- Derwent , R.G. , Middleton , D.R. , Field , R.A. , Goldstone , M.E. , Lester , J.N. and Perry , R. 1995 . Analysis and interpretation of air quality data from an urban roadside locations in central London over the period from July 1991 to July 1992 . Atmos. Environ. , 29 : 923 – 946 . doi: 10.1016/1352-2310(94)00219-B
- Doskey , P.V. , Fukui , Y. , Sultan , M. , Maghraby , A.A. and Taher , A. 1999 . Source profiles for non-methane organic compounds in the atmosphere of Cairo. Egypt . J. Air Waste Manage. Assoc. , 49 : 814 – 822 . doi: 10.1080/10473289.1999.10463850
- Edwards , R.D. , Jurvelin , J. , Saarela , K. and Jantunen , M. 2001 . VOC concentrations measured in personal samples and residential indoor, outdoor and workplace microenvironments in EXPOLIS-Helsinki, Finland . Atmos. Environ. , 35 : 4531 – 4543 . doi: 10.1016/S1352-2310(01)00230-8
- Elbir , T. , Cetin , B. , Cetin , E. , Bayram , A. and Odabasi , M. 2007 . Characterization of volatile organic compounds (VOCs) and their sources in the air of Izmir, Turkey . Environ. Monit. Assess. , 133 : 149 – 160 . doi: 10.1007/s10661-006-9568-z
- Finlayson-Pitts , B.J. and Pitts , J.N. 1993 . atmospheric chemistry of tropospheric ozone formation: Scientific and regulatory implications . J. Air Waste Manage. Assoc. , 43 : 1091 – 1100 . doi: 10.1080/1073161X.1993.10467187
- Gee , I.L. and Sollars , C.J. 1998 . Ambient air levels of volatile organic compounds in Latin American and Asian cities . Chemosphere , 36 : 2497 – 2506 . doi: 10.1016/S0045-6535(97)10217-X
- Genc , D. D. , Yesilyurt , C. and Tuncel , G. 2010 . Air pollution forecasting in Ankara, Turkey using air pollution index and its relation to assimilative capacity of the atmosphere . Environ. Monit. Assess. , 166 ( 1–4 ) : 11 – 27 . doi: 10.1007/s10661-009-0981-y
- Goyal , S. K. and Rao , C. C. V. 2007 . Assessment of atmospheric assimilation potential for industrial development in an urban environment: Kochi (India) . Sci. Total Environ. 376(1–3) , : 27 – 39 . doi: 10.1016/j.scitotenv.2007.01.067
- Guenther , A. , Geron , C. , Pierce , T. , Lamb , B. , Harley , P. and Fall , R. 2000 . Natural emissions of non-methane volatile organic compounds, carbon monoxide, and oxides of nitrogen from North America . Atmos. Environ. , 34 : 2205 – 2230 . doi: 10.1016/S1352-2310(99)00465-3
- Hsieh , L.T. , Wang , Y.F. , Yang , H.H. and Mi , H.H. 2011 . Measurements and Correlations of MTBE and BETX in Traffic Tunnels . Aerosol Air Qual. Res. , 11 : 763 – 775 . doi: 10.4209/aaqr.2011.03.0035
- Kavouras , G.I. and Zielinska , B. 2012 . The effects of fuel evaporation and biomass burning on toluene concentrations in an urban area . Water Air Soil Pollut. , 223 : 5931 – 5940 . doi: 10.1007/s11270-012-1329-8
- Kuczkowski , K.M. 2006 . Mothballs and obstetric anesthesia . Ann Fr Anesth Reanim. , 25 : 464 – 465 . doi: 10.1016/j.annfar.2005.11.006
- Kuntasal , O.O. 2005 . Organic composition of particles and gases in the Ankara atmosphere , Ankara : Unpublished Ph.D. thesis, METU .
- Kuntasal , O. O. , Karman , D. , Wang , D. , Tuncel , S.G. and Tuncel , G. 2005 . Determination of volatile organic compounds in different microenvironments by multibed adsorption and short-path thermal desorption followed by GC-MS analysis . J. Chromatogr. A , 1099 : 43 – 54 . doi: 10.1016/j.chroma.2005.08.093
- Lippmann , M. 1991 . Health effects of tropospheric ozone . Environ. Sci. Technol. , 25 : 1954 – 1962 . doi: 10.1021/es00024a001
- Liu , C. , Xu , Z. , Du , Y. and Guo , H. 2000 . Analyses of volatile organic compounds concentrations and variation trends in the air of Changchun, the northeast of China . Atmos. Environ. , 34 : 4459 – 4466 . doi: 10.1016/S1352-2310(00)00102-3
- Liu , Y. , Shao , M. and Tang , D. 2008 . Source profiles of volatile organic compounds (VOCs) measured in China: Part I . Atmos. Environ. , 42 : 6247 – 6260 . L. FuS. LuL. Zengdoi:10.1016/j.atmosenv.2008.01.070
- Mastral , A.M. , Callen , M.S. , Lopez , J.M. , Murillo , R. , Garcia , T. and Navarro , M.V. 2003 . Critical review on atmospheric PAH: Assessment of reported data in the Mediterranean basin . Fuel Process. Technol. , 80 : 183 – 193 . doi: 10.1016/S0378-3820(02)00249-7
- Miller , L. , Xu , X. , Wheeler , A. , Atari , D.O. , Mannion , A. and Luginaah , I. 2011 . Spatial variability and application of ratios between BTEX in two Canadian cities . Sci. World J. , 11 : 2536 – 2549 . doi: 10.1100/2011/167973
- Miller , L. , Xu , X. , Mannion , A. , Brook , J. and Wheeler , A. 2012 . Multi-season, multi-year concentrations and correlations amongst the BTEX group of VOCs in an urbanized industrial city . Atmos. Environ. , 61 : 305 – 315 . doi: 10.1016/j.atmosenv.2012.07.041
- Millet , D. , Goldstein , A.H. , Allan , J.D. , Bates , T.S. , Boudries , H. , Bower , K.N. , Coe , H. , Ma , Y. , McKay , M. , Quinn , P.K. , Sullivan , A. , Weber , R.J. and Worsnop , D.R. 2004 . Volatile organic compound measurements at Trinidad Head, California, during ITCT 2K2: Analysis of sources, atmospheric composition, and aerosol residence times . J. Geophys. Res. , 109 ( D23 ) : 1 – 16 . doi: 10.1029/2003JK004026
- Monod , A. , Sive , B.C. , Avino , P. , Chen , T. , Blake , D.B. and Rowland , F.S. 2001 . Monoaromatic compounds in ambient air of various cities: a focus on correlations between the xylenes and ethylbenzene . Atmos. Environ. , 35 : 135 – 149 . doi: 10.1016/S1352-2310(00)00274-0
- Müezzinoğlu , A. , Odabaşı , M. and Onat , L. 2001 . Volatile organic compounds in the air of Izmir, Turkey . Atmos. Environ. , 35 : 753 – 760 . doi: 10.1016/S1352-2310(00)00420-9
- Na , K. and Kim , Y.P. 2001 . Seasonal characteristics of ambient volatile organic compounds in Seoul, Korea . Atmos. Environ. , 35 : 2603 – 2614 . doi: 10.1016/S1352-2310(00)00464-7
- Na , K. , Kim , Y.P. and Moon , K.C. 2003 . Diurnal characteristics of volatile organic compounds in the Seoul atmosphere . Atmos. Environ. , 37 : 733 – 742 . doi: 10.1016/S1352-2310(02)00956-1
- Na , K. , Kim , Y.P. , Moon , I. , Moon , K.C. and 010 , doi:10.1016/j.chemosphere.2004.01. 2004 . Chemical composition of VOC major emission sources in the Seoul atmosphere . Chemosphere , 55 : 585 – 594 .
- Nazaroff , W. and Weschler , C.J. 2004 . Cleaning products and air fresheners: Exposure to primary and secondary air pollutants . Atmos. Environ. , 38 : 2841 – 2865 . doi: 10.1016/j.atmosenv.2004.02.040
- Nelson , P.F. and Quigley , S.M. 1983 . The m,p-xylene:ethylbenzene ratio. A technique for estimating hydrocarbon age in ambient atmosphere . Atmos. Environ. , 17 : 659 – 662 . doi: 10.1016/0004-6981(83)90141-5
- Pankow , J.F. , Luo , W. , Bender , D.A. , Isabelle , L.M. , Hollingsworth , J.S. , Chen , C. , Asher , W.E. and Zogorski , J.S. 2003 . Concentrations and co-occurrence correlations of 88 volatile organic compounds (VOCs) in the ambient air of 13 semi-rural to urban locations in the United States . Atmos. Environ. , 37 : 5023 – 5046 . doi: 10.1016/j.atmosenv.2003.08.006
- Pasquill , F. 1974 . Atmospheric diffusion , 2nd , New York , NY : John Wiley and Sons .
- Paul , J. September 1997 . Improved air quality on Turkish roads: Fuels and exhaust gas treatment. Paper presented at the 10th regional IUAPPA conference , September , 23 – 26 . Istanbul , , Turkey : Environmental Research Forum . 1997
- Sagebiel , J.C. , Zielinska , B. , Pierson , W.R. and Gertler , A.W. 1996 . Real-world emissions and calculated reactivities of organic species from motor vehicles . Atmos. Environ. , 30 : 2287 – 2296 . doi: 10.1016/1352-2310(95)00117-4
- Scheff , C.W. and Wadden , R.A. 1993 . Receptor modeling of volatile organic compounds. 1. Emission inventory and validation . Environ. Sci. Technol. , 27 : 617 – 625 . doi: 10.1021/es00041a005
- Scheff , P.A. , Wadden , R.S. , Bates , B.A. and Aronian , P.F. 1989 . Source fingerprints for receptor modeling of volatile organics . J. Air Pollut. Control Assoc. , 39 : 469 – 478 . doi: 10.1080/08940630.1989.10466546
- Srivastava , A. , Joseph , A.E. , Patil , S. , More , A. , Dixit , R.C. and Prakash , M. 2005 . Air toxics in ambient air of Delhi . Atmos. Environ. , 39 : 59 – 71 . doi: 10.1016/j.atmosenv.2004.09.053
- State Statistical Institute . 1998 . Energy consumption in residences , Ankara , , Turkey : State Statistical Institute .
- State Statistical Institute . 2004 . Statistical book of motor vehicles , Ankara , , Turkey : State Statistical Institute .
- Tiwari , V. , Hanai , Y. and Masunaga , S. 2010 . Ambient levels of volatile organic compounds in the vicinity of petrochemical industrial area of Yokohama, Japan . Air Qual. Atmos. Health , 3 : 65 – 75 . doi: 10.1007/s11869-009-0052-0
- U.S. Environmental Protection Agency . 1990 . “ Cancer risk from outdoor exposure to air toxics. Vol. 1 Final report ” . In Research Triangle Park , NC , U.S : Environmental Protection Agency . Office of air Quality Planning and Standards Research. EPA 450/1-90-004a
- U.S. Environmental Protection Agency . 1999 . “ PCRAMMET user's guide ” . In Research Triangle Park , NC , U.S : Environmental Protection Agency . Office of Air Quality Planning and Standards, Emissions, Monitoring, and Analysis Division Research. EPA-454/B-96-001
- Wang , D. , Fuentes , J.D. , Travers , D. , Dann , T. and Connolly , T. 2005 . Non-methane hydrocarbons and carbonyls in the Lower Fraser Valley during PASIFIC 2001 . Atmos. Environ. , 39 : 5261 – 272 . doi: 10.1016/j.atmosenv.2005.05.035
- Wang , X.M. , Sheng , G.Y. , Fu , J.M. , Chan , C.Y , Lee , S.C. , Chan , L.Y. and Wang , Z.S. 2002 . Urban roadside aromatic hydrocarbons in three cities of the Pearl River Delta, People's Republic of China . Atmos. Environ. , 36 : 5141 – 5148 . doi: 10.1016/S1352-2310(02)00640-4
- Watson , J.G. , Chow , J.C. and Fujita , E.M. 2001 . Review of volatile organic compound source apportionment by chemical mass balance . Atmos. Environ , 35 : 1567 – 1584 . doi: 10.1016/S1352-2310(00)00461-1
- Yang , K.L. , Ting , C.C. , Wang , J.L. , Wingenter , O.W. and Chan , C.C. 2005 . Diurnal and seasonal cycles of ozone precursors observed from continuous measurement at an urban site in Taiwan . Atmos. Environ. , 39 : 3221 – 3230 . doi: 10.1016/j.atmosenv.2005.02.003
- Yatın , M. , Tuncel , S. , Aras , N.K. , Olmez , I. , Aygun , S. and Tuncel , G. 2000 . Atmospheric trace elements in Ankara, Turkey: 1. Factors affecting chemical composition of fine particles . Atmos. Environ. , 34 : 1305 – 1318 . doi: 10.1016/S1352-2310(98)00297-0
- Yurdakul , S. , Civan , M. and Tuncel , G. 2012 . Volatile organic compounds in suburban Ankara atmosphere, Turkey: Sources and variability . Atmos. Res. , 120–121 : 298 – 311 . doi: 10.1016/j.atmosres.2012.09.015