
Abstract
The measurement of volatile organic compound (VOC) emissions from building products and materials by manufacturers and testing laboratories, and the use of the test results for labeling programs, continue to expand. One issue that hinders wide acceptance for chamber product testing is the lack of a reference material to validate test chamber performance. To meet this need, the National Institute of Standards and Technology (NIST) and Virginia Tech (VT) have developed a prototype reference material that emits a single VOC similar to the emissions of a diffusion-controlled building product source with a dynamic emissions profile. The prototype material has undergone extensive testing at NIST and a pilot interlaboratory study (ILS) with four laboratories. The next development step is an evaluation of the prototype source in multiple-sized chambers of 14 laboratories in seven countries. Each laboratory was provided duplicate specimens and a test protocol. Study results identified significant issues related to the need to store the source at a subzero Celsius temperature until tested and possible inconsistencies in large chambers. For laboratories using a small chamber and meeting all the test method criteria, the results were very encouraging with relative standard deviations ranging from 5% to 10% across the laboratories.
Implications:
Currently, the chamber performance of laboratories conducting product VOC emissions testing is assessed through interlaboratory studies (ILS) using a source with an unknown emission rate. As a result, laboratory proficiency can only be based on the mean and standard deviation of emission rates measured by the participating ILS laboratories. A reference material with a known emission rate has the potential to provide an independent assessment of laboratory performance as well as improve the quality of interlaboratory studies. Several international laboratories with different chamber testing systems demonstrated the ability to measure the emission rate of such a reference material within an acceptable measurement uncertainty.
Introduction
Product emissions testing has evolved since the late 1970s (Levin, Citation2004). Currently, there are more than 100 laboratories worldwide conducting emissions tests in environmental chambers, many with unique testing equipment and analytical techniques. While it is not necessary for every laboratory to use the same type of chamber or analytical equipment, it is important for each laboratory to demonstrate that it can measure product emission rates within an acceptable uncertainty (Zimmerman, Citation2010). Validating the equivalence among laboratories conducting material emission chamber tests is typically achieved through a “laboratory-performance” type of interlaboratory study (ILS) (IUPAC, Citation1994). A central organization distributes a material to participating laboratories, which follow a multistep process to measure the material’s emission rate of specific chemicals in their chambers (ASTM, Citation2010; ISO, Citation2006). At this time, an ILS has been required to determine laboratory equivalence because the emission rate of the distributed material source is not independently known. As a result, the ILS mean emission rate and associated standard deviation are often used to establish a z-score for individual laboratories. Typically a z-score greater than 3 (or less than –3) is considered an outlier (Luko, Citation2011). A recent German Federal Institute for Materials Research Testing (BAM) ILS to measure emissions from a homogeneous lacquer, considered laboratories successful if 80% of measured chemical chamber concentrations had z-scores between –2 and 2 (BAM, Citation2010).
The expanded use of interlaboratory studies among laboratories conducting material emission chamber tests has led to reductions in the variability between laboratories. In the early 1990s, the typical relative standard deviation between laboratories was around 40% to 50% (Howard-Reed and Nabinger, Citation2006). Today, an ILS with a relatively homogeneous source that generates chamber concentrations greater than 20 μg/m3 can achieve relative standard deviations between laboratories less than 20% (Yrieix et al., Citation2010). While interlaboratory studies are useful for many purposes, relying on interlaboratory studies alone to qualify laboratories for specific labeling programs can be time-consuming and expensive. The organization of a laboratory-performance ILS involves recruiting laboratories, developing test procedures, distributing a source material, and analyzing the results. In addition, interlaboratory studies are often conducted in multiple phases where a laboratory’s analytical and sampling techniques are evaluated prior to the actual chamber test. For example, a three-phase BAM ILS was conducted over a period of 2 years (Wilke et al., Citation2009). In addition, an ILS with a material that has an unknown emission rate can only identify outliers (e.g., z-score analysis) and not the accuracy of individual laboratories’ test results.
One way to improve the quality of interlaboratory studies, as well as provide an independent assessment of chamber performance, is through the use of a reference material with a known emission rate. A reference material is generally defined as a “material, sufficiently homogeneous and stable with respect to one or more specified properties, which has been established to be fit for its intended use in a measurement process” (ISO, Citation2008). The associated reference value can be determined through an independent test method or through measurements at one or more laboratories (May et al., Citation2000).
The National Institute of Standards and Technology (NIST) and Virginia Tech (VT) have created a prototype reference material that has the potential to improve the evaluation of laboratory chamber performance. The prototype material consists of a thin polymethyl pentene (PMP) film that has been loaded to equilibrium with toluene. Extensive laboratory testing at NIST and other labs has shown the film to behave as a homogeneous material with a dynamic emission profile similar to that of a “dry” diffusion-controlled building material (e.g., vinyl flooring) (Cox et al., Citation2010; Howard-Reed et al., Citation2011a). Multiple films have been produced in a single batch with no discernible emission rate differences (Howard-Reed et al., Citation2011b). In addition, the method to create the films is reproducible with little variation between production batches (Howard-Reed et al., Citation2011a). This material also has the advantage of an independently determined emission rate based on material/chemical properties and a fundamental mass transfer model (Cox et al., Citation2010). As long as the film is stored at subzero Celsius temperatures, the shelf life has been shown to exceed 180 days (Howard-Reed et al., Citation2011c).
Although the reference material has the potential to provide an independent assessment of laboratory chamber performance, a “material certification” ILS is a valuable tool to evaluate the performance of a prototype reference material under development (IUPAC Citation1994). For example, as already described , measurements by multiple competent laboratories also comprise a common option to establish the reference emission rate value for the source. In 2010, a pilot interlaboratory study was conducted to examine the performance of the film in four different laboratories (Howard-Reed et al., Citation2011a). Results from that study showed the PMP film to perform consistently in different laboratories with a relative standard deviation of 9% for chamber air concentrations measured at 48 hr. In addition, the mean concentration measured at 48 hr for all laboratories was within 1% of the model predicted value.
As a follow-up to the pilot ILS, an interlaboratory study was designed to expand the number of participants to include 14 laboratories in the following countries: Canada, China, Denmark, Finland, France, Germany, and the United States. The objectives of this recent ILS include: (1) to increase the number of collaborators to provide more scrutiny of the test procedure; (2) to evaluate the performance of the reference film and associated model to predict its emission rate in larger size chambers (volume greater than 0.2 m3); and (3) to work toward establishing global harmonization of emissions testing validation methods.
Methods
Participating laboratories
In total, 14 laboratories participated in this ILS. Each laboratory had a different size chamber, leading to the division of the participating laboratories into two groups. The first group (small chamber group, SCG) consisted of 10 laboratories with chambers ranging in size from 0.024 m3 to 0.12 m3. The second group (large chamber group, LCG) consisted of 4 laboratories with chambers ranging in size from 0.225 m3 to 1.0 m3. Each laboratory was asked to run two reference material tests using the same chamber. SCG laboratories received one film per test for a total of two films and LCG laboratories received two films per test for a total of four films.
Reference film preparation
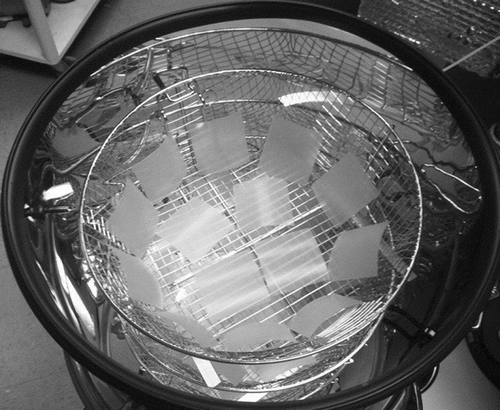
The reference films used in this study were loaded in a single batch at Virginia Tech. The loading method has been described elsewhere (Cox et al., Citation2010; Howard-Reed et al., Citation2011a). For this particular study, in total, 42 polymer films (6 ± 0.01 cm × 6 ± 0.01 cm) were cut from a single, 0.0254-cm-thick sheet of polymethyl pentene (PMP) and placed in a 36-L stainless steel container. The films were distributed within the container in three layers using wire-mesh baskets to create tiers (). No films were overlapping inside the container. Once placed in the container, the films were exposed to a toluene-laden gas stream at a constant concentration of 1.6 μg /m3 as generated by a gas calibrator with a mass flow controller. The container exhaust stream was passed through a high-resolution (0.1 μg) dynamic microbalance where a single film (3.6 cm × 3.6 cm × 0.0254 cm) was also loaded. This extra film served as an indicator of when equilibrium was reached for the films in the container, as well as the amount of mass gained during the loading process. For this study, the total mass loaded on the film in the microbalance was 750 ± 19 μg.
Figure 1. Reference film tiered loading chamber.
After about 14 days, the microbalance data indicated that sorption equilibrium for the films was obtained. The packaging process involves removing a single film from the container and quickly wrapping it in a double layer of aluminum foil. The wrapped sample was then placed in a sealable plastic bag and labeled. The bags were placed in coolers with dry ice, and were sent by overnight delivery to the participant laboratories. Although all packages were shipped on the same day, delivery times varied due to variations in the processing schedules of different customs authorities in the participating countries. It took up to 16 days for one laboratory to receive samples. Due to these delays, three of the 14 laboratories received samples with no dry ice remaining in the cooler. In addition, one laboratory unfortunately stored its samples in a refrigerator rather than in a freezer.
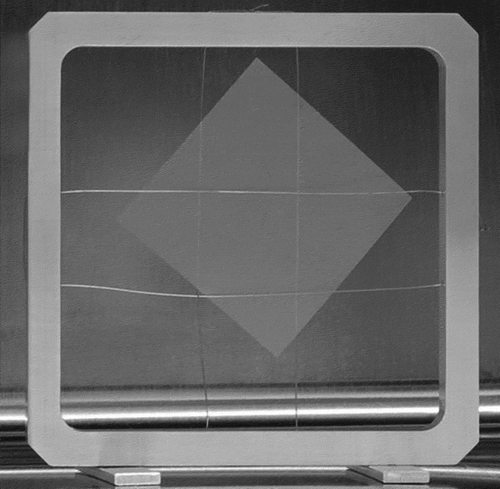
Each laboratory received at least one film from the middle tier of the loading vessel. The remainder of the films were randomly distributed to the different laboratories. NIST received a reference film from each tier of the loading container (three films total) to check for differences between tiers. For this study, the NIST data (Laboratory F) are identified in the results. The other laboratories are identified as Laboratory A, B, C, and so on. Aluminum specimen holders were also distributed to each laboratory for use in its chambers. Based on results from the previous ILS with the prototype film (Howard-Reed et al., Citation2011a), the specimen holder was designed to expose both sides of the film as shown in . For the most part, the holder worked well. However, one laboratory reported a film dropping from the holder during a test.
Figure 2. Sample holder with reference film.
Chamber test method
The chamber test method included specific instructions for sample preparation and chamber operation. Sample preparation instructions included removing the sample from the freezer, keeping the sample in the sealed bag for 5 min at room temperature, unwrapping the sample and placing it in the sample holder near the center of the chamber, and sealing the chamber. Due to possible loss of toluene once the film is exposed to the surrounding air, participants were asked to record the time it took to complete each step. The start time for each test was the time the sample was unwrapped. All samples were run within 45 days of manufacture, which limited the impact of sample age on test results (Howard-Reed et al., Citation2011c).
The chamber operation set points for both small and large chambers are provided in . Use of a mixing fan during the test was not specified. For this ILS, two small chamber laboratories and all four large chamber laboratories operated a mixing fan during the test. Prior to starting each test, the chamber background concentration of toluene was verified to be less than 2 μg/m3. Laboratories were asked to collect duplicate chamber air samples at 24 hr, 48 hr, and 72 hr. Four of the 14 laboratories collected air samples at additional time points to those that were specified.
Table 1. Chamber set points for reference material test method
The collection and analysis of chamber air samples was left to the discretion of each laboratory, based on its established protocols. All but one laboratory collected air samples on sorbent tubes and analyzed them by thermal desorption gas chromatography/mass spectrometry (TD/GC/MS). The other laboratory used a canister sampling system. As an analytical check, NIST distributed a liquid calibration standard (100 ng/μL toluene in methanol) to each laboratory for assessment of analytical performance. However, not all laboratories used this standard for their analytical calibration. As a result, measured emission rates included variation due to chamber operation as well as analytical calibration. Three laboratories also used their own internal standards. Reported minimum detection levels for toluene were less than or equal to 10 ng for all participating laboratories.
Model prediction of individual chamber emission rates
The emission of toluene from the reference material for different chamber sizes and configurations can be predicted using a mechanistic mass-transfer model (Cox et al., Citation2010; Liu et al., 2011). The principle of the model and the method used to obtain the model parameters are briefly summarized here. The emission of a VOC from a homogeneous dry material to a well-mixed chamber includes internal diffusion within the material, characterized by the diffusion coefficient (D), partition between the air and the material at the their interface, characterized by the partition coefficient (K), and the convective mass transfer near the material surface, which can be neglected for a diffusion-controlled reference material (Cox et al., Citation2010). When surface area (A), thickness of the material (L), volume (V), and airflow rate (Q) of the chamber are known, and assuming a uniform initial VOC concentration in the material (C0), the chamber air concentration, y, can be predicted over time.
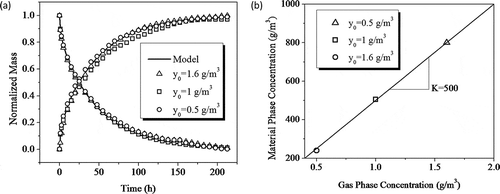
The model parameters include D, K, C0, and other directly measurable parameters (A, L, V, and Q). C0 is derived from the total mass increase of the film monitored by the microbalance during loading, which resulted in a film concentration of 2,300 μg/cm3 for this production batch. The coefficients D and K are determined via independent microbalance sorption and desorption tests: recording the mass change when passing dry air with toluene through a glass chamber containing a clean PMP sample until partition equilibrium is reached (sorption) and then passing dry toluene-free air through the sample chamber (desorption) (Cox et al., Citation2010). As shown in , the microbalance tests were performed under three different gas concentrations. By fitting a Fickian diffusion model to the sorption and desorption data, D of toluene in PMP was determined to be (3.6 ± 0.7) × 10−14 m2/sec at 23ºC and independent of concentration. Also from the sorption data, the material-phase concentrations in equilibrium with the corresponding gas concentrations were obtained, and K was found to be 500 ± 30 from the linear correlation between the gas-phase and material-phase concentrations in equilibrium ().
Figure 3. Determination of D and K from microbalance tests. (a) Fitting a Fickian diffusion model to the sorption and desorption data to get D. (b) Determining K by linear regression.
Results
This ILS was designed to evaluate the test procedure and the performance of the prototype reference film in a wide range of laboratory chamber environments. As described earlier, the participating laboratories were divided into two groups based on chamber size used for the ILS. Ten laboratories were grouped as small chambers and the remaining four were considered large chambers. Due to the differences between the operating conditions of the chamber groups, the resulting toluene chamber concentrations are presented separately in the following.
Small chamber group results
The small chamber group consisted of 10 laboratories with chamber sizes ranging from 0.024 m3 to 0.12 m3. Each laboratory was given two films to run in separate chamber tests following the method described earlier. shows each laboratory’s reported conditions during each test. As indicated in , all 10 labs were able to run both prototype films, each in a separate test (Test 1 and Test 2). However, a few laboratories were not able to carry out the test protocol exactly as written. For example, to ensure a consistent level of toluene in each film, the specimens need to be maintained at a subzero Celsius temperature. A shipping issue with a customs office resulted in Laboratory H not receiving samples on dry ice. Laboratory J received the samples with dry ice, but inadvertently stored them in a laboratory refrigerator rather than a freezer.
Table 2. Reported SCG laboratory compliance of test method specifications
While most laboratories were able to operate their chambers at the specified setpoints, there were some deviations. For example, a few laboratories operated their chambers at a slightly lower airflow rate than specified. Since a small difference in airflow is not expected to change the film emission rate, but has a known linear effect on the toluene chamber concentration, it is possible to normalize all of the results by the reported airflow value. For example, Laboratory D’s reported airflow was 0.049 m3/hr, so its resulting chamber concentrations were adjusted by a ratio of 0.049 m3/h / 0.055 m3/h or 0.89. The reported average temperature and relative humidity during a chamber test ranged from 22.5°C to 24.2°C and from 45.0% to 51.8%, respectively. The effects of temperature and relative humidity deviations on the film emission rate are not well understood, so these relatively small deviations were not corrected when comparing the data.
Another slight deviation between laboratories was the actual chamber air sampling times. Although laboratories were asked to collect chamber air samples at 24 hr, 48 hr, and 72 hr after the start of the experiment, actual collection times varied and some laboratories collected additional samples near those times. To leverage these multiple observations collected near the requested sampling times and to provide a measurement value at each precise requested sampling time, a linear regression model was used to predict a concentration value at the requested sampling times. The regression model was fit for each laboratory and sample to include observations taken within ±5 hr of the time point of interest. The predicted measurement value at the precise requested sampling times allowed the concentrations for each sample for each laboratory to be combined and an overall associated uncertainty determined.
Finally, laboratories B and C discovered an analytical problem subsequent to the ILS that affected their results. As a result, the reported measured values for these laboratories reflect an analytical correction, but are not included in the analysis with the other results that meet all of the specifications.
Other differences worth noting but not used as reasons to disqualify data include sample age and use of a mixing fan. Since laboratories were not instructed to run samples at specific times, a range of film sample ages were used. Most laboratories ran both samples within 14 days of manufacture. Previous tests have shown sample age to not be a significant factor for films as old as 180 days at sampling times >24 hr (Howard-Reed et al., Citation2011c). Previous tests have also shown a mixing fan to not influence the toluene concentration in a small chamber (Howard-Reed et al., Citation2011a).
Based on these reported inconsistencies, a subset of the SCG laboratories was identified that met all of the ILS specifications. This group includes Laboratory A, Laboratory E, Laboratory F (NIST), Laboratory G, and Laboratory I. Interestingly, all but one of these laboratories had used the reference film in a chamber test prior to this study. Thus, it appears that previous experience may help a laboratory to meet all the test method requirements.
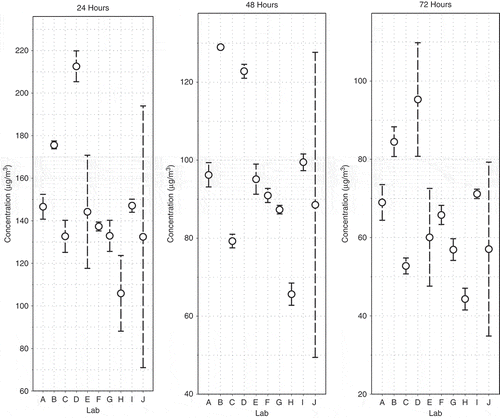
The average toluene consensus concentrations measured at 24 hr, 48 hr, and 72 hr in each SCG laboratory test are provided in . Table 3 also includes the expanded uncertainty for each sample point based on sample collection, measurement replication, uncertainties due to calibration, and uncertainties due to instrument accuracy. In most cases, over half of the combined standard uncertainty was attributed to the calibration and precision of the analytical equipment. shows the average toluene concentration () for each laboratory at each sampling time with the associated within-laboratory variation based on the standard deviation (sr) of replicate tests (ASTM, Citation2013). Most within-laboratory standard deviations (sr) were less than 10% and more than half of them were less than 5%. Laboratory J experienced the highest within-laboratory variation; however, the discrepancy between sample results may be explained by the storage of samples in a refrigerator rather than a freezer. The apparent loss of toluene in the reference film between Laboratory J’s tests further illustrate the importance of keeping the films at subzero Celsius conditions.
Table 3. Small chamber group toluene concentrations at specified sampling time
Figure 4. Average concentration over all samples for each laboratory for target times 24, 48, and 72 hr. The error bars displayed are one standard deviation of the sample adjusted concentrations.
Using all the data from the ILS, the SCG values between laboratory relative standard deviations are 19.7% at the 24 hr and 48 hr sampling times and 23.1% at the 72 hr sampling time (). The highlighted value for Laboratory D in represents a reported value that is greater than two standard deviations from the other data and is a suspected outlier. If this data point is removed from the between laboratory comparison, the relative standard deviation is approximately 13% for the 24 hr sampling points. If the subset of five laboratories identified to have met all of the test method criteria is used, the relative standard deviations are 5% at 24 hr and 48 hr, and 10% at 72 hr. For comparison, RSD values reported in the pilot ILS with four laboratories were 15% at 24 hr and 9.4% at 48 hr (Howard-Reed et al., Citation2011a).
Another way to view the ILS replicate results is with a Youden plot (Youden, Citation1959). The Youden plots in show both the within-laboratory and between-laboratory variability of the ILS by plotting the value of one of the measurements on the horizontal axis and the value of the replicate measurement on the vertical axis for each sampling time point. Each plot character represents a single laboratory. Since Laboratory F (NIST) provided measurements on three sample films, rather than a single point, its results are displayed as three points described by the following data pairs: sample 1–sample 2; sample 1–sample 3; and sample 2–sample 3.
Figure 5. Youden plots for each sampling time point. The plotting characters represent the laboratories. The vertical line is the median value for sample 1 and the horizontal line is the median value for sample 2. The circle is a 95% confidence circle with a radius equal to 2.448 times the estimated standard deviation for a single result.
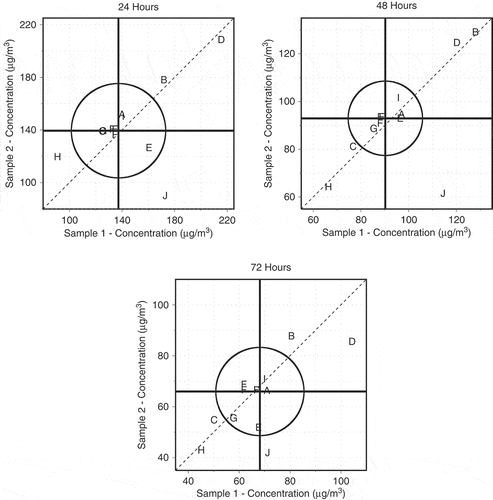
Several annotations are included on the Youden plots: a 45-degree reference line, vertical and horizontal median lines, and a 95% confidence circle. Due to the storage issues discovered for Laboratory J, those values were not considered in the calculations of the median lines and the confidence circles. The vertical and horizontal median lines are the medians of the Sample 1 and Sample 2 values, respectively. The intersection of the two median lines is called the Manhattan median. The 95% confidence circle centered at the Manhattan median is calculated such that approximately 95% of the laboratories should be expected to fall within if the laboratories were able to eliminate all bias or constant errors.
In , a large range of measured concentrations at 24 hr is observed (89 μg/m3 for Laboratory J to 218 μg/m3 for Laboratory D). However, the median values for sample 1 and sample 2 were within 2%. While most laboratories appear near the diagonal indicating reasonable within-laboratory repeatability, laboratories J, E, and H exhibit issues with within-laboratory repeatability as they appear off the diagonal. The measurements in laboratories A, C, F, G, and I are in relative agreement near 140 μg/m3. Laboratory E may also be included in this group, though some within-laboratory repeatability issues are present. Laboratory H appears biased low, and laboratories B and D biased high.
The measurements at the 48-hr time point in display less overall variability with a range of 61 μg/m3 (Laboratory J) to 130 μg/m3 (Laboratory B). A noteworthy result is the low level of within-laboratory variability (standard deviation = 2.48) observed at 48 hr versus 24 hr and 72 hr. At the 48-hr sampling point, Laboratory J is the only laboratory to display an issue with within-laboratory repeatability (observations off the diagonal), again due to a potential storage issue. Laboratories A, E, F, G, and I display measurements that are in relative agreement, whereas Laboratory H appears to be biased low and laboratories B and D biased high.
The measurements at the 72-hr time point again display less overall variability than the 24-hr time point with a range of 41 μg/m3 (Laboratory J) to 106 μg/m3 (Laboratory D). At this sampling time point, laboratories J, D, and E again appear off the diagonal. Laboratories A, F, and I appear to be within reasonable agreement. As with the 24-hr and 48-hr time points, Laboratory H appears biased low, and laboratories B and D biased high.
Large chamber group results
While the reference prototype film has been extensively tested in small-scale chambers, it had never been used in a chamber larger than 0.086 m3 prior to this study. As a result, this ILS provided an opportunity to evaluate the prototype film’s performance in four large chambers ranging in size from 0.225 m3 to 1.0 m3. To increase the toluene concentration in the chamber to a more easily measured range, two films were provided for each chamber test.
shows the reported chamber operating values for each large chamber group laboratory. As shown in , all laboratories were able to run both tests and meet the specified chamber set points within 1% for temperature and airflow, and within 8% for relative humidity. However, two laboratories (K and N) did not receive samples with dry ice, again due to an unexpected delay with custom authorities. None of the LCG laboratories had previous experience working with the reference film.
Table 4. Reported LCG laboratory compliance of test method specifications
The average toluene consensus concentrations measured at 24 hr, 48 hr, and 72 hr and associated expanded uncertainty in each LCG laboratory test are provided in . shows the average toluene concentration () for each laboratory at each sampling time with the associated within-laboratory variation based on the standard deviation (sr) of replicate tests (ASTM, Citation2013). More than half of the within-laboratory standard deviations were less than 10%.
Table 5. Large chamber group toluene concentrations at specified sampling time
Figure 6. Large chamber group toluene concentrations measured at 24 hr, 48 hr, and 72 hr. The error bars displayed are one standard deviation of the sample adjusted concentrations.
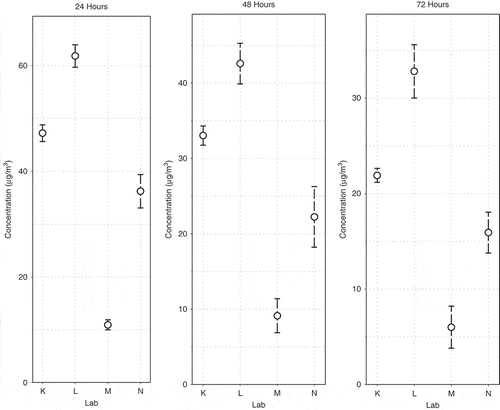
Using all the LCG data reported in the ILS, the LCG between-laboratory relative standard deviations were 54.9% at the 24-hr sampling time, 53.8% at the 48-hr sampling time, and 57.5% at the 72-hr sampling time (), about twice as large as the RSD for the SCG laboratories. Laboratory K and Laboratory N did not receive samples with dry ice, which may explain their lower measured levels versus Laboratory L. However, it is not clear why Laboratory M measured low concentrations for both tests.
Reference material performance
Although previous specimen loadings were determined to be homogeneous, this was the first time that as many as 42 samples were loaded simultaneously. is a series of block plots (Filliben et al., Citation1993) that show the resulting chamber concentrations measured at 24 hr, 48 hr, and 72 hr by each SCG laboratory. The plotting characters (1, 2, and 3) correspond to the three different tiers at which the samples were produced. In this plot, the values have been scaled by removing the effect of each laboratory to focus on the within-laboratory variability, and more importantly, the relative order of the tier values across laboratories. If there were no difference between the specimen loadings of tier 1 and tier 2, for example, then we would expect to see tier 1 as the higher concentration in approximately 50% of all the tier 1–tier 2 pairs in (i.e., laboratories C, D, E, F, and I). In other words, under the hypothesis of specimen loading homogeneity, tier 1 displaying the higher concentration can be described by a Bernoulli random variable with parameters n equal to the number of tier 1–tier 2 pairs and p = 0.5. By applying this concept to each possible tier i–tier j pair (i, j = 1, 2, 3, i ≠ j), a conclusion of the overall specimen loading homogeneity can be made.
Figure 7. Block plot for production tier (plotting characters) at 24 hr, 48 hr, and 72 hr.
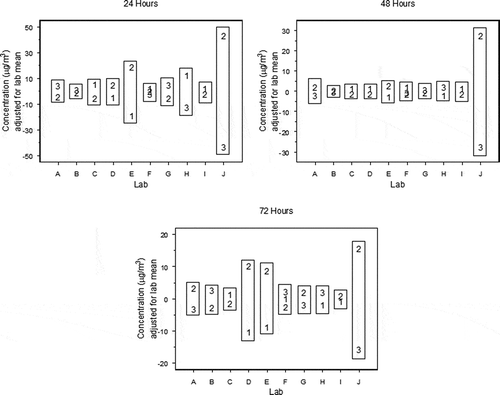
shows the frequency of each tier’s samples resulting in a higher chamber concentration for all tier i–tier j pairs. If the loading process introduced sample heterogeneities, the probability that one tier is higher than another would be significantly different from 50%. As shown in , the p-values associated with the test that the binomial parameter p is equal to 0.5 are all >0.05, indicating the loading process resulted in relatively homogeneous samples.
Table 6. Frequencies of the relative order of the production tiers across SCG laboratories for each sample time point
Model results
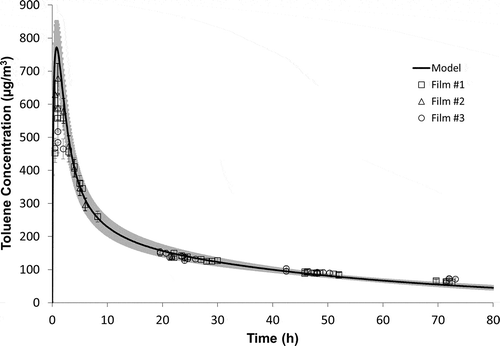
Another advantage of this reference material is the associated mechanistic mass transfer model that can independently predict the VOC emissions rate of the reference source. shows the NIST measured data compared to the model prediction. The model predicts chamber air concentrations within 5% at sampling times between 5 hr and 48 hr.
Figure 8. NIST measured data compared to model prediction. Gray shadow represents model uncertainty.
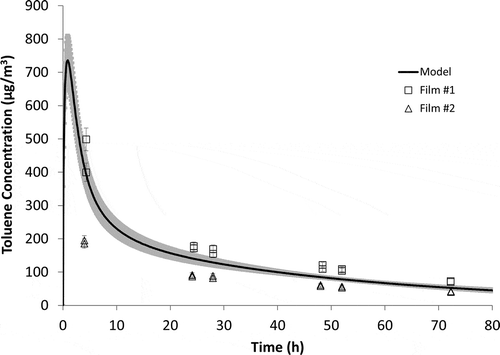
As in previous studies (Cox et al., Citation2010; Howard-Reed et al., Citation2011a), the model has helped to diagnose potential measurement issues for certain laboratories. For example, there was a significant difference between the chamber concentrations measured for the two different samples sent to Laboratory J. If there had not been an ILS with other laboratories reaching a mean value, it would be unclear which of Laboratory J’s two measured chamber concentrations was closer to the “true” value. shows that film 1 from Laboratory J was a better match to the model predicted values, especially for the early time points. This information helps to identify the source of the measurement issue, which in this case, as discussed earlier, was a warmer than prescribed storage temperature.
Figure 9. Use of mechanistic mass transfer model to diagnose measurement discrepancies for Laboratory J during reference material emissions testing. Gray shadow represents model uncertainty.
Approximating the emission rate value for the film
Although determining the film’s reference emission rate was not an objective of this ILS, it is interesting to compare emission rates predicted by different laboratories and the model (see ). One way to compare concentration results across laboratories using different chamber airflows is with a mass balance model. Using this mass balance model and measured concentrations at single time points, a film’s emission rate may be approximated using the following pseudo-steady-state equation:
Figure 10. Comparison of reference source emission rate average values.
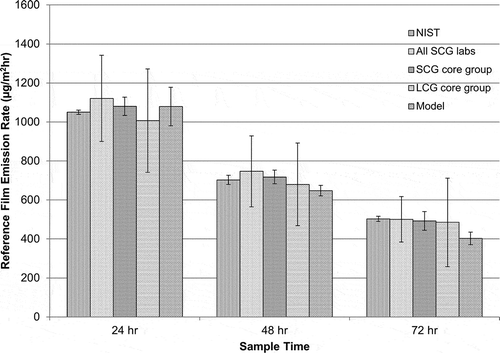
It should be noted that the emission rate of the reference material is changing with time (especially at the 24-hr sample point), which introduces some error to the estimation of Ess, t. Using the NIST data and a numerical solution to the chamber mass balance equation, this error was estimated to be less than 5% at the 24-hr sample point, and approximately 1–2% at the later sample points. The average NIST emission rate using eq 1 and measured chamber toluene concentrations from three replicate measurements are 1050 ± 11 μg/m2-hr at 24 hr, 703 ± 23 μg/m2-hr at 48 hr, and 503 ± 13 μg/m2-hr at 72 hr.
also shows the average emission rate value based on measurements of multiple laboratories. For the subset of all SCG laboratories that met all of the ILS requirements (including NIST), the reference emission rate value would be 1080 ± 47 μg/m2-hr at 24 hr, 718 ± 35 μg/m2-hr at 48 hr, and 492 ± 48 μg/m2-hr at 72 hr. If the low values are removed, the large chamber values are 1007 ± 265 μg/m2-hr at 24 hr, 680 ± 212 μg/m2-hr at 48 hr, and 485 ± 170 μg/m2-hr at 72 hr.
Finally, the mass transfer model described earlier can provide an independent prediction of the film’s emission rate. For the conditions specified for the ILS, the model predicted the following emission rates for the film: 1079 ± 99 μg/m2-hr at 24 hr, 648 ± 27 μg/m2-hr at 48 hr, and 403 ± 32 μg/m2-hr at 72 hr.
As shown in , each approach predicts a similar mean emission rate value for the film at each sampling time point. The notable difference between the methods to predict an emission rate value is the size of the error bars, which reflect the variation between different groups of laboratories.
Conclusion
This international interlaboratory study was an essential step for moving the prototype reference material closer to production and acceptance as a reference material by testing laboratories. The 2010 pilot study design (Howard-Reed et al., Citation2011a) was expanded by including more test laboratories from several countries, and including large chambers as well as small chambers. As a result, new lessons were learned regarding shipping and handling procedures and test chamber dynamics. It was also apparent that most laboratories that participated in the 2010 pilot study had improved performance in this study over the laboratories that were using the reference film for the first time. The larger number of participants also allowed for additional statistical analyses that determined a 95% confidence circle for reference material chamber concentration results.
For the most part, the material behaved as expected in a homogeneous manner with a consistent reference emission rate. Laboratories were able to follow the test method instructions, with a few exceptions. The most significant issue was not a laboratory issue, but rather the difficulty keeping the film at subzero temperatures prior to testing. The presence of dry ice slowed processing of the shipment in a few countries, and made it nearly impossible for one. Lower measured concentration results for these laboratories further confirmed expectations that these films may lose toluene when not kept frozen. As a result, an alternative shipping and storage approach may be necessary to ensure global distribution of the reference material. Research is currently underway to investigate alternative approaches.
Based on the limited results of this ILS, it is unclear whether the film can be used successfully in large chambers. Half of the laboratories in this group were affected by the shipping issues, reducing the size of the data set to two laboratories. As a result, more testing of the prototype films in large chambers is required.
The small chamber results showed promise for establishing a reference emission rate value for the toluene films. There was little difference between the emission rate measured by NIST and that measured by a subset of experienced laboratories. It is expected that either approach, establishment by NIST or a consensus value among qualified testing laboratories, would be acceptable for assigning a reference value to the final product with an associated uncertainty less than 10%. As a result, we are closer to the production of toluene reference films that can be distributed to laboratories to check chamber emissions performance.
Acknowledgment
The authors are extremely grateful to the following laboratories that expended personal resources to participate in this interlaboratory study, as well as providing valuable data and feedback: Air Quality Sciences (USA), BAM Federal Institute for Materials Research and Testing (Germany), Bayer MaterialScience LLC (USA), Berkeley Analytical Associates, LLC (USA), California Department of Public Health (USA), Centre Scientifique et Technique du Bâtiment (France), Danish Technological Institute (Denmark), Eurofins (Denmark), National Research Council Canada (Canada), Tsinghua University (China), U.S. Environmental Protection Agency (USA), VTT Technical Research Centre of Finland (Finland), Fraunhofer Wilhelm-Klauditz-Institut (Germany). The authors also appreciate the assistance of Michelle Neese, Sylvester Greer, Steven Nabinger, and Andy Persily of NIST, as well as the helpful review comments by Robert Zarr of NIST.
Additional information
Notes on contributors
Cynthia Howard-Reed
Cynthia Howard-Reed conducted this work while an environmental engineer in the Indoor Air Quality and Ventilation Group at the National Institute of Standards and Technology, Gaithersburg, MD.
Zhe Liu
Zhe Liu conducted this work while a graduate student in the Department of Civil and Environmental Engineering at Virginia Tech, Blacksburg, VA.
Steven Cox
Steven Cox is a visiting assistant professor in the Department of Civil and Environmental Engineering at Virginia Tech, Blacksburg, VA.
Dennis Leber
Dennis Leber and Dan Samarov are statisticians at the National Institute of Standards and Technology in Gaithersburg, MD.
Dan Samarov
Dennis Leber and Dan Samarov are statisticians at the National Institute of Standards and Technology in Gaithersburg, MD.
John C. Little
John C. Little is the Charles Edward Via, Jr. Professor of Civil and Environmental Engineering at Virginia Tech, Blacksburg, VA.
References
- ASTM. 2010. ASTM Standard D5116-2010, Standard Guide for Small-scale Environmental Chamber Determination of Organic Emissions from Indoor Materials/Products. West Conshohocken, PA: ASTM International.
- ASTM. 2013. ASTM Standard E291, Standard Practice for Conducting an Interlaboratory Study to Determine the Precision of a Test Method. West Conshohocken, PA: ASTM International.
- BAM Federal Institute for Materials Research and Testing (W. Horn, O. Wilke, and K. Wiegner). 2010. Results of RR-VOC-BAM_2009. General External Quality Management System for the Determination of Relevant Chemical Compounds from the Emission of Products or in Indoor Air. Berlin, Germany.
- Cox, S.S., Z. Liu, J.C. Little, C. Howard-Reed, S.J. Nabinger, and A. Persily. 2010. Diffusion-controlled reference material for VOC emissions testing: Proof of concept. Indoor Air 20:424–33. doi:10.1111/j.1600-0668.2010.00666.x
- Filliben, J., S. Cetinkunt, W. Yu, and A. Dommenz. 1993. Exploratory data analysis techniques as applied to a high-precision turning machine. In Quality Through Engineering Design, eds. W. Kuo and M. Martens Person, 199–223. New York, NY: Elsevier.
- Howard-Reed, C., Z. Liu, J. Benning, S. Cox, D. Samarov, D. Leber, A.T. Hodgson, S. Mason, D. Won, and J.C. Little. 2011a. Diffusion-controlled reference material for volatile organic compound emissions testing: Pilot inter-laboratory study. Building Environ. 46:1504–11. doi:10.1016/j.buildenv.2011.01.024
- Howard-Reed, C., Z. Liu, S. Cox, J. Little, W. Horn, O. Wilke, K. Wiegner, and A. Persily. 2011b. Inter-laboratory study approach to validate the performance of a prototype reference material for product emissions testing. Paper presented at the 12th International Conference on Indoor Air Quality and Climate, Austin, TX, June.
- Howard-Reed, C., Z. Liu, S. Cox, D. Samarov, D. Leber, and J. Little. 2011c. Assessing the shelf-life of a prototype reference material for product emissions testing. Paper presented at the 12th International Conference on Indoor Air Quality and Climate, Austin, TX, June.
- Howard-Reed C., and S.J. Nabinger. 2006. Developing a standard reference material for VOC emissions testing. Paper presented at the Indoor Environmental Quality: Problems, Research and Solutions Conference, EPA/AWMA, Research Triangle Park, NC, July.
- ISO. 2008. ISO Guide 30:1992(E)/Amd.1:2008, Terms and Definitions Used in Connection with Reference Materials. Geneva, Switzerland: International Organization for Standardization.
- ISO. 2006. ISO Standard 16000-9:2006, Determination of the Emission of Volatile Organic Compounds From Building Products and Furnishing—Emission Test Chamber Method. Geneva, Switzerland: International Organization for Standardization.
- IUPAC. 1994. Nomenclature of interlaboratory analytical studies. Pure Appl. Chem. 66:1903–11.
- Levin, H. 2004. Indoor source emissions testing: State of the science and the art. Paper presented at the ASTM Conference on Indoor Emissions Testing—Methods and Interpretation, ASTM D22.05, Washington, DC, October 4–5.
- Luko, S. N. 2011. What are z-scores? A simple but useful statistical computation. ASTM Standardization News, March/April: 18–19.
- May, W., R. Parris, C. Beck, J. Fassett, R. Greenberg, F. Guenther, G. Kramer, S. Wise, T. Gills, J. Colbert, R. Gettings, and B. MacDonald. 2000. Definitions of terms and modes used at NIST for value-assignment of reference materials for chemical measurements. NIST Special Publication 260-136, Gaithersburg, MD: National Institute of Standards and Technology.
- Wilke, O., W. Horn, K. Wiegner, O. Jann, W. Bremser, D. Brodner, S. Kalus, R. Juritsch, and C. Till. 2009. Investigations for the improvement of the measurement of volatile organic compounds from floor coverings within the health-related evaluation of construction products. BAM Federal Institute for Materials Research and Testing, Research Number ZP 52-5-20.49.1-1251/07; March, Berlin, Germany.
- Youden, W.J. 1959. Graphical diagnosis of interlaboratory test results. Industrial Quality Control XV(11): 133-1–137-5.
- Yrieix, C., A. Dulaurent, C. Laffargue, F. Maupetit, T. Pacary, and E. Uhde. 2010. Characterization of VOC and formaldehyde emissions from a wood based panel: Results from an inter-laboratory comparison. Chemosphere 79: 414–419. doi:10.1016/j.chemosphere.2010.01.062
- Zimmerman, R.L., Jr. 2010. Ten best practices of good laboratories. ASTM Standardization News, November/December: 25–31.