Abstract
Human exposures to criteria and hazardous air pollutants (HAPs) in urban areas vary greatly due to temporal-spatial variations in emissions, changing meteorology, varying proximity to sources, as well as due to building, vehicle, and other environmental characteristics that influence the amounts of ambient pollutants that penetrate or infiltrate into these microenvironments. Consequently, the exposure estimates derived from central-site ambient measurements are uncertain and tend to underestimate actual exposures. The Exposure Classification Project (ECP) was conducted to measure pollutant concentrations for common urban microenvironments (MEs) for use in evaluating the results of regulatory human exposure models. Nearly 500 sets of measurements were made in three Los Angeles County communities during fall 2008, winter 2009, and summer 2009. MEs included in-vehicle, near-road, outdoor, and indoor locations accessible to the general public. Contemporaneous 1- to 15-min average personal breathing zone concentrations of carbon monoxide (CO), carbon dioxide (CO2), volatile organic compounds (VOCs), nitric oxide (NO), nitrogen oxides (NOx), particulate matter (<2.5 μm diameter; PM2.5) mass, ultrafine particle (UFP; <100 nm diameter) number, black carbon (BC), speciated HAPs (e.g., benzene, toluene, ethylbenzene, xylenes [BTEX], 1,3-butadiene), and ozone (O3) were measured continuously. In-vehicle and inside/outside measurements were made in various passenger vehicle types and in public buildings to estimate penetration or infiltration factors. A large fraction of the observed pollutant concentrations for on-road MEs, especially near diesel trucks, was unrelated to ambient measurements at nearby monitors. Comparisons of ME concentrations estimated using the median ME/ambient ratio versus regression slopes and intercepts indicate that the regression approach may be more accurate for on-road MEs. Ranges in the ME/ambient ratios among ME categories were generally greater than differences among the three communities for the same ME category, suggesting that the ME proximity factors may be more broadly applicable to urban MEs.
Implications:
Estimates of population exposure to air pollutants extrapolated from ambient measurements at ambient fixed site monitors or exposure surrogates are prone to uncertainty. This study measured concentrations of mobile source air toxics (MSAT) and related criteria pollutants within in-vehicle, outdoor near-road, and indoor urban MEs to provide multipollutant ME measurements that can be used to calibrate regulatory exposure models.
Introduction
Exposures to criteria and hazardous air pollutants within an urban area can vary greatly due to varying proximity to emission sources, their magnitudes, and specific mixes of emission sources. Meteorological conditions also affect the dispersion and dilution of emissions. The presence of physical features (e.g., building types and ages, noise barriers, sunken roadways, elevated highways, urban canyons) can inhibit or enhance the infiltration capacity of pollutants. Furthermore, the degree of ventilation affects pollution infiltration into vehicle cabins and indoor MEs. Although central-site ambient monitors do not account for the influences of these factors on ambient pollutant concentrations, numerous epidemiology health studies have used such measurements to characterize population air pollution exposures. Much of the spatial variations of ambient air pollutants and the degree of potential exposure misclassification (i.e., differences between estimated exposure and true exposure) are associated with proximity to vehicular or local stationary source emissions. The impact of exposure misclassification on health study results depends on the acute or chronic design of the epidemiological study and the pollutant averaging period (Özkaynak et al., Citation2013; Sarnat et al., Citation2013; Baxter et al., Citation2013).
Microenvironments in close proximity to vehicular emissions are of particular concern because motor vehicles are typically the largest source of volatile organic compounds (VOCs) and particulate matter (PM) emissions in urban areas. Studies find that commuting individuals are exposed to elevated levels of VOCs, PM of <2.5 μm diameter (PM2.5), and ultrafine particles (UFPs) (Wallace, Citation1987; Chan et al., Citation1991; Weisel et al., Citation1992; Jo and Choi, Citation1996; Duffy and Nelson, Citation1997; Jo and Park; 1999; Leung and Harrison, Citation1999: Westerdahl et al., Citation2005; Fujita et al., Citation2007a, Citation2011; Özkaynak et al., Citation2008). Since traffic-related pollutants disperse rapidly (Zhu et al., Citation2002), creating sharp gradients in pollutant concentrations near major roadways, pollutant concentrations on and near roadways can be substantially higher than indicated by data from neighborhood-scale air quality monitoring sites or predicted concentrations from grid-based air quality simulation models. On-road concentrations of nitrogen oxides (NOx), carbon monoxide (CO), and VOCs are typically a factor of 2–4 higher than the community average ambient concentrations (Fujita et al., Citation2003, Citation2013). The presence of diesel vehicles may increase these ratios by as much as a factor of 10 for NOx and BC (Fujita et al., Citation2011; Westerdahl et al., Citation2005). The corresponding ratios for PM2.5 are often relatively lower due to proportionally larger contributions of secondary aerosols (e.g., ammonium nitrate, ammonium sulfate, secondary organic aerosol) and wind-blown dust (Fujita et al., Citation2007a).
U.S. Environmental Protection Agency (EPA) regulatory population-based human exposure models such as the Hazardous Air Pollution Exposure Model (HAPEM) (Rosenbaum and Huang, Citation2007) and the Air Pollution Exposure model (APEX) (EPA, 2008) simulate the movement of specific population groups through defined microenvironments (MEs). The APEX model evaluates comparative exposures to criteria pollutants expected to occur under existing and proposed National Ambient Air Quality Standards (NAAQS). These models account for the differences in ambient concentrations measured at a fixed-site monitor and the specific MEs by applying scaling factors for different categories of MEs. This approach assumes that pollutant concentrations at MEs are linearly related to the neighborhood-scale ambient measurements by constant multiplicative factors. This simplifying assumption is based on the observations that the relationship between ME concentration and ambient concentration tends to be more linear as averaging times increase (Dockery and Spengler, Citation1981). Recent studies have demonstrated the limitations of relying alone on central-cite ambient data and the importance of applying exposure modeling methods incorporating time-activity, home-work/school commuting, and indoor/near-road/outdoor exposure factor data for estimating population pollutant exposures in health studies (Özkaynak et al., Citation2008, 2013; Sarnat et al., Citation2013; Baxter et al., Citation2013).
The Exposure Classification Project (ECP) was conducted to measure concentrations of mobile source air toxics (MSAT) and related criteria pollutants within in-vehicle, outdoor near-road, and indoor urban MEs to provide multipollutant ME measurements that can be used to calibrate regulatory exposure models, and EPA is considering ECP ME ozone data to evaluate APEX (Fujita and Campbell, Citation2013; Johnson, Citation2012). Similar evaluations may be carried out for the other pollutants measured during the ECP. This paper summarizes these ME measurements and characterizes variations in the derived microenvironmental proximity (PROX) and penetration (PEN) factors by pollutant and ME category.
Experimental Methods
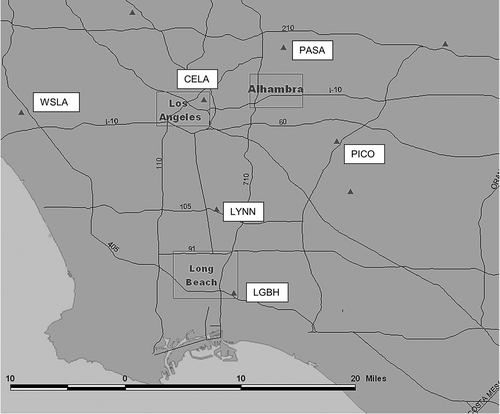
Microenvironmental measurements were made during three field campaigns in the Los Angeles metropolitan area () within the communities of Carson/Long Beach (industrial suburb), downtown Los Angeles (urban center), and Alhambra (residential suburb). Carson and Long Beach are adjacent communities located in southwestern Los Angeles County. This area is located several kilometers north of the Ports of Long Beach and Los Angeles, which together constitute the largest port complex in the country. The local traffic mix includes predominantly light-duty gasoline-powered vehicles on the other major freeway (I-405) in the area. Downtown Los Angeles is surrounded by several of the most heavily congested freeways in the area, SR-110, I-10, and US-101. The high density of tall buildings and associated urban canyons in the area along with the greater vehicular and pedestrian traffic results in elevated exposures to mobile source criteria and air toxic pollutants. Traffic in the downtown area consists predominantly of light-duty gasoline vehicles, since most buses are powered by compressed natural gas (CNG). Alhambra is a suburban residential community interlinked by major arterial streets with strings of strip malls. The I-10 freeway cuts through the area with a moderate flow of heavy-duty diesel trucks, but the traffic mix is predominantly light-duty gasoline vehicles, especially during commuting periods.
Figure 1. Microenvironments measurements were made in the communities indicated by the three rectangles, Los Angeles, Alhambra, and Long Beach. Triangles indicate locations of SCAQMD air monitoring stations.
Microenvironmental measurements
The ME measurements were made during fall (September 13 to October 8, 2008), winter (February 23 to March 19, 2009), and summer (July 14 to July 23, 2009). Personal breathing zone concentrations of PM2.5 mass, UFP number, black carbon (BC), benzene, toluene, ethylbenzene, xylenes (BTEX), 1,3-butadiene, and related pollutants (CO, carbon dioxide [CO2], VOCs, nitric oxide [NO], NOx, and ozone [O3]) were measured in the following ME categories: freeways with high proportion of diesel trucks (e.g., I-710); freeways with predominantly gasoline vehicles (I-405 and SR-110); surface arterial streets (e.g., urban canyons and commercial strips) and residential streets; outdoor locations near roadways (pedestrian sidewalks, bus stops, street-side cafes); outdoor areas away from traffic (e.g., parks and school playgrounds); and indoor locations that are accessible to the general public (e.g., shopping malls, grocery/retail stores, restaurants, underground garages, community centers). We successfully sampled in a variety of indoor environments, including a shopping mall with a food court, a community center with large auditorium and conference center, super markets, professional office buildings, a university campus student union with a food court, a natural science building, fast food restaurants, apartment buildings, hotels, underground garages, large public buildings, and a post office.
A portable cart-mounted monitoring system was developed for measuring pollutant concentrations in both indoor and outdoor locations. This system included the following continuous monitoring instruments: 2B Technologies (Boulder, CO) model 205 for O3 and model 400 for NO; TSI Qtrak for CO, CO2, temperature (T), and relative humidity (RH) (Shoreview, MN); RAE Systems ppbRAE for VOCs (San Jose, CA); TSI DustTrak for PM2.5 mass (Shoreview, MN); Desert Research Institute/University of Nevada Reno (DRI/UNR) portable photoacoustic instrument for BC (Arnott et al., Citation1999, Citation2000, Citation2005a, Citation2005b; Kirchstetter, Citation2007; Kirchstetter and Novakov, Citation2007); Hal Technologies HPC-600 (Fontana, CA) optical particle counter for fine particle size distributions; and a Kanomax 3800 (Andover, NJ) condensation particle counter for UFP counts. We also collected 15-min polydimethylsiloxane solid-phase microextraction (SPME) absorbent fiber samples for 1,3-butadiene and BTEX (Ceballos et al., Citation2007). The cart could be easily loaded into a vehicle (1996 Dodge Grand Caravan) for on-road sampling or transport without interrupting data collection. Power for all instruments was supplied by 12 V DC AGM batteries or the van’s alternator. A portable computer and digital data logging system (Azeotech DaqFactory/Labjack U12; Ashland, OR) recorded and displayed PM, NO, NOx, O3, UFP, and VOC readings along with global positioning system (GPS) data at 10-sec intervals. The Qtrak, OPC, and photoacoustic instrument logged data to their own internal data storage. Due to the Qtrak’s relatively slow response rate and baseline sensitivity to temperature, an EPA-certified CO monitor (Monitor Labs 9830) was also operated in the van to more accurately capture rapid changes in concentration during on-road measurements; a 2B Technologies model 401 NOx monitor was also included in the van. lists the measurements that were made by general ME category and sampling platform, and Tables S1 and S2 provide information on the technical specifications for each of the monitors. The project final report document the lessons learned during the field study and provide study design and measurement recommendations.
Table 1. List of measurements made in the monitoring van, portable cart-mounted sampling system, and briefcasea
Total NOx could not be measured in many MEs due to the power requirements of the heated NO2 converter; however, the comparison with monitoring station data is made for NOx to account for atmospheric conversion of NO during transport from source to site. For the purpose of the correlation, NOx equals 1.1 × NO (measured in the ME) + NO2 measured at the nearest air monitoring station. Gasoline and older technology diesel vehicles emit NO2 as 5–10% of total NOx. Newer 2007 compliant diesel vehicles with diesel particulate filters (DPFs) emit as much as 50–60% as NO2 (Bishop and Stedman, Citation2008; Bishop et al., Citation2010). However, significant compliant diesel fleet turnover had not occurred at the time of the 2008–2009 field measurements in this study.
Personal breathing zone pollutant concentrations were measured during a predetermined sequence of MEs. Sampling times within each ME ranged from 10 to 20 min depending on the nature of the exposure event. The sequences of ME measurements were repeated at least three times within each community on separate days. Table S3 lists the individual MEs, assigned ME categories, and corresponding activity pattern codes used in the Consolidated Human Activity Database (CHAD) (EPA, 2013) and ME codes used in recent applications of the EPA Air Pollution Exposure Model (APEX). The microenvironment locations in the Carson area are shown in Figure S1 and Figure S2. Figure S3 and Figure S4 show ME locations in the downtown Los Angeles area, and Figure S5 shows the locations in Alhambra. The green, red, and blue symbols indicate outdoor, indoor, and in-vehicle MEs, respectively. ME locations within each community were selected in two clusters, one within about 1 km from the nearest freeway and a second cluster further away. On-road measurements were made as part of the sequences of ME measurements in Carson/Long Beach, downtown Los Angeles, and Alhambra/Monterey Park. On-road pollutant concentrations were measured on various types of roads with varying traffic conditions and mixes of diesel and gasoline vehicles using a mobile monitoring system operated inside a well-ventilated van (windows open, fan on, and recirculation off). Indoor measurements were accompanied by corresponding measurements made outside the building at approximately the same time in order to estimate indoor/outdoor concentration ratios. During the second (February–March 2009) field study, we added an option to make measurements using a briefcase containing a QTrak (CO, CO2), a DustTrak (PM2.5), and time-integrated SPME (BTEX) samples, which allowed access to a wider range of indoor MEs.
The measurements were made during times of the day that generally coincided with peaks in expected temporal patterns of activity in each ME. Measurements were made during relatively short periods of peak activity for some MEs (e.g., morning and afternoon commuting periods, fast food restaurant during the noon lunch hour) and during a broader window of time for other MEs (surface streets, near-road, outdoor, and indoor). Measurements and activity information were recorded on the field data sheet. The measurement locations were continually recorded with a GPS, and traffic conditions were documented for on-road measurements using a video camera mounted on the dashboard. Temperature, RH, and wind speed were typically measured for a minimum of 3 min for outdoor microenvironments. When relevant, distances were measured with a laser range finder.
The ME CO and NOx measurements were compared with the corresponding data from selected South Coast Air Quality Management District (SCAQMD) ambient air quality monitoring stations appropriate for each ME. The factor method for estimating pollutant exposures assumes that the pollutant concentrations measured in MEs (Cme) are related to the corresponding fixed monitoring station data (Camb) using the following formula:
PROX factors were derived for CO and NOx by normalizing the ME measurements to the corresponding data from the neighborhood- or urban-scale SCAQMD air quality monitoring stations in Long Beach for MEs in Carson and Long Beach, and the central Los Angeles monitoring station for MEs in downtown Los Angeles and Alhambra. From PROX factors derived for NOx and CO, correlations were used to establish whether CO or NOx can be used as surrogate measures for other MSATs that are not frequently measured at air quality monitoring stations. Ozone measured in this study was analyzed and reported separately (Johnson, Citation2012). Subsequent detailed O3 ME evaluations have been reported by Johnson et al. (2013) who corrected for positive bias in monitors used in this investigation (Spicer et al., Citation2010). Recent measurements of building O3 penetration/deposition rates have also indicated over-/underestimations of these parameters within current APEX indoor O3 ME models (Stephens et al., Citation2012).
Table 2. Median PROX factors, MR to fixed site ratios, linear regression statistics, and penetration factors by ME category
Roadway gradient measurements
Both fixed-site and mobile measurements were used to determine pollutant concentration gradients adjacent to various road types. These gradients provide a basis for selecting, within a distribution, an appropriate proximity factor given the distance of the near-road ME from the road. Four consecutive 7-day average integrated samples were collected during two seasons (fall 2008 and winter 2009) to determine the average pollutant concentration gradients adjacent to major roadways. Measurements were made at three freeway locations: I-710 in North Long Beach (Figure S6) at the sites of the SCAQMD I-710 Roadside Study (Polidori, Citation2012), I-405 in Carson (Figure S7), and I-10 in Alhambra (Figure S8). I-710 has the highest traffic volume of diesel trucks within the South Coast Air Basin; traffic on the nearby I-405 location is predominantly gasoline-powered vehicles. Measurements included NO, NOx, BTEX, and aldehydes on both sides of the freeways using passive samplers (Ogawa, Radiello) (Mason et al., Citation2011). Concurrent samples were also collected at a SCAQMD community air quality monitoring station in Carson (Figure S9). Seven-day integrated Teflon and quartz filters were collected with portable MiniVol samplers (Airmetrics) at the SCAQMD I-710 Roadside Study sites at 10 and 100 m east of the freeway edge, 30 m west of the opposite side of the freeway, and at the Carson monitoring station. All filter samplers employed a PM2.5 size-cut inlet. The filter samples were analyzed for gravimetric mass, and for organic carbon (OC) and elemental carbon (EC) by thermal/optical reflectance (TOR) (Chow et al., 1993, 2001).
Effects of ventilation conditions on in-vehicle pollutant concentrations
In-vehicle measurements in on-road MEs were only made under maximum ventilation conditions (windows open, fan on, and recirculation off). Thus, these measurements represent maximal on-road exposure concentrations. However, individual motorists are exposed to varying and often lower pollutant concentrations than these depending on the ventilation condition of the vehicle (Fedoruk and Kerger, Citation2003; Zhu et al., Citation2007) and installation and efficiency of an in-cabin filter (Zhu et al., Citation2007).
An in-vehicle field ventilation experiment was conducted during the week of February 23, 2009. Pollutant (NO, PM2.5, BC) concentrations were measured in three light-duty gasoline vehicles with varying body styles: a 1996 Dodge Caravan minivan, a 2008 Nissan Altima Sedan, and a 2008 Cadillac SRX sports utility vehicle (SUV). Three ventilation conditions were used: maximum (with windows and vent open such that in-vehicle pollutant concentrations approached on-road ambient concentrations); minimum (windows closed, vent recirculation, and air conditioning [AC] on); and medium (windows closed, vent open). The two 2008 model year vehicles also had cabin air filters that removed particles but not gases such as NOx and CO. A 15–20-min route was driven starting with maximum ventilation and immediately repeated for minimum and medium ventilation conditions, with each vehicle tested during the morning, midday, and evening commuting periods. NO, PM2.5, and BC were measured simultaneously inside the vehicle and outside. The effects of ventilation conditions on in-vehicle concentrations of gases and particles were determined either from the ratios of in-vehicle pollutant concentrations during minimum and medium ventilation to maximum ventilation or from the ratios of NO, BC, and PM2.5 concentrations measured simultaneously inside and outside the vehicle. These ratios were then used to derive the in-vehicle/outside vehicle ratio factors for varying in-vehicle ventilation conditions.
Results
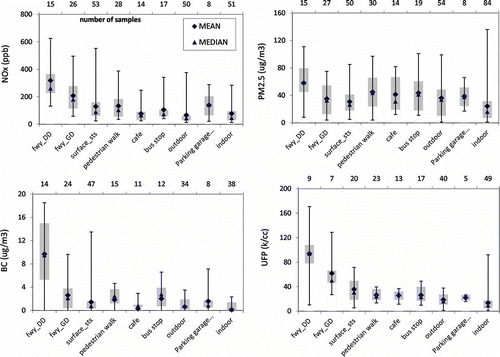
This study measured concentrations of mobile source air toxics and related pollutants within urban MEs. The ranges of ME concentrations are shown in the box and whisker plots in for CO and BTEX and in for NOx, PM2.5, BC, and UFPs. Pollutant concentrations were generally higher in closer proximity to high-traffic roadways. On-road pollutant concentrations were as much as a factor of 10 higher during the morning compared with the afternoon commuting period, likely due to a combination of greater traffic density and lower atmospheric mixing heights. PM and UFP number concentrations within buildings with air conditioning were substantially lower than outside the building, since the building structure, heating, ventilation, and air condition systems likely removed or reduced infiltration of ambient particles indoors. Indoor levels of gases such as NO and CO were comparable to outdoor levels; on several mornings indoor NO levels declined inside the building at about the same rate as the outdoor ambient levels but out of phase by a period of time that could be attributed to changes in the building air exchange rate. Indoor PM2.5 concentrations were substantially higher within buildings with cooking operations (e.g., a supermarket delicatessen with rotisserie oven or mall food courts).
Figure 2. Box and whisker plots of CO and BTEX concentrations in various microenvironments. Boxes indicate 25 and 75 percentile range and whiskers indicate maximum and minimum values.
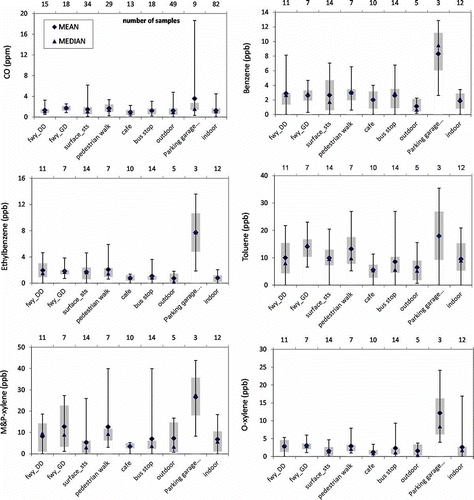
Figure 3. Box and whisker plots of NOx, PM2.5, black carbon, and ultrafine particle number concentrations in various microenvironments. Boxes indicate 25 and 75 percentile range and whiskers indicate maximum and minimum values. NOx is estimated as the sum of NO measured in ME and hourly average NO2 from the nearest air monitoring station.
Microenvironmental versus ambient pollutant concentrations
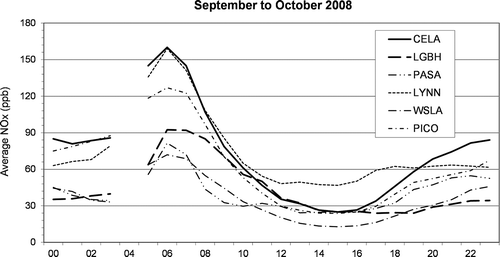
The ME pollutant concentrations represent both the contributions from local emissions and from an urban “background,” which varies diurnally and seasonally with changes in emissions, meteorology, and rates of chemical and physical transformations of directly emitted pollutants. The fall 2008 hourly NOx plots in show similar diurnal variations at all six monitoring locations (see for station locations). Pollutant concentrations peak during the morning commuting period due to increased vehicle traffic volume with stable meteorological conditions and a broader secondary maximum occurs overnight as the nighttime inversion strengthens. Large variations exist in pollutant concentrations among the six ambient monitoring sites during both morning and nighttime maxima due to varying local traffic density and monitor proximity to emission sources. Midday pollutant concentrations are lower at all sites due to increased mixing heights, stronger on-shore winds, and partial conversion of NOx to nitric acid and particulate nitrate. Although midday NOx levels are very similar for four sites, they are much lower at West Los Angeles, which is located near the coast in the upwind portion of the basin. The Lynwood station is a near-road location on Long Beach Boulevard, a major arterial street. The diurnal variations for the CELA and LGBH sites, which are indicated by the two darker lines in , show that NOx mixing ratios are about a factor of 2 higher at CELA during the morning and evening hours. These variations are likely related to both differences in pollutant emissions near the monitoring stations and local meteorological conditions (e.g., effects of on-shore flow at coastal versus inland areas). Thus, some of the variability in ME pollutant concentrations is attributable to the diurnal variations of background pollution contributions. The temporal (diurnal and seasonal) variations are especially complex in the case of PM2.5, which includes regional secondary components (e.g., nitrate, sulfate, and organic aerosols) generated in addition to directly emitted local PM sources.
Figure 4. Mean diurnal variations in NOx during fall 2008 at central Los Angeles (CELA), N. Long Beach (LGBH), Pasadena (PASA), Lynwood (Lynwood), West Los Angeles (WSLA), and Pico Rivera (PICO).
The CO, NOx, and PM2.5 concentrations in six ME categories are related to corresponding ambient data from either CELA or LGBH in . NOx showed strong correlations with hourly average concentrations at the nearest fixed-site monitor for most MEs, but with large and variable regression intercepts for on-road MEs. The intercepts reflect the strong influence of local emissions in the on-road MEs, which vary with traffic density and fleet composition. The correlation for NOx, which is the most sensitive of the three parameters to diesel emissions, shows most of the data points well above the 1:1 line, with the largest apparent slope for the diesel dominated freeway ME (solid diamond symbols). In contrast, most the other symbols are clustered nearer the 1:1 line. The correlations between ME and ambient concentrations were less consistent for CO as compared with NOx, due to the lower sensitivity of the CO monitor.
Figure 5. Correlations of CO, NOx, and PM2.5 concentrations measured in the microenvironments versus corresponding data from ambient monitoring site.
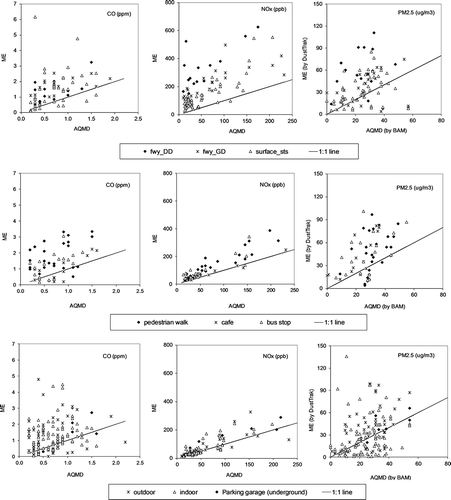
Moderate but statistically significant R2 values were obtained for PM2.5 in outdoor and on-road MEs: however, concentrations of indoor PM2.5 were not correlated with ambient data for most indoor MEs. The correlations for PM2.5 appear poor for several reasons: (1) indoor PM concentrations (open triangle symbols in ) are often substantially below ambient due to removal of particles in the HVAC (heating, ventilation, and air conditioning) system of mechanically ventilated public or office buildings; (2) the TSI DustTrak estimates PM concentrations by measuring light-scattering, which is also a function of particle size, and typically overestimates ambient PM2.5 concentrations in urban environments [note that most of the PM2.5 concentrations measured in outdoor ME (star symbols) are higher than the 1:1 line]; and (3) ambient PM2.5 contains a large component of secondary aerosols, which would not correlate well with ME measurements that are dominated by fresh exhaust emissions, which have not undergone significant gas-to-particle conversion. For these reasons, ME/ambient ratios were not derived for PM2.5.
The PROX factors were estimated by relating ME CO and NOx measurements by type of ME to the corresponding or representative SCAQMD air quality monitoring station data. The ambient LGBH data were used for Carson and Long Beach MEs and CELA data for downtown Los Angeles and Alhambra MEs. The median proximity factors in combine the ME data from the fall and winter sampling periods. The median ME/ambient ratios of NOx were 6.7 for freeway with diesel, and 3.7 and 2.8 for freeway with predominantly gasoline vehicle and surface streets, respectively. Ratios for near-road MEs were between 1.8 and 1.1 for near-road, outdoor, and indoor MEs. The median ME/ambient ratio of CO for freeway with predominantly gasoline vehicles was 2.6. All other ME categories had ratios between 1.0 and 2.0. The differences in PROX factors among ME categories are generally greater than the differences found among the communities within the same ME category.
In conducting exposure assessments, analysts frequently use the nearest fixed-site monitor to represent ambient concentrations at a particular geographic location. The PROX factors in were calculated by normalizing ME measurements made in the Alhambra and Los Angeles study areas with fixed-site data from the CELA monitors and the Carson/Long Beach ME measurements to the LGBH monitoring site. As a supplement to the Desert Research Institute (DRI) analysis, TRJ conducted a series of stepwise linear regression (SLR) analyses to identify the fixed-site monitors that are the best predictors of ME concentration for three general MEs: indoors, outdoors, and vehicle (Johnson, Citation2009). ME measurements in Alhambra were related to air monitoring data from Pasadena, Central Los Angeles, and Pico Rivera; Los Angeles ME measurements to Central Los Angeles and West Los Angeles; and Carson/Long Beach ME measurements to Long Beach, Compton, and Lynwood. The results of this preliminary analysis showed that the nearest fixed-site monitor may not provide the best prediction of concentrations in a particular ME.
Extension of proximity factors to other pollutants
Correlations of CO and NO to the other parameters measured in the MEs were calculated to determine whether CO and NO can be used to infer the PROX factors for other MSATs not measured at the air monitoring stations. The strongest correlation with NO was for BC on freeways with diesel trucks. UFPs showed a similar correlation to NO. CO and BTEX were correlated for surface street, near-road, and outdoor MEs. Based on these correlations, we conclude that proximity factors for BC and BTEX would be similar to NOx and CO, respectively. Since UFP concentrations rapidly decrease with distance from the mobile source emissions due to coagulation into larger particles, we cannot make the same assumption for that parameter.
Previous analysis of hourly average ambient NO and BC concentrations in the South Coast Air Basin (SoCAB) showed that they were well correlated and weekend levels were much lower than weekday levels, which was consistent with the lower traffic volumes of diesel trucks on weekends, especially on Sundays (Fujita et al., 2003). CO and nonmethane hydrocarbon (NMHC) had similar temporal and spatial variations, and they differed significantly from those exhibited by NO and BC. Underlying these variations is the substantially greater emission rates of NOx, BC, and PM2.5 (g/km basis) from diesel engines compared with gasoline engines and much greater fractional contribution by gasoline-powered vehicles to the total basin-wide motor vehicle emissions of CO and BTEX.
The expectation that the on-road and near-road concentrations of diesel- and gasoline-related pollutants should reflect the local mix of diesel and gasoline vehicles is consistent with the ratios of median pollutant concentrations for diesel versus gasoline-dominated freeway ME categories. The ratios are 0.6 and 0.8 for CO and benzene, respectively, and 2–4 for NO, BC, PM2.5, and UFPs. Ratios of the median concentrations of NOx, BC, and UFPs to CO are highest for the diesel-dominated freeway MEs. These ratios for all other ME categories are similar to or lower than the gasoline-dominated freeway category, indicating that gasoline vehicle exhaust was the dominant source.
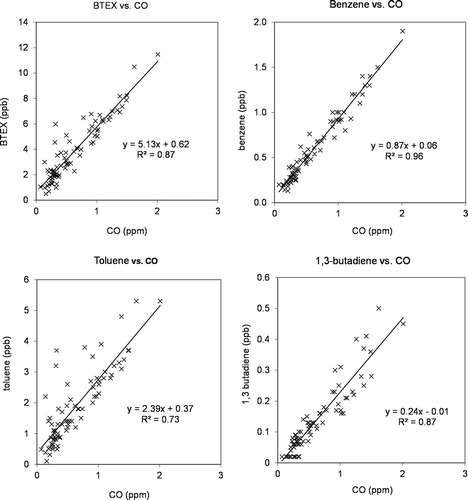
Correlations of BTEX and 1,3-butadiene from the air toxics monitoring program with CO at the SCAQMD Los Angeles N. Main air monitoring station are shown in . Data used are 24-hr samples collected every 12th day for the years 2005–2007. The correlations of both benzene and 1,3-butadiene to CO are especially strong, indicating that vehicle emissions are the predominant sources of these compounds. Several data points above the regression line in the correlation of toluene and CO indicate occasional influence of additional sources of toluene. These correlations confirm that proximity factors developed for CO are also applicable to BTEX and 1,3-butadiene.
Figure 6. Correlations of BTEX and 1,3-butadiene with CO at the SCAQMD Los Angeles N. Main air monitoring stations. Data are from the air toxic monitoring program and are 24-hr samples collected every 12th day for the years 2005–2007.
Diesel particulate carbon (DPC) concentrations can be estimated using samples collected immediately downwind of a freeway with high volume of diesel truck traffic where the carbonaceous aerosol can be assumed to be predominately fresh diesel exhaust. Total carbon (TC) and EC were well correlated (R2 of 0.89), with a slope of 2.17 for samples collected roadside of I-710 and at a nearby residential neighborhood location. Ambient concentrations of DPC may be estimated by multiplying EC measured at other locations by the slope of the regression. This is an upper-bound estimate of the ambient concentrations of DPC, since EC can also be emitted from other combustion sources. However, EC has been attributed mainly to diesel exhaust in recent ambient source apportionment studies for the Los Angeles area (Fujita et al., Citation2007a). Diesel particulate matter (DPM) can be estimated from DPC using the following relationship:
Roadside gradients
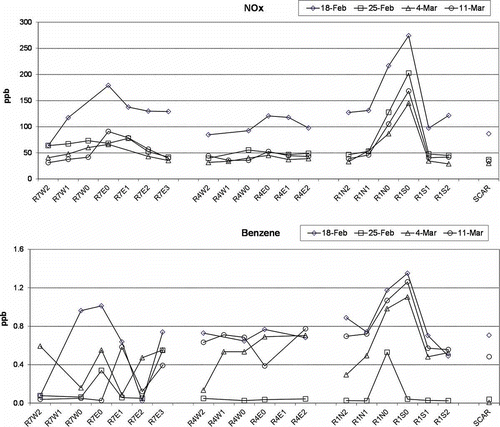
Passive and active samplers were used to measure the rate of decrease in average concentration of NOx, VOC, PM2.5 mass, EC, and TC with distance from major freeways. The roadside pollutant concentrations measured at I-710 (North Long Beach), I-405 (Carson), and I-10 (Alhambra) during the 4 weeks in the fall of 2008 are plotted in . NOx levels at the edges of the roadway were about 3 times higher than at the site furthest away from the roadway (˜100 m) at I-710 and I-10. NOx levels were uniform at all locations near I-405 and were similar to measurements at the Carson air monitoring station, which is located about 1.5 km to the east. The sections of I-710 and I-10 where the measurements were made are surface level, but I-405 in Carson is elevated. This may explain why we did not observe a gradient in NOx levels near I-405. A modest gradient was observed for benzene levels near I-10. The gradients for the other two locations were much weaker, although several samples appeared suspect. The winter roadside pollutant concentrations are plotted in for NOx and benzene. Results obtained during the winter field study showed concentrations gradients similar to those observed during the fall 2008 field study.
Figure 7. Pollutant gradients near I-710, I-405, and I-10 during fall 2008. Sampling locations are shown in Figures S6 to S9 and are identified by four alphanumeric code (“R” for roadside gradient sample; 7, 4, or 1 indicate I-710, I-405, and I-10; direction E, W, N, S; distance from edge of freeway—0 is roadside, and 1, 2, and 3 is 50, 100, and 300 m from edge of freeway.
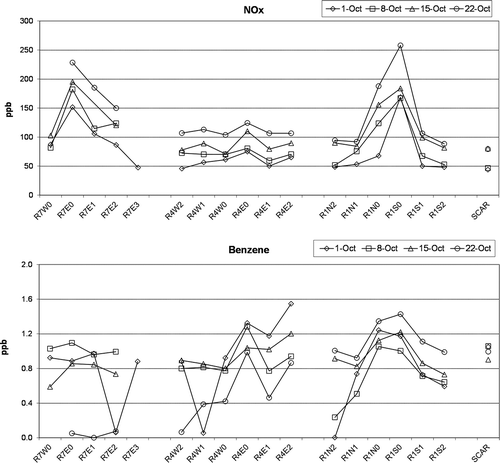
Figure 8. Pollutant gradients near I-710, I-405, and I-10 during winter 2009. Sampling locations are shown in Figures S6 to S9 and are identified by four alphanumeric code (“R” for roadside gradient sample; 7, 4, or 1 indicate I-710, I-405, and I-10; direction E, W, N, S; distance from edge of freeway—0 is roadside, and 1, 2, and 3 is 50, 100, and 300 m from edge of freeway.
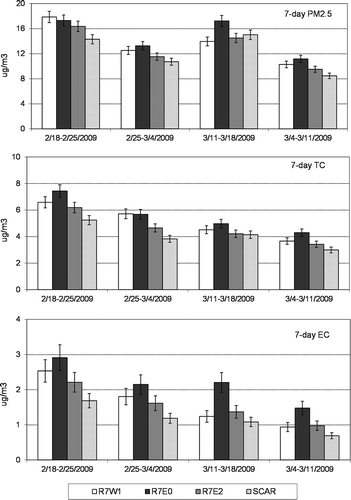
The roadside monitoring during winter 2009 added 7-day aerosol samples at the I-710 site, since electric power was available at the SCAQMD roadside study monitoring locations: one adjacent to the East edge of I-710 and a second location approximately 100 m east of the first location. A third site was located at the West edge of I-710. shows the gradient in PM2.5 mass, TC, and EC for daytime during the winter study period. The results showed a clear decrease from the east edge of the freeway to the downwind sites. Interestingly, concentrations at the west side of the freeway were sometimes similar to or even higher than on the east edge. This is consistent with wind data from the study site and a nearby monitoring station that indicate that there was frequent counterflow (see Figures S10 and S11).
Figure 9. Mean PM2.5 mass, TC, and EC concentrations near I-710 during February 18, 2009, to March 18, 2009. R7E0 is located on the east edge of I-710 and R7W1 and R7E2 are located 50 m west and 100 m east of the freeway edge, respectively. SCAR is the Carson SCAQMD air quality monitoring station, which is located in a residential area about 3 km southwest of the freeway gradient site.
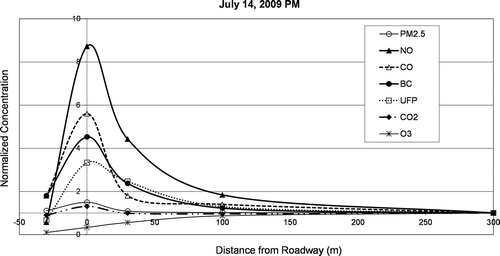
During the summer 2009 field study no passive samplers were deployed, but the concentration gradient across I-710 was measured using the continuous monitors. The mobile sampling system was mounted in our van and then the van was (1) parked on the upwind edge of the freeway, (2) then driven along the freeway and moved to the downwind edge, (3) then driven 100m downwind, and (4) then 300 m downwind. Concentrations were measured for 15 min at each location. The sequence was repeated in the morning and late afternoon to investigate how the gradient is affected by changes in mixing height. The measured gradients are shown in . Values are normalized relative to the concentration at the site 300m east of the edge of I-710. Winds in the area were moderate (4–7 mph) and from the northwest during the afternoon period.
Derivation of penetration factors
The measured 10-sec average concentrations of PM, BC, and NO are shown in for the 2008 SUV during maximum (gray shading), minimum (white background), and medium (half gray, half white) ventilation conditions during morning, midday, and afternoon. During maximum ventilation, the in-vehicle pollutant concentrations were comparable to on-road concentrations. PM2.5 and BC concentrations were substantially lower inside the vehicle than on-road during minimum ventilation and decreased with time from change of ventilation status. However, CO and NO levels were comparable/higher inside, since the in-cabin filters have no effect on gases. CO2 levels inside the vehicle steadily increased throughout each test from occupant emissions confirming the minimal exchange with outside air. In-vehicle pollutant concentrations were comparable to on-road during medium ventilation but lagged behind changes in on-road concentrations. Although the in-vehicle/outside-vehicle ratios and low/maximum ventilation ratios in are both estimations of the PEN factor, the former is conceptually a better estimate for the PEN factors. The mean inside/outside ratios for PM2.5 and BC during minimum ventilation averaged 0.60 and 0.34, respectively; the mean minimum/maximum ventilation ratios of the in-vehicle concentrations were 0.56 and 0.39 for PM2.5 and BC, respectively.
Figure 11. In-vehicle versus outside DustTrak PM2.5, photoacoustic black carbon, and 2B Technology NO concentrations during maximum (gray shading), minimum (white background), and medium (half gray, half white) ventilation conditions during morning, midday, and afternoon for 2008 Cadillac SRX SUV.
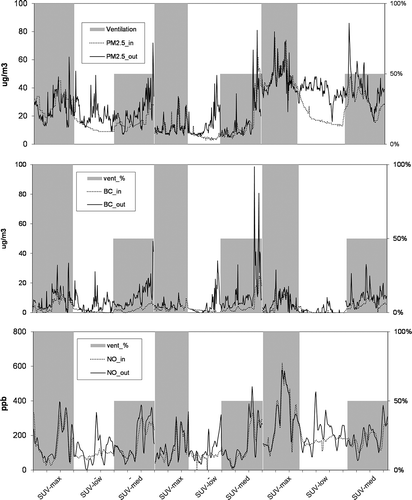
Table 3. Mean pollutant concentrations and inside/outside ratios (PEN factors) by vehicle and ventilation conditiona
Although the measurement of penetration rates for entrainment of ambient pollutants inside buildings was not an objective of this project, our microenvironmental measurements with the cart system provided the opportunity to compare outdoor concentrations with those inside a variety of public and private buildings within a short time period. The resulting ratios of indoor to outdoor concentrations (I/O ratio) are comparable to recent measures of particle penetration (Stephens and Siegel, Citation2012).
Discussion and Conclusions
This study provides relatively recent 2008–2009 real-world microenvironmental measurements of gaseous and particulate pollutants and estimates of proximity and penetration factors that can be used to evaluate exposure model results. With the exception of on-road and near-road MEs, the PROX factors for most other outdoor MEs were near unity (i.e., similar to the pollutant levels at fixed ambient air monitoring stations). The ranges of NOx on-road ME PROX factors were large with skewed distributions that reflected varying traffic density and proximity to vehicle emissions. For these reasons, the use of means and standard deviations to characterize the measurements are not appropriate, and the preferable median PROX factors are given in . A large fraction of the observed pollutant concentrations for on-road MEs, especially near diesel trucks, were unrelated to ambient measurements at nearby monitors. The comparisons of ME concentrations estimated using the median proximity factors versus the slopes and intercepts from indicate that the regression approach may be more accurate for on-road MEs.
The differences in the PROX factors among ME categories were generally greater than differences among the three communities within the same ME category. This suggests that the PROX factors may be more broadly applicable within urban areas. Indoor ME PROX factors showed more variation between locations because the specific indoor locations used in each city may not be equivalent due to differences in building age, type, and size, between the downtown and suburban communities. Such limitations should be taken into account when applying these factors.
The PEN factors were determined for in-vehicle and indoor MEs (without cooking operations). In our tests, vehicle cabin filters reduced in-vehicle PM2.5 and BC concentrations by about two-thirds. PM concentrations and UFP counts within buildings with air conditioning were substantially lower than outside, whereas indoor levels of gases such as NO and CO were comparable to outdoor levels.
Since most ambient monitoring programs focus on criteria pollutants, it is often necessary to use surrogates to estimate relative concentration of specific air toxic compounds for exposure and risk estimates. Although CO is a useful measure of air toxic contaminants from gasoline vehicles, it is an unreliable surrogate for diesel exhaust emissions; NOx is a better surrogate for diesel exhaust but gasoline vehicles account for a large fraction of total mobile source NOx emissions. Additionally, NOx is converted in the atmosphere to nitric acid and particulate nitrate. EC from filter-based measurements or BC from continuous optical measurements are more suitable surrogates of diesel exhaust and should be incorporated into air monitoring programs due to potentially significant exposures to DPM. Substantial reductions in DPM emissions are expected over the next decade as new technology diesel engines penetrate the fleet. Future EC trends should track reductions in DPM emissions and exposures.
Supplemental Material
Supplemental data for this article can be accessed on the publisher’s website.http://www.tandfonline.com/uawm
Supplemental_Material.docx
Download MS Word (3.8 MB)Acknowledgment
The authors wish to acknowledge the following DRI personnel for their assistance: Dr. Barbara Zielinska, Anna Cunningham and Mark McDaniel for organic analysis, and Dr. Judith Chow, Steven Kohl, Ed Hackett, and Brenda Cristani for analysis of inorganic species. We also gratefully acknowledge the South Coast Air Quality Management District for providing air quality monitoring data.
Funding
This study was funded by the American Petroleum Institute.
Additional information
Notes on contributors
Eric M. Fujita
Eric M. Fujita is a research professor emeritus and David E. Campbell is an associate research scientist in the Division of Atmospheric Sciences at the Desert Research Institute (Nevada System of Higher Education).
W. Patrick Arnott
W. Patrick Arnott is an associate professor in the Department of Physics at the University of Nevada, Reno.
Ted Johnson
Ted Johnson is the Research Director of TRJ Environmental, Inc. in Chapel Hill, North Carolina.
Will Ollison
Will Ollison is a senior scientific advisor in the Regulatory and Scientific Affairs Department of the American Petroleum Institute in Washington, DC.
References
- Arnott, W.P., K. Hamasha, H. Moosmüller, P.J. Sheridan, and J.A. Ogren. 2005a. Towards aerosol light absorption measurements with a 7-wavelength aethalometer: Evaluation with a photoacoustic instrument and 3-wavelenght nephelometer. Aerosol Sci. Technol. 39:17–29. doi:10.1080/027868290901972
- Arnott, W.P., H. Moosmüller, C.F. Rogers, T. Jin, and R. Bruch. 1999. Photoacoustic spectrometer for measuring light absorption by aerosols: Instrument description. Atmos. Environ. 33:2845–2852.
- Arnott, W.P., H. Moosmüller, and J.W. Walker. 2000. Nitrogen dioxide and kerosene-flame soot calibration of photoacoustic instruments for measurement of light absorption by aerosols. Rev. Sci. Instrum. 71:4545–4552. doi:10.1063/1.1322585
- Arnott, W.P., B. Zielinska, C.F. Rogers, J. Sagebiel, K. Park, J.C. Chow, H. Moosmüller, J.G. Watson, K. Kelly, D. Wagner, A. Sarofim, J. Lighty, and G. Palmer. 2005b. Evaluation of 1047-nm photoacoustic instruments and photoelectric aerosol sensors in source-sampling of black carbon aerosol and particle-bound PAHs from gasoline and diesel powered vehicles. Environ. Sci. Technol. 39:5398–5406. doi:10.1021/es049595e
- Baxter, L.K., K.L. Dionisio, J. Burke, S.E. Sarnat, J.A. Sarnat, N. Hodas, D.Q. Rich, B.J. Turpin, R.R. Jones, E. Mannshardt, N. Kumar, S.D. Beevers, and H. Özkaynak. 2013. Exposure prediction approaches used in air pollution epidemiology studies: Key findings and future recommendations. J. Expos. Sci. Environ. Epidemiol. 23:654–659. doi:10.1038/jes.2013.62
- Bishop, G., A.M. Peddle, and D.H. Stedman. 2010. On-road emission measurements of reactive nitrogen compounds from three California cities. Environ. Sci. Technol. 44:3616–3620. doi:10.1021/es903722p
- Bishop, G.A., and D.H. Stedman. 2008. Emissions of nitrogen dioxide from modern diesel vehicles. WIT Transactions on Ecology and the Environment, Vol. 116. Southampton, UK: WIT Press doi:10.2495/AIR080261
- Ceballos, D.M., B. Zielinska, J. Sagebiel, and E.M. Fujita. 2007. Characterization of Solid phase micro extraction and gas chromatography for the analysis of gasoline tracers in different microenvironments. J. Air Waste Manage. Assoc. 57:355–365. doi:10.1080/10473289.2007.10465330
- Chan, C.C., H. Ozkaynak, J.D. Spengler, and L. Sheldon. 1991. Driver exposure to volatile organic compounds, CO, ozone, and NO2 under different driving conditions. Environ. Sci. Technol. 25:964–972. doi:10.1021/es00017a021
- Chow, J.C., J.G. Watson, D. Crow, D.H. Lowenthal, and T. Merrifield. 2001. Comparison of IMPROVE and NIOSH carbon measurements. Aerosol Sci. Technol. 34:23–34. doi:10.1080/02786820119073; 10.1080/027868201300081923
- Chow, J.C., J.G. Watson, L.S. Pritchett, W.R. Pierson, C.A. Frazier, and R.G. Purcell. 1993. The DRI thermal/optical reflectance carbon analysis system: Description, evaluation and applications in U.S. air quality studies. Atmos. Environ. 27A:1185–1201. doi:10.1016/0960-1686(93)90245-T
- Dockery, D.W., and J.D. Spengler. 1981. Personal exposure to respirable particulates and sulfates. J. Air Pollut. Control Assoc. 32:152–159.
- Duffy, B.L., and P.F. Nelson. 1997. Exposure to emissions of 1,3-butadiene and benzene in the cabins of moving motor vehicles and buses in Sydney, Australia. Atmos. Environ. 31:3877–3885. doi:10.1016/S1352-2310(97)00255-0
- Fedoruk, M.J., and B.D. Kerger. 2003. Measurement of volatile organic compounds inside automobiles. J. Expos. Anal. Environ. Epidemiol. 13:31–41. doi:10.1038/sj.jea.7500250
- Fruins, S., D. Westerdahl, T. Sax, C. Sioutas, and P.M. Fine. 2008. Measurements and predictors of on-road ultrafine particle concentrations and associated pollutant in Los Angeles. Atmos. Environ. 42:207–219.
- Fujita, E.M., and D.E. Campbell. 2013. Exposure classification project—Concentrations of mobile source air pollutants in urban microenvironments. Final report prepared by the Desert Research Institute for the American Petroleum Institute, Washington, DC, May 6, 2013.
- Fujita, E.M., D.E. Campbell, W. P. Arnott, B. Zielinska. 2007a. Evaluations of source apportionment methods for determining contributions of gasoline and diesel exhaust to ambient carbonaceous aerosols. J. Air Waste Manage. Assoc. 57:721–740. doi:10.3155/1047-3289.57.6.721
- Fujita, E.M., D.E. Campbell, B. Zielinska, J.C. Sagebiel, J.L. Bowen, W.S. Goliff, W.R. Stockwell, and D.R. Lawson. 2003. Diurnal and weekday variations in the source contributions of ozone precursors in California’s South Coast Air Basin. J. Air Waste Manage. Assoc. 53:844–863. doi: 10.1080/10473289.2003.10466226
- Fujita, E.M., D.E. Campbell, B. Zielinska, W.P. Arnott, and J.C. Chow. 2011. Concentrations of Air Toxics in Motor Vehicle Dominated Microenvironments. Health Effects Institute Report No. 156. Boston, MA: Health Effects Institute, February 16, 2011.
- Fujita, E.M., B. Zielinska, D.E. Campbell, W.P. Arnott, J. Sagebiel, L. Mazzoleni, J.C. Chow, N. P.A. Gabele, W. Crews, R. Snow, N. Clark, S. Wayne, and D.R. Lawson. 2007b. Variations in speciated emissions from spark-ignition and compression ignition motor vehicles in the California’s South Coast Air Basin. J. Air Waste Manage. Assoc. 57:705–720. doi: 10.3155/1047-3289.57.6.705
- Fujita, E.M., D.E. Campbell, W.P. Arnott, V. Lau, and P.T. Martien. 2013. Spatial variations of particulate matter and air toxics in communities adjacent to the Port of Oakland. J. Air Waste Manage. Assoc. 63:1399–1411. doi:10.1080/10962247.2013.824393
- Jo, W., and K. Park. 1999. Commuter exposure to volatile organic compounds under different driving conditions. Atmos. Environ. 33:409–417. doi:10.1016/S1352-2310(98)00201-5
- Jo, W.K., and S.J. Choi. 1996. Vehicle occupants exposure to aromatic volatile organic compounds while commuting on an urban-suburban route in Korea. J. Air. Waste Manage. Assoc. 46:749–754. doi:10.1080/10473289.1996.10467509
- Johnson, T. 2009. Future research opportunities relating to the microenvironmental data obtained from the Exposure Classification Project. Draft report prepared by TRJ Environmental, Inc. for the American Petroleum Institute, Washington, DC, December 24, 2009.
- Johnson, T. 2012. An evaluation of APEX using microenvironmental ozone concentrations measure in Los Angeles during the Exposure Classification Project. Draft report prepared by TRJ Environmental, Inc. for the Office of Air Quality Planning and Standards, U.S. Environmental Protection Agency, Research Triangle Park, NC, April 12, 2012.
- Johnson, T., J. Capel, and W. Ollison. 2014. Measurement of microenvironmental ozone concentrations in Durham, North Carolina, using a 2B Technologies 205 FEM monitor and an interference-free 2B Technologies 211 monitor. J. Air Waste Manage. Assoc. 64:360–371. doi:10.1080/10962247.2013.839968
- Kirchstetter, T. 2007. Evaluating past and improving present and future measurements of black carbon. Prepared for CEC Public Interest Energy Research Program by Lawrence Berkeley Laboratories. CEC-500-2007-042.
- Kirchstetter, T., and T. Novakov. 2007. Controlled generation of black carbon particles from a diffusion flame and applications in evaluating black carbon measurement methods. Atmos. Environ. 41:1874–1888. doi:10.1016/j.atmosenv.2006.10.067
- Leung, P., and R.M. Harrison. 1999. Roadside and in-vehicle concentrations of monoaromatic hydrocarbons. Atmos. Environ. 33:191–204. doi:10.1016/S1352-2310(98)00147-2
- Mason, J.B., E. Fujita, D. Campbell, and B. Zielinska. 2011. Evaluation of passive samplers for assessment of community exposure to toxic air contaminants and related pollutants. Environ. Sci. Technol. 45:2243–2249. doi:10.1021/es102500v
- Özkaynak, H., L.K. Baxter, K.L. Dionisio, and J. Burke. 2013. Air pollution exposure prediction approaches used in air pollution epidemiology studies. J. Expos. Sci. Environ. Epidemiol. 23:566–572. doi:10.1038/jes.2013.15
- Özkaynak, H., T. Palma, J.S. Touma, and J. Thurman. 2008. Modeling population exposures to outdoor sources of hazardous air pollutants. J. Expos. Sci. Environ. Epidemiol. 18:45–58. doi:10.1038/sj.jes.7500612
- Polidori, A., and P.M. Fine. 2012. Ambient concentrations of criteria and air toxic pollutants in close proximity to a freeway with heavy-duty diesel traffic. Final report prepared by the South Coast Air Quality Management District, Diamond Bar, CA, April 2012.
- Rosenbaum, A., and M. Huang. 2007. The HAPEM6 user’s guide, Hazardous Air Pollutant Exposure Model, Version 6. Prepared by ICF International, Rohnert Park, CA, for the Office of Air Quality Planning and Standards, U.S. Environmental Protection Agency, Research Triangle Park, NC, January 2007.
- Sarnat, S.E., J.A. Sarnat, J. Mulholland, V. Isakov, H. Özkaynak, H.H. Chang, M. Klein, and P.E. Tolbert. 2013. Application of alternative spatiotemporal metrics of ambient air pollution exposure in a time-series epidemiological study in Atlanta. J. Expos. Sci. Environ. Epidemiol. 23:593–605. doi:10.1038/jes.2013.41
- Spicer, C.W., D.W. Joseph, and W.M. Ollison. 2010. A reexamination of ambient air ozone monitor interferences. J. Air Waste Manage. Assoc. 60:1353–1364. doi:10.3155/1047-3289.60.11.1353
- Stephens, B., E.T. Gall, and J.A. Siegel. 2012. Measuring the penetration of ambient ozone into residential buildings. Environ. Sci. Technol. 46:929–936. doi:10.1021/es2028795
- Stephens, B., and J.A. Siegel. 2012. Penetration of ambient submicron particles into single-family residences and associations with building characteristics. Indoor Air 22:501–513. doi:10.1111/j.1600-0668.2012.00779.x
- U.S. Environmental Protection Agency. 2008. Total Risk Integrated Methodology (TRIM) Air Pollutants Exposure Model Documentation (TRIM.Expo/APEX, Version 4.3). Volume I: User’s Guide. EPA-452/B-08-001a. Research Triangle Park, NC: U.S. Environmental Protection Agency, Office of Air Quality Planning and Standards, Health and Environmental Impacts Division, October 2008.
- U.S. Environmental Protection Agency. 2013. Consolidated Human Activity Database—CHAD. http://www.epa.gov/heasd/chad.html ( accessed September 30, 2013).
- Wallace, L.A. 1987. The TEAM Study: Summary and Analysis: Volume I. U.S. EPA 600/6-87/002a, NTIS PB 88-100060. Washington, DC: Office of Research and Development U.S. Environmental Protection Agency.
- Weisel C.P., N.J. Lawryk, and P.J. Lioy. 1992. Exposure to emissions from gasoline within automobile cabins. J. Expos. Anal. Environ. Epidemics 2:79–96.
- Westerdahl, D., S. Fruin, T. Sax, P. Fine, and C. Sioutas. 2005. Mobile platform measurements of ultrafine particles and associated pollutant concentrations on freeways and residential streets in Los Angeles. Atmos. Environ. 39:3597–3610. doi:10.1016/j.atmosenv.2005.02.034
- Zhu, Y., A. Eiguren-Fernandez, W.C. Hinds, and A.H. Miguel. 2007. In-cabin commuter exposure to ultrafine particles on Los Angeles freeways. Environ. Sci. Technol. 41:2138–2145. doi:10.1021/es0618797
- Zhu, Y.F, W.C. Hinds, S. Kim, S. Shen, and C. Sioutas. 2002. Study of ultrafine particles near a major highway with heavy-duty diesel traffic. Atmos. Environ. 36:4323–4335. doi:10.1016/S1352-2310(02)00354-0

