
Abstract
Despite observed geographic and temporal variation in particulate matter (PM)-related health morbidities, only a small number of epidemiologic studies have evaluated the relation between PM2.5 chemical constituents and respiratory disease. Most assessments are limited by inadequate spatial and temporal resolution of ambient PM measurements and/or by their approaches to examine the role of specific PM components on health outcomes. In a case-crossover analysis using daily average ambient PM2.5 total mass and species estimates derived from the Community Multiscale Air Quality (CMAQ) model and available observations, we examined the association between the chemical components of PM (including elemental and organic carbon, sulfate, nitrate, ammonium, and other remaining) and respiratory hospitalizations in New York State. We evaluated relationships between levels (low, medium, high) of PM constituent mass fractions, and assessed modification of the PM2.5–hospitalization association via models stratified by mass fractions of both primary and secondary PM components. In our results, average daily PM2.5 concentrations in New York State were generally lower than the 24-hr average National Ambient Air Quality Standard (NAAQS). Year-round analyses showed statistically significant positive associations between respiratory hospitalizations and PM2.5 total mass, sulfate, nitrate, and ammonium concentrations at multiple exposure lags (0.5–2.0% per interquartile range [IQR] increase). Primarily in the summer months, the greatest associations with respiratory hospitalizations were observed per IQR increase in the secondary species sulfate and ammonium concentrations at lags of 1–4 days (1.0–2.0%). Although there were subtle differences in associations observed between mass fraction tertiles, there was no strong evidence to support modification of the PM2.5-respiratory disease association by a particular constituent. We conclude that ambient concentrations of PM2.5 and secondary aerosols including sulfate, ammonium, and nitrate were positively associated with respiratory hospitalizations, although patterns varied by season. Exposure to specific fine PM constituents is a plausible risk factor for respiratory hospitalization in New York State.
Implications: The association between ambient concentrations of PM2.5 components has been evaluated in only a small number of epidemiologic studies with refined spatial and temporal scale data. In New York State, fine PM and several of its constituents, including sulfate, ammonium, and nitrate, were positively associated with respiratory hospitalizations. Results suggest that PM species relationships and their influence on respiratory endpoints are complex and season dependent. Additional work is needed to better understand the relative toxicity of PM species, and to further explore the role of co-pollutant relationships and exposure prediction error on observed PM–respiratory disease associations.
Introduction
Fine particles less than 2.5 µm in diameter (PM2.5) are emitted directly from sources or are formed in the atmosphere through gas- and/or aqueous-phase reactions of primary pollutants such as NOx and SO2. A substantial body of epidemiologic evidence exists in support of the association between short-term exposure to ambient fine particles and respiratory morbidity, including hospitalizations and emergency department (ED) visits, increased medication use, symptoms, and infections (Dominici et al., Citation2006; Host et al., Citation2008; Karakatsani et al., Citation2003; Tecer et al., Citation2008; von Klot et al., Citation2002). Most of these studies have quantified health burdens in relation to PM2.5 total mass only, although examination of relationships with the components of PM2.5 could potentially explain observed geographic variation in particulate matter (PM)-related health risk (Atkinson et al., Citation2015). A better understanding of the potential toxicity of other PM components may inform source-related regulatory controls for particulates, which are currently focused on reductions in total particle mass rather than constituent species.
Several recent epidemiologic investigations have identified associations between short-term exposure to the constituents of fine PM (PM2.5) and respiratory morbidity (Bell et al., Citation2009; Ostro et al., Citation2009; Peng et al., Citation2009). These studies identified significant species-related respiratory health risks, but were limited to examination of either children or older adult populations and lacked daily exposure estimates. The U.S. Environmental Protection Agency (EPA) Chemical Speciation Network (CSN) collection of PM component data remains limited in spatial coverage and by a 1 in 3 or 1 in 6 days sampling scheme, posing a challenge to valid evaluation of acute health risks. The availability of air quality models such as the Community Multiscale Air Quality (CMAQ) model to estimate daily PM mass and species concentrations provides an alternate approach to estimate human exposure to ambient outdoor PM at a finer temporal scale, but predictions from such models are subject to biases and errors. Integrating available observations with air quality model predictions provides a promising approach for enhancing time- and space-resolved PM concentrations fields (Garcia et al., Citation2010). Few existing studies have examined PM constituents using a case-crossover design, although this method is increasingly common in the epidemiologic air quality literature and provides advantages for confounding adjustment over traditional time-series analysis.
This study investigated the association between daily ambient PM2.5 species concentrations and respiratory hospitalizations in New York State (NYS) using 24-hr average PM constituent concentrations estimated by combining CMAQ outputs with available observations. Our objective was to characterize the relationship between ambient PM species and respiratory hospitalization in a large, age-diverse and racially/ethnically-diverse population using a case-crossover approach. A secondary objective was to determine whether certain fine PM constituents modify the PM2.5–respiratory disease association.
Methods
Design and population
We used a case-crossover approach to assess the short-term association between ambient PM2.5 species and risk of respiratory hospitalization among the entire residential population of NYS, 2000–2005. The hazard period for the case-crossover analysis was defined as the day of admission. A time-stratified control selection was employed, with control days sampled from the same month and day of the week as the case date in 7-day intervals. This method of control sampling is thought to be the least prone to bias (Janes, Sheppard, and Lumley, Citation2005), particularly for studies of air pollution (Carracedo-Martinez et al., Citation2010). Statewide hospital discharge data were obtained from the NYS Department of Health State Planning and Research Cooperative System (SPARCS), representing data from 95% of NYS hospitals. Mandated under Title 10 NYS public health law, the SPARCS database includes data from all facilities certified for inpatient care or providing ambulatory surgery services, excluding psychiatric and veterans’ hospitals (New York State Department of Health [NYSDOH], Citation2014). From the patient SPARCS record, we obtained principal diagnosis, a unique personal identifier, date of birth, gender, race, ethnicity, residential address, and date of admission for analysis. Respiratory admissions were extracted based on principal diagnosis from International Classification of Disease (Version 9) (ICD-9) codes, including asthma (ICD-9 code 493), chronic bronchitis (491), chronic airway obstruction (496), and emphysema (492).
Nonvarying individual-level factors such as age, gender, race/ethnicity, land use characteristics, and other features of residence that may be relevant to both outdoor air pollution exposures and respiratory disease hospitalization were addressed as confounders by the case-crossover design. These factors were therefore examined only as effect modifiers via stratified analyses. Daily, day-of-the-week, and secular trends in health and exposure data were also largely addressed by design. Seasons were defined as winter: (December, January, February), spring (March, April, May), summer (June, July, August), and fall (September, October, November), and we evaluated seasonal trends with stratified analyses.
Pollutant and meteorological data
The daily average total PM2.5 mass and species concentrations in micrograms per cubic meter (µg/m3) used in this study were developed following the approach described in Hogrefe et al. (Citation2009) from the CMAQ model, a three-dimensional Eulerian (i.e., gridded) atmospheric chemistry and transport modeling system that simulates particulate matter and other airborne pollutants. Specifically, these data were estimated by bias-correcting CMAQ concentrations provided on a 12 km by 12 km modeling grid with available CSN measurements, assuming seasonally varying species-specific biases (Hogrefe et al., Citation2009). The chemical species of interest included components that make up the largest fractions of PM2.5 total mass: secondary aerosols sulfate (SO4), ammonium (NH4), and nitrate (NO3), elemental carbon (EC), the carbon-only portion of the organic carbon aerosol (OC), and crustal/other PM2.5, including non-carbon organic matter (OTH). Daily 8-hr maximum ozone (O3) concentrations in ppb were available at the same 12 km spatial resolution for adjustment as a co-pollutant. We obtained meteorological variables, including daily mean ambient temperature, universal apparent temperature (UAT, °F), humidity, wind, and barometric pressure from the National Climactic Data Center for 14 climate regions across NYS.
After restriction to NYS residences, hospital admissions data were geocoded using an automated process in Mapmarker Plus (v. 10). The patient’s geocoded address was then joined to a 12 km CMAQ exposure grid surface in a geographic information system (GIS), and 24-hr average concentrations for total and speciated PM2.5 masses from the CMAQ data set were assigned to individuals based on their street-level geocodes falling within the assigned exposure grid. Admissions were further assigned to meteorological variables by linkage of their residential address to the NYS climate regions, as was done in another NYS analysis (Fletcher et al., Citation2012).
Statistical analysis
We conducted univariate and bivariate analyses to generate descriptive statistics for health and PM data, year round and by season. The mass fractions of each chemical constituent (i.e., the proportion of bias-corrected CMAQ PM2.5 total mass that is comprised of each species) were estimated as the bias-corrected CMAQ species concentration divided by the PM2.5 concentration, and were ranked into tertiles (low, medium, high) for analysis. We also computed Spearman rank correlations between PM2.5 total mass, species, O3, and UAT.
We assessed the association between PM species and total respiratory hospitalizations using single-pollutant conditional logistic regression models for each species mass concentration, both across the entire study period and in season-stratified models. The interquartile range (IQR) of PM2.5 total mass and its species were used as the unit of exposure for analyses. Final models further adjusted only for daily UAT. To provide context for associations with PM components in light of their relationship with PM2.5 mass, we further explored concomitant relationships between PM mass fractions using an approach similar to that of Rich et al. in their analysis of CMAQ data in New Jersey (Rich et al., Citation2013). We also evaluated whether mutual adjustment of models for PM2.5 mass influenced any estimated risks.
We used the PHREG procedure in SAS (version 9.2) to tabulate hazard ratios (HRs) along with 95% confidence intervals (95%CI) from regression models. We assessed effect modification by stratifying analyses on sociodemographic and regional characteristics (e.g., age, race/ethnicity, gender, New York City vs. upstate) and PM species mass fraction tertiles, and assessed the statistical significance of these interactions via cross-product terms included in models. The criterion for statistical significance in all analyses was P < 0.05.
Results
Pollutant concentrations and relationships
In total, 469,095 respiratory hospitalizations occurred during the study period. After removing non-geocodable records or those missing covariate information, the case-crossover dataset for analysis included 419,938 case days and 1,363,625 control days (up to 4 control days per case). Asthma admissions comprised the largest proportion (51%) of respiratory hospitalizations, followed by chronic bronchitis (34%) and the remaining diagnoses (15%; data not shown).
summarizes the statewide average distributions of fine PM and the percent contributions of each species to total PM2.5 mass. The median concentration of PM2.5 total mass during the study period was 6.64 µg/m3. Extremely high daily concentrations were infrequent occurrences and consequently the IQR value (7.48 µg/m3) was close to the median concentration. Exceedance of the 24-hr National Ambient Air Quality Standard (NAAQS) for PM2.5 (35 µg/m3) occurred on roughly 9% of days across the 6-year study period; 60% of these exceedances occurred in New York City (NYC) (data not shown). Overall, SO4 dominated the composition of PM2.5 total mass (49.9%), with the ammonium (16.2%) and OC (11.3%) each contributing the next largest mass fractions. These mass fractions varied with season (data not shown), as expected due to seasonally varying source emissions.
Table 1. Distributions of pollutant concentrations and percent contribution of each PM2.5 component to PM2.5 total mass, New York State, 2000–2005.
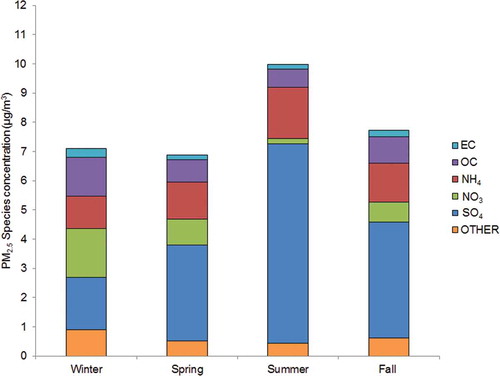
Seasonal variation in outdoor PM2.5 total mass and species concentrations was evident (). Sulfate and ammonium concentrations peaked during the summer months, reflective of the temperature- and humidity-driven secondary formations from oxidation of sulfur dioxide emissions in the presence of ammonia. Concentrations of NO3, OC aerosols, and other species followed an inverse pattern, peaking during the cooler months. While the mass fractions changed by season, SO4 was the predominant species in each (25–68%). Consistent with its seasonally stable mobile sources, EC concentrations were the least varied by season, and ranged from 1.6 to 4.3% of total mass. With the exception of NH4 (ρ = 0.94 to 0.98), the Spearman correlations between species and total mass concentrations reflect the observed seasonal variation in PM2.5 composition (). PM2.5 total mass was correlated strongly with both EC and OC species in the winter (ρ > 0.85), but was only weakly correlated (ρ = 0.33 to 0.54) with OC during the summer. In contrast, SO4 and total PM2.5 mass were moderately to strongly correlated regardless of season. Patterns in correlations between the carbon species were predictably high. Notably, O3 and PM2.5 concentrations were generally only weakly correlated, although more so (ρ = 0.59) during the summer months, when levels of both tend to be higher.
Table 2. Correlations between ambient outdoor PM2.5, O3, and temperature, by season.
Figure 1. Seasonal trends in average daily PM2.5 total mass and species concentrations, New York State, 2000–2005.
Epidemiologic relationships
Single-pollutant models adjusting for UAT yielded modest positive associations between most PM species and respiratory hospitalization, although not all achieved statistical significance (). Year-round models adjusted for season showed significant associations with total PM2.5 mass for all exposure lags, and for SO4, NO3, and NH4 species. In the summer months, PM2.5 remained significantly associated with up to a 2.5% increase in hospitalization per IQR change in mass, at lags of 1 to 4 days and with a trend toward increasing effect with lagged exposure. Associations with SO4 and NH4 concentrations during the summer months mirrored those for PM2.5 mass. Smaller effects were observed for these species in the winter and spring months (up to 2% increase per IQR), with hospitalizations more strongly associated with same-day and 3- and 4-day lagged exposures. Associations with NO3 were more substantial in the cooler months. The EC component was not associated with respiratory admissions when assessed in single-pollutant models, and OC only very modestly in the summer months (~1% increase in admissions per IQR of summertime OC for lags 1–4; ). Mutually adjusting single-pollutant species models for PM2.5 mass did not appreciably change any of these associations (data not shown).
Figure 2. Year-round and season-stratified hazard ratios (HRs) of respiratory hospitalization for 0–4 day lags per IQR change in PM2.5 total mass and species, 2000–2005: (a) year-round data; (b) winter; (c) summer; (d) fall; (e) spring.
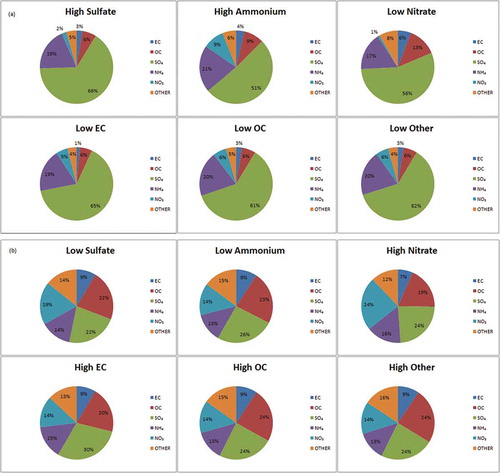
In analyses of mass fraction, the highest average concentrations of the secondary species SO4 and NH4, and lowest for NO3, were evident when PM2.5 was most depleted of both of the carbon species (). Correspondingly, when PM2.5 was comprised of the greatest proportions of EC and OC, both SO4 and NH4 concentrations were low (). The crustal/other PM2.5 category tracked well with levels of OC. The complexity of these relationships as driven by temporal and spatial heterogeneity in emissions of both primary PM and PM2.5 precursors is further illustrated upon stratification by season and region (Supplemental Figure 1). The lowest SO4 levels in the summertime coincided with nearly two-fold greater levels of EC than observed in the winter months. The opposite trend was observed for NO3, when lower temperatures yield higher emissions and ground-level concentrations of nitrates from nitrogen sources. Moreover, the EC contribution during periods of low SO4 concentrations is twice as great in NYC compared to the rest of NYS, likely reflecting its greater volume of traffic-related emissions and resultant elevated EC levels.
Figure 3. Mean composition of PM2.5 mass, by species mass fraction tertile: (a) high SO4, NH4, and low EC, OC, NO3, and other. (b) Low SO4, NH4, and high EC, OC, NO3, and other.
Models of PM2.5-associated respiratory hospitalizations within tertiles of each of the PM species mass fractions did not yield noticeable patterns in year-round analyses (). Generally, although many point estimates were significant or borderline significant, confidence intervals overlapped between the tertiles, indicating no consistent evidence of modification of the exposure–disease relationship by specific PM mass fractions. When we stratified these models by season (Supplemental Table 1), associations better corresponded with the general patterns evident in mass fraction tertile relationships (), but there were no statistically significant interactions.
Figure 4. Hazard ratios (HRs; models adjusted for UAT) of respiratory hospitalization for 0–4 day lags per IQR change in PM2.5 total mass, 2000–2005, by tertiles of species mass fraction: (a) secondary PM2.5 species, and (b) carbon components and other PM2.5.
In analyses stratified by age, diagnosis subgroup, and sociodemographic characteristics that adjusted for UAT and season, we observed no modification of associations by these factors. Similarly, we did not identify noteworthy differences in PM–respiratory disease associations between NYC and the rest of the state (data not shown).
Discussion
This analysis of short-term PM exposures and hospitalizations demonstrated that fine PM and several of its constituents may play a role in triggering respiratory health endpoints. Short-term IQR changes in PM2.5 concentration were associated with up to nearly a 3% increased risk of respiratory hospitalizations in single-pollutant models, with the strongest significant effects observed per IQR increase in PM2.5, SO4, and NH4 species concentrations during the summer months. We also observed small but statistically significant associations between respiratory admissions and increases in secondary species concentrations during the winter. Models stratified by species mass fractions yielded no compelling evidence that observed PM2.5 associations were modified by varying levels of its components.
The small increases in respiratory hospitalization risk associated with PM2.5 in these analyses (e.g., 0.5–2.5%), including for SO4, NH4, and NO3 species, are generally consistent with other studies examining fine PM and respiratory morbidity (Atkinson et al., Citation2015). In their nationwide time-series analysis of Medicare recipients, Peng et al. (Citation2009) found 0.82% to 1.07% increases in respiratory ED visits among U.S. Medicare recipients per 10-µg/m3 increase in EC and organic matter (OM) species (Peng et al., Citation2009). Similarly, Bell et al. (Citation2009) found significant associations with same-day EC, OM, and NO3 concentrations and respiratory hospitalizations in their analysis of the same population. A case-crossover study of Medicare enrollees (≥65 years) in Boston, MA, found a 16.3-µg/m3 PM2.5 total mass associated with a 6.5% increase in risk of ED visits for pneumonia and 1.7 µg/m3 black carbon associated with an 11.7% increased risk (Zanobetti and Schwartz, Citation2006). Although we did not examine pneumonia-related hospitalizations specifically, the IQR value for PM2.5 total mass modeled in their study was also substantially higher than in our analysis. Moreover, the IQR for total PM2.5 mass observed in our data was only slightly higher than one-half the 24-hr average PM2.5 NAAQS, and effect estimates were correspondingly small. Findings from a study in a pediatric population support the elevated risks we observed for secondary species (1–3% increases per 1.5 and 5.7 µg/m3 of SO4 and NO3, respectively) (Ostro et al., Citation2009). Direct comparisons to other studies are further complicated given the small number that have examined PM components in relation to respiratory outcomes, differences in study design, location and populations, choice of statistical models and exposure units, and the respiratory health endpoints examined. However, the fact that we observed increased hospitalizations even at these low ambient PM2.5 levels underscores the public health significance of these results.
We found that SO4 was most strongly related to respiratory hospitalization, particularly in the summer months, when PM2.5 was composed predominantly of this species. One study of respiratory ED visits in children found significant associations with SO4 concentrations during the warm season (Strickland et al., Citation2010). The National Particle Component Toxicity (NPACT) Initiative’s analysis of data from 158 U.S. cities found excess risks of similar magnitude to our study (0.5–1%) for respiratory hospitalizations in association with PM2.5, including significant or nearly significant excesses in association with nitrogen dioxide, sulfur dioxide, OC, and SO4 during the warm season (Lippmann et al., Citation2013). Two studies in Chile also found associations with the sulfur content of PM2.5, including with respiratory-related ED visits (Cakmak et al., Citation2009) and respiratory mortality (Valdes et al., Citation2012). The SOPHIA study in Atlanta, GA, reported a 1% increase in respiratory-related ED visits per 3.8 ug/m3 of SO4 during non-winter months (Tolbert et al., Citation2007), results comparable to those observed from our data. There is also biologic plausibility to support these observed relationships, given the respirable fraction and a fairly well-characterized pathway leading to airway inflammation. Sulfates, nitrates, and carbon species in particular are all known respiratory irritants (Institute of Medicine [IOM], Citation2000). Our observation of associations with SO4 during the summer months is further supported by the fact that respiratory hospitalizations in NYS tend to peak during the fall (NYSDOH, Citation2009), along with the seasonal increase in infectious triggers.
The seasonal behavior of PM species concentrations was quite evident in our data. The secondary aerosols resulting from atmospheric photochemical transformation were, as expected, elevated during warmer periods. Abundant summertime levels of ambient SO4 and NH4 coincided with low levels of EC, OC, other PM species, and NO3 (concentrations peak in wintertime when lower temperatures favor the increase of NO3 particulates over gaseous forms; Pitchford et al., Citation2009). Others have described the complexity of the heterogeneous OC species, including variation in volatility based on temperature, humidity, and other characteristics (EPA, Citation2004; Hallquist et al., Citation2009; Turpin, Saxena, and Andrews, Citation2000). However, at the extremes of our data, the OC fractions tracked well with EC. We note that it is not just temperature and sunlight driving the formation of secondary PM, but also the availability of atmospheric precursors, such as NH3 and NOx. Therefore, we expected that mass fraction tertiles would reflect differences in the composition of PM2.5 under different conditions, such as season or by region.
Our finding of an association with the SO4 constituent of fine PM could indicate poor control of confounding in single-pollutant models by total PM2.5, other PM species, or gaseous pollutants. Several studies have identified increased respiratory risks associated with SO4 in a single-pollutant context (Burnett et al., Citation1997; Ostro et al., Citation2009; Peng et al., Citation2009), but findings from multipollutant settings are equivocal. Peng et al. (Citation2009) found no change in the association between SO4-related respiratory ED visits in single- and multipollutant models (Peng et al., Citation2009). An Atlanta, GA-based study observed significant associations between SO4 concentrations and pediatric respiratory ED visits that attenuated and became statistically non-significant when adjusted for other pollutants (Strickland et al., Citation2010). Similarly, Bell et al. (Citation2009) report substantially attenuated risk estimates for PM species when models were adjusted for covarying species, although they did not examine multipollutant models with SO4 specifically (Bell et al., Citation2009). In the current analysis, mutual adjustment for PM2.5 in species-specific models did not materially change our results.
This challenging task of identifying health risks in multipollutant exposure scenarios, such as simultaneous exposure to the components of PM, has been previously addressed in several ways. Single-pollutant models favored by some researchers to examine independent effects of PM species on health risks are limited by poor control of confounding by covarying exposures, including PM2.5 total mass. However, when correlations between PM2.5 and several of its components are high, attempts to compare results from both single- and multi-pollutant models, as done by others, may violate common statistical independence assumptions. The utility of either approach depends on both pollutant relationships and the research question of interest (Tolbert et al., Citation2007). Mostofsky et al. (Citation2012) demonstrate several approaches to address the impacts of PM2.5 on PM species-associated risks, including modeling constituents adjusted for PM2.5 mass, as proportions of PM2.5 mass, as residuals from constituent regression on PM2.5 mass, and as interactions between constituent concentrations or proportions and PM2.5 mass (Mostofsky et al., Citation2012). In analyses of cerebrovascular endpoints, they concluded that each method yields similar interpretations in regard to the relative ranking of PM–species associations on risk. We employed several of these approaches and also found general consistency in our results. By examining the excess in hospitalizations associated with PM2.5 and its constituents both individually and mutually adjusted, for total PM2.5 concentrations by tertiles of the constituent mass fractions, and by describing mass fraction relationships, we were able to comprehensively address the question of the influence of PM composition on PM2.5-associated respiratory admissions risk in NYS. The combination of approaches points to the importance of the summertime-dominant secondary species, SO4 and NO3 occurring with NH4, as influencing the PM2.5-associated respiratory hospitalization risk in our data. These findings correspond with those for at least one other endpoint in a study conducted in the northeast U.S., where greater relative odds of transmural myocardial infarctions were observed when outdoor PM2.5 concentrations were richer in secondary aerosols (Rich et al., Citation2013).
The variation in risk observed at lags of 0 to 4 days in this study for PM2.5 and several species is consistent with those observed by other studies examining PM species with hospitalizations as an endpoint (Bell, Citation2012; Dominici et al., Citation2006). An analysis of 187 U.S. counties during the same study period as our analysis indicated a stronger risk gradient in the northeastern U.S., with respiratory hospitalization risk most elevated 2 days after exposure (Bell, Citation2012). In a time-series analysis, the NPACT study similarly identified lag effects of 1 to 3 days (Lippmann et al., Citation2013). In contrast, other studies of PM species have identified no such lagged response for hospitalization (Bell et al., Citation2009). Lagged effects in our data varied by both species and season. Whether they are an artifact of a clinical process, such as a delay between an ED visit and a hospitalization or reflective of a true etiologic process is unknown, but was not measurable with our data.
This study remains among the small number of epidemiologic investigations of component-specific respiratory health effects of fine PM. As PM sources and atmospheric conditions differ between the northeastern U.S. and other regions, both the composition of fine PM and the burden of PM-associated health risks would be expected to differ geographically. The large and ethnically diverse population and geographic heterogeneity across NYS enabled examination of species-specific effects across strata of space, time, and other relevant characteristics. Only a few studies have had adequate PM data to assess species-specific health effects across such a large geographic area at fine spatial and temporal scales, and no studies have examined PM species estimates from a combination of observations and CMAQ data in relation to respiratory health endpoints in NYS. Our use of a case-crossover design was beneficial in that it effectively controlled for many individual-level confounding factors, unlike the commonly applied time series approaches, in an otherwise ecologic data setting.
Exposure misclassification arising from the ecologic scale of the exposure data is the primary threat to this study’s validity, and potentially resulted in attenuation of PM–respiratory hospitalization associations. Our estimated exposures offer improvements over those drawn from the CSN for similar analyses of PM-associated morbidity and mortality, although one concern is whether the combined CMAQ/observation approach accurately reflects outdoor species concentrations, particularly for SO4 concentrations during the summer and fall, when they tend to be overestimated (Hogrefe et al., Citation2009). However, as noted, the simulated data used for these analyses have already been subject to a partial validity assessment and are corrected to address known over/ underestimation of particular species by season (Hogrefe et al., Citation2009). We also identified small but significant associations with SO4 during the winter months, when CMAQ generally underestimates these concentrations. A sensitivity analysis using year-specific seasonal adjustment factors applied to CMAQ instead of multiyear adjustment factors (Hogrefe et al., Citation2009) found no appreciable differences in the magnitude or direction of our season-stratified effect estimates, suggesting that at least assumptions made in combining the CMAQ data with observations had minimal impact on our results. However, we acknowledge that differential error in the CMAQ prediction of PM species may have impacted this analysis. For instance, CMAQ as configured in this study has limited ability to capture small-scale variation in concentrations at resolutions finer than 12 km (Hogrefe et al., Citation2009), and the CSN monitoring network is not dense enough to introduce additional spatial texture at finer scales. This may in part reflect the known poorer correlation between central site monitors for aerosols with comparatively localized combustion sources (Lippmann et al., Citation2013). Moreover, the degree of measurement or estimation error may also differ by pollutant (Mostofsky et al., Citation2012; Dionisio et al., Citation2013), and concentration gradients of pollutants with greater heterogeneity over short distances will likely not be resolved by the 12 km-grid combined-CMAQ/observation fields we used. Poorer representation and therefore greater exposure misclassification/risk attenuation is expected for near-roadway pollutants, such as EC and crustal/other constituents, and most of these were not associated with hospitalization in our analysis. Sulfate, NO3, and NH4 are more homogeneous and regionally dispersed as a result of photochemical transformation from primary sources (EPA, 2004); NH4 is mostly present as ammonium sulfate (peaking in summer) and/or ammonium nitrate (peaking in winter), and is not easily interpreted as an independent constituent. Fine-scale (<1 km) modeling or more advanced bias correction techniques, such as demonstrated recently by Crooks and Özkaynak (Citation2014), could be applied for PM2.5 to conduct a more robust analysis of this rich health data set. Additionally, the combined CMAQ/observed ambient exposure estimates used in this study may not represent total exposures to PM2.5 from all other sources, such as occupational or indoor-generated PM sources. These may differ in their composition and toxicity, and also vary differently from outdoor particles. To the extent that these exposures relate to interindividual characteristics or sociodemographics, our study design and stratified analyses likely addressed these concerns.
The combined modeled-observed data approach used in this study was designed specifically to overcome spatial and temporal gaps in ambient monitoring networks (Hogrefe et al., Citation2009). Despite its limitations, some factors that might additionally affect outdoor pollutant concentrations and subsequently human exposures over very short time periods, such as wind speed, direction, and other aspects of meteorology, are already accounted for in the CMAQ simulations. The number of stations in NYS that actually measured PM2.5 species during the study period was small, and alternative choices for epidemiologic analysis, such as restricting to individuals who lived in close proximity to a monitor, or classifying exposures based on the nearest monitor regardless of distance to an individual’s residence, would impair study power and introduce substantial exposure misclassification. Moreover, our time-stratified case-crossover design should address any expected short-term temporal variation in the combined CMAQ/observed fields, such as commuting patterns, as well as spatial aspects of CMAQ prediction error, since cases and controls (days) are representative of the same spatial location. Irrespective of the limits of PM fields used in this study, any resulting exposure misclassification should be nondifferential with respect to respiratory hospitalization, and the CMAQ/observed data offer an improvement upon previous approaches. Measurement error could be further reduced by use of refined exposure indicators, such as those that incorporate outdoor–indoor infiltration, or by developing and applying location-specific population PM2.5 and species exposure predictions as in the EPA Stochastic Human Exposure and Dose Simulation (SHEDS) model (Baxter et al., Citation2013; Burke, Zufall, and Ozkaynak, Citation2001; Dionisio et al., Citation2013).
Although O3 has been previously associated with increases in NYS respiratory hospitalizations (Lin et al., Citation2008), this coexposure was only weakly correlated with PM2.5 levels and therefore we did not adjust analyses for this pollutant. Our evaluation was limited to the particulate species comprising the largest fractions of fine PM in our data; other constituents with suspected toxicity, such as metals or aeroallergens, were not examined. The low PM concentrations and small effect estimates observed in our analysis may have limited our ability to discern meaningful differences in associations between strata of clinical diagnoses, sociodemographics, or regional characteristics.
Our findings of an association between chemical species of fine PM and respiratory hospitalizations in NYS are biologically plausible and consistent with existing studies indicating that chemical composition may be an important explanatory factor for PM-associated respiratory health risk. Overall, results corroborate previously observed associations between particulate–SO4 and respiratory endpoints and generally identified the strongest and most consistent health responses in association with secondary PM. The only such study in New York thus far, our data also reflect the complexity of assessing the health impacts of exposure to PM species, and indicate that a finer exposure resolution may be necessary for studying health effects of locally generated PM, especially primary aerosols. We suggest that the combination of refined ambient exposure metrics that take into account location-specific data and indoor–outdoor infiltration rates or methods that otherwise correct for differential model prediction errors may further improve epidemiologic assessments of PM species and respiratory health.
Conflicts of Interest
The authors declare no competing interests.
Disclaimer
The U.S. Environmental Protection Agency through its Office of Research and Development collaborated in this research. This paper has been subjected to agency review and approved for publication. It may not necessarily reflect official agency policy.
Supplemental Materials
Supplemental data for this article can be accessed at http://dx.doi.org/10.1080/10962247.2014.1001500.
Supplemental Material
Download PDF (360.4 KB)Additional information
Notes on contributors
Rena R. Jones
Rena R. Jones is a research fellow at the National Cancer Institute in Rockville, MD. At the time this work was conducted, she was a research scientist with the New York State Department of Health in Albany, NY, and a doctoral student at the University at Albany School of Public Health in Rensselaer, NY.
Christian Hogrefe
Christian Hogrefe, Valerie C. Garcia, and Halûk Özkaynak are atmospheric and exposure scientists with the U.S. Environmental Protection Agency in Raleigh, NC.
Edward F. Fitzgerald
Edward F. Fitzgerald is a professor of epidemiology at the University at Albany School of Public Health in Rensselaer, NY.
Syni-An Hwang
Shao Lin and Syni-An Hwang are research scientists in the Bureau of Environmental and Occupational Epidemiology at the New York State Department of Health in Albany, NY, and research professors at the University at Albany School of Public Health in Rensselaer, NY.
Halûk Özkaynak
Christian Hogrefe, Valerie C. Garcia, and Halûk Özkaynak are atmospheric and exposure scientists with the U.S. Environmental Protection Agency in Raleigh, NC.
Valerie C. Garcia
Christian Hogrefe, Valerie C. Garcia, and Halûk Özkaynak are atmospheric and exposure scientists with the U.S. Environmental Protection Agency in Raleigh, NC.
Shao Lin
Shao Lin and Syni-An Hwang are research scientists in the Bureau of Environmental and Occupational Epidemiology at the New York State Department of Health in Albany, NY, and research professors at the University at Albany School of Public Health in Rensselaer, NY.
Related Research Data
References
- Atkinson, R.W., I.C. Mills, H.A. Walton, and H.R. Anderson. 2015. Fine particle components and health—A systematic review and meta-analysis of epidemiological time series studies of daily mortality and hospital admissions. J. Expos. Sci. Environ. Epidemiol. 25(2):208–14. doi:10.1038/jes.2014.63
- Baxter, L.K., J. Burke, M. Lunden, B.J. Turpin, D.Q. Rich, K. Thevenet-Morrison, N. Hodas, and H. Okaynak. 2013. Influence of human activity patterns, particle composition, and residential air exchange rates on modeled distributions of PM2.5 exposure compared with central-site monitoring data. J. Expos. Sci. Environ. Epidemiol. 23(3):241–47. doi:10.1038/jes.2012.118
- Bell, M.L. 2012. Assessment of the health impacts of particulate matter characteristics. Res. Rep. Health Effects Inst. 161:5–38.
- Bell, M.L., K. Ebisu, R.D. Peng, J.M. Samet, and F. Dominici. 2009. Hospital admissions and chemical composition of fine particle air pollution. Am. J. Respir. Crit. Care Med. 179(12):1115–20. doi:10.1164/rccm.200808-1240OC
- Burke, J.M., M.J. Zufall, and H. Ozkaynak. 2001. A population exposure model for particulate matter: case study results for PM(2.5) in Philadelphia, PA. J. Expos. Anal. Environ. Epidemiol. 11(6):470–89. doi:10.1038/sj.jea.7500188
- Burnett, R.T., S. Cakmak, J.R. Brook, and D. Krewski. 1997. The role of particulate size and chemistry in the association between summertime ambient air pollution and hospitalization for cardiorespiratory diseases. Environ. Health Perspect. 105(6):614–620. doi:10.1289/ehp.97105614
- Cakmak, S., R.E. Dales, T. Gultekin, C.B. Vidal, M. Farnendaz, M.A. Rubio, and P. Oyola. 2009. Components of particulate air pollution and emergency department visits in Chile. Arch. Environ. Occup. Health 64(3):148–55. doi:10.1080/19338240903240228
- Carracedo-Martinez, E., M. Taracido, A. Tobias, M. Saez, and A. Figueiras. 2010. Case-crossover analysis of air pollution health effects: A systematic review of methodology and application. Environ. Health Perspect. 118(8): 1173–82. doi:10.1289/ehp.0901485
- Crooks, J.L., and H. Özkaynak. 2014. Simultaneous statistical bias correction of multiple PM2.5 species from a regional photochemical grid model. Atmos. Environ. 95:126–41. doi:10.1016/j.atmosenv.2014.06.024
- Dionisio, K. L., V. Isakov, L. K. Baxter, J. A. Sarnat, S. E. Sarnat, J. Burke, A. Rosenbaum, S. E. Graham, R. Cook, J. Mulholland, and H. Ozkaynak. 2013. Development and evaluation of alternative approaches for exposure assessment of multiple air pollutants in Atlanta, Georgia. J. Expos. Sci. Environ. Epidemiol. 23(6):581–92. doi:10.1038/jes.2013.59
- Dominici, F., R.D. Peng, M.L. Bell, L. Pham, A. McDermott, S.L. Zeger, and J.M. Samet. 2006. Fine particulate air pollution and hospital admission for cardiovascular and respiratory diseases. J. Am. Med. Assoc. 295(10):1127–34. doi:10.1001/jama.295.10.1127
- Fletcher, B.A., S. Lin, E.F. Fitzgerald, and S.A. Hwang. 2012. Association of summer temperatures with hospital admissions for renal diseases in New York State: A case-crossover study. Am. J. Epidemiol. 175(9):907–16. doi:10.1093/aje/kwr417
- Garcia, V.C., K.M. Foley, E. Gego, D.M. Holland, and S. Trivikrama Rao. 2010. A comparison of statistical techniques for combining modeled and observed concentrations to create high-resolution ozone air quality surfaces. J. Air Waste Manage. Assoc. 60(5):586–95. doi:10.3155/1047-3289.60.5.586
- Hallquist, M., J.C. Wenger, U. Baltensperger, Y. Rudich, D. Simpson, M. Claeys, J. Dommen, N. M. Donahue, C. George, A.H. Goldstein, J.F. Hamilton, H. Herrmann, T. Hoffmann, Y. Iinuma, M. Jang, M.E. Jenkin, J.L. Jimenez, A. Kiendler-Scharr, W. Maenhaut, G. McFiggans, T.F. Mentel, A. Monod, A.S.H. Prévôt, J.H. Seinfeld, J.D. Surratt, R. Szmigielski, and J. Wildt. 2009. The formation, properties and impact of secondary organic aerosol: current and emerging issues. Atmos. Chem. Phys. 9(14):5155–236. doi:10.5194/acp-9-5155-2009
- Hogrefe, C., E. Zalewsky, W. Hao, P. Doraiswamy, K. Civerolo, J. Ku, G. Sistla, and P.L. Kinney. 2009. A combined modeled-observation approach to estimate historic gridded fields of PM2.5 mass and species concentrations. Atmos. Environ. 43(16):2561–70. doi:10.1016/j.atmosenv.2009.02.031
- Host, S., S. Larrieu, L. Pascal, M. Blanchard, C. Declercq, P. Fabre, J.F. Jusot, B. Chardon, Tertre A. Le, V. Wagner, H. Prouvost, and A. Lefranc. 2008. Short-term associations between fine and coarse particles and hospital admissions for cardiorespiratory diseases in six French cities. Occup. Environ. Med. 65(8):544–51. doi:10.1136/oem.2007.036194
- Institute of Medicine. 2000. Clearing the air: Asthma and indoor exposures. Washington, DC: National Academy of Sciences.
- Janes, H., L. Sheppard, and T. Lumley. 2005. Overlap bias in the case-crossover design, with application to air pollution exposures. Stat. Med. 24(2): 285–300. doi:10.1002/(ISSN)1097-0258
- Karakatsani, A., S. Andreadaki, K. Katsouyanni, I. Dimitroulis, D. Trichopoulos, V. Benetou, and A. Trichopoulou. 2003. Air pollution in relation to manifestations of chronic pulmonary disease: A nested case-control study in Athens, Greece. Eur. J. Epidemiol. 18(1):45–53. doi:10.1023/A:1022576028603
- Lin, S., X. Liu, E. Bell, R. Walker, N. Kim, and S.A. Hwang. 2008. Ambient ozone concentration and hospital admissions due to childhood respiratory diseases in NYS, 1991–2001. Environ. Res. 108:42–47. doi:10.1016/j.envres.2008.06.007
- Lippmann, M., L.C. Chen, T. Gordon, K. Ito, and G.D. Thurston. 2013. National Particle Component Toxicity (NPACT) Initiative: Integrated epidemiologic and toxicologic studies of the health effects of particulate matter components. Res. Rep. Health Effects Inst. 177:5–13.
- Mostofsky, E., J. Schwartz, B.A. Coull, P. Koutrakis, G.A. Wellenius, H.H. Suh, D.R. Gold, and M.A. Mittleman. 2012. Modeling the association between particle constituents of air pollution and health outcomes. Am. J. Epidemiol. 176(4):317–26. doi:10.1093/aje/kws018
- New York State Department of Health. 2009. New York State Asthma Surveillance Summary Report. Public Health Information Group, Center for Community Health. https://www.health.ny.gov/statistics/ny_asthma/pdf/2009_asthma_surveillance_summary_report.pdf
- New York State Department of Health. 2014. New York State Planning and Research Cooperative System. September. http://www.health.ny.gov/statistics/sparcs
- Ostro, B., L. Roth, B. Malig, and M. Marty. 2009. The effects of fine particle components on respiratory hospital admissions in children. Environ. Health Perspect. 117(3):475–80. doi:10.1289/ehp.11848
- Peng, R.D., M.L. Bell, A.S. Geyh, A. McDermott, S.L. Zeger, J.M. Samet, and F. Dominici. 2009. Emergency admissions for cardiovascular and respiratory diseases and the chemical composition of fine particle air pollution. Environ. Health Perspect. 117(6):957–63. doi:10.1289/ehp.0800185
- Pitchford, M.L., R.L. Poirot, B.A. Schichtel, and W.C. Maim. 2009. Characterization of the winter midwestern particulate nitrate bulge. J. Air Waste Manage. Assoc. 59(9):1061–69. doi:10.3155/1047-3289.59.9.1061
- Rich, D.Q., H. Ozkaynak, J. Crooks, L. Baxter, J. Burke, P. Ohman-Strickland, K. Thevenet-Morrison, H.M. Kipen, J. Zhang, J.B. Kostis, M. Lunden, N. Hodas, and B.J. Turpin. 2013. The triggering of myocardial infarction by fine particles is enhanced when particles are enriched in secondary species. Environ. Sci. Technol. 47(16):9414–23. doi:10.1021/es4027248
- Strickland, M.J., L.A. Darrow, M. Klein, W.D. Flanders, J.A. Sarnat, L.A. Waller, S.E. Sarnat, J.A. Mulholland, and P.E. Tolbert. 2010. Short-term associations between ambient air pollutants and pediatric asthma emergency department visits. Am. J. Respir. Crit. Care Med. 182(3):307–16. doi:10.1164/rccm.200908-1201OC
- Tecer, L.H., O. Alagha, F. Karaca, G. Tuncel, and N. Eldes. 2008. Particulate matter (PM(2.5), PM(10-2.5), and PM(10)) and children’s hospital admissions for asthma and respiratory diseases: a bidirectional case-crossover study. J. Toxicol. Environ. Health A 71(8):512–20. doi:10.1080/15287390801907459
- Tolbert, P.E., M. Klein, J.L. Peel, S.E. Sarnat, and J.A. Sarnat. 2007. Multipollutant modeling issues in a study of ambient air quality and emergency department visits in Atlanta. J. Expos. Sci. Environ. Epidemiol. 17(Suppl. 2):S29–35. doi:10.1038/sj.jes.7500625
- Turpin, B.J., P. Saxena, and E. Andrews. 2000. Measuring and simulating particulate organics in the atmosphere: problems and prospects. Atmos. Environ. 34(18):2983–3013. doi:10.1016/S1352-2310(99)00501-4
- U.S. Environmental Protection Agency. 2004. The particle pollution report: Current understanding of air quality and emissions through 2003. http://www.epa.gov/airtrends/aqtrnd04/pm.html
- Valdes, A., A. Zanobetti, J.I. Halonen, L. Cifuentes, D. Morata, and J. Schwartz. 2012. Elemental concentrations of ambient particles and cause specific mortality in Santiago, Chile: A time series study. Environ. Health 11:82. doi:10.1186/1476-069X-11-82
- von Klot, S., G. Wolke, T. Tuch, J. Heinrich, D.W. Dockery, J. Schwartz, W.G. Kreyling, H.E. Wichmann, and A. Peters. 2002. Increased asthma medication use in association with ambient fine and ultrafine particles. Eur. Respir. J. 20(3):691–702. doi:10.1183/09031936.02.01402001
- Zanobetti, A., and J. Schwartz. 2006. Air pollution and emergency admissions in Boston, MA. J. Epidemiol. Commun. Health 60(10):890–95. doi:10.1136/jech.2005.039834