
Abstract
Carbonaceous species (organic carbon [OC] and elemental carbon [EC]) and inorganic ions of particulate matter less than 2.5 μm (PM2.5) were measured to investigate the chemical characteristics of long-range-transported (LTP) PM2.5 at Gosan, Jeju Island, in Korea in the spring and fall of 2008–2012 (excluding 2010). On average, the non-sea-salt (nss) sulfate (4.2 µg/m3) was the most dominant species in the spring, followed by OC (2.6 µg/m3), nitrate (2.1 µg/m3), ammonium (1.7 µg/m3), and EC (0.6 µg/m3). In the fall, the nss-sulfate (4.7 µg/m3) was also the most dominant species, followed by OC (4.0 µg/m3), ammonium (1.7 µg/m3), nitrate (1.1 µg/m3), and EC (0.7 µg/m3). Both sulfate and OC were higher in the fall than in the spring, possibly due to more common northwest air masses (i.e., coming from China and Korea polluted areas) and more frequent biomass burnings in the fall. There was no clear difference in the EC between the spring and fall. The correlation between OC and EC was not strong; thus, the OC measured at Gosan was likely transported across a long distance and was not necessarily produced in a manner similar to the EC. Distinct types of LTP events (i.e., sulfate-dominant LTP versus OC-dominant LTP) were observed. In the sulfate-dominant LTP events, air masses directly arrived at Gosan without passing over the Korean Peninsula from the industrial area of China within 48 hr. During these events, the aerosol optical depth (AOD) increased to 1.63. Ionic balance data suggest that the long-range transported aerosols are acidic. In the OC-dominant LTP event, a higher residence time of air masses in Korea was observed (the air masses departing from the mainland of China arrived at the sampling site after passing Korea within 60–80 hr).
Implications: In Northeast Asia, various natural and anthropogenic sources contribute to the complex chemical components and affect local/regional air quality and climate change. Chemical characteristics of long-range-transported (LTP) PM2.5 were investigated during spring and fall of 2008, 2009, 2011, and 2012. Based on air mass types, sulfate-dominant LTP and OC-dominant LTP were observed. A long-term variation and chemical characteristics of PM2.5 along with air mass and satellite data are required to better understand long-range-transported aerosols.
Introduction
Atmospheric aerosols play an important role in climate change by affecting the radiation balances both directly (light scattering and/or light absorbing) and indirectly (acting as cloud condensation nuclei [CCN], which affects the number concentration of cloud droplets and the lifetime of a cloud) (Solomon, Citation2007). Additionally, aerosols affect human health, impair visibility, and impact heterogeneous reactions in the ambient atmosphere (Seinfeld and Pandis, Citation2012). These aerosols are either directly emitted into the ambient atmosphere from various sources (primary aerosols) or are produced by gas-to-particle conversion processes (secondary aerosols). In northeast Asia, various natural and anthropogenic sources, such as urban/industry, dust, biomass burning, and marine sources, contribute to the complex chemical components and mixing state of aerosols and affect local/regional air quality and climate change (Huebert et al., Citation2003; Seinfeld et al., Citation2004; Zhang and Iwasaka, Citation2004). For example, Asian dust that originates from desert areas of northern/western China and Mongolia can be transported over China to Korea and Japan, where the regional air quality is impacted. Additionally, local and regional fine particulate matter (PM) may affect air quality in northeast Asia. The PM intensity has increased in China due to rapid economic growth and energy consumption (Streets and Waldhoff, Citation2000; Streets et al., Citation2003) The long-range transport of fine PM becomes an important issue among northeastern Asia countries because of its higher health risks compared with coarse particles. However, it has been difficult to characterize long-range-transported fine particles solely by isolating them from locally produced particles.
The Gosan site is located at 74 m above sea level on the western edge of Jeju Island in Korea, and has been considered as a background site to study long-range transported atmospheric aerosols in the northeast Asia. It has almost no human-made emission sources around the sampling area within 40–50 km, and is frequently influenced by long-range transported air masses from China, Korea, Japan, and the Pacific Ocean (Chen et al., Citation1997). Several studies have been carried out at the Gosan site to investigate characteristics of long-range-transported aerosols over the Northeast Asia. International measurement campaigns such as PEM-WEST A (Pacific Exploratory Mission in the western Pacific A) in 1991 (Arimoto et al., Citation1996), PEM-WEST B in 1994 (Hoell et al., Citation1997), ACE-Asia (Asian Pacific Regional Aerosol Characterization Experiment) in 2001 (Huebert et al., Citation2003), and ABC-EAREX (Atmospheric Brown Clouds-East Asian Regional Experiment) in 2005 (Ramanathan et al., Citation2007) were carried out at the Gosan site for investigation of aerosol characteristics. Although previous studies have provided useful information on particulate matter less than 2.5 μm (PM2.5) in Gosan, information on long-term variations and chemical characteristics of PM2.5 along with air mass and satellite data to better understand long-range-transported aerosols is limited.
In this study, chemical components (organic carbon [OC], elemental carbon [EC], and ions: sulfate, nitrate, ammonium, chloride, calcium, magnesium, potassium, and sodium) of PM2.5 along with air mass backward-trajectory analyses and satellite-retrieved aerosol optical depth (AOD) at Gosan, Jeju Island, in Korea in the spring and fall of 2008–2012 (excluding 2010) were measured to investigate characteristics of long-range-transported (LTP) PM2.5 according to their chemical components and air mass trajectory. This will provide useful information on characteristics of transboundary aerosols over northeast Asia.
Experimental Methods
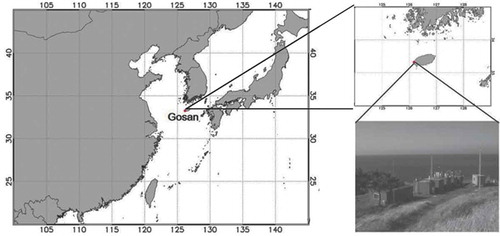
As shown in , Jeju Island is located around 100 km south of the Korean Peninsula, around 250 km west of Kyushu, Japan, and around 500 km northeast of Shanghai, China. Gosan (33°17ʹ N, 126°10ʹ E, 74 m above sea level) is located on the western coast of Jeju Island within 100 m of the seashore and is considered a background PM level site in Korea (Kim et al., Citation2007; Kim et al., Citation2011). Jeju Island is one of the cleanest regions in Korea (i.e., few industrial emission sources), and the effects of local emissions of anthropogenic sources on PM at Gosan would be small due to its elevation (74 m above sea level) and location (40–50 km away from the downtown area with a population of 200,000~220,000). The percentage of wind from the main town is less than 8% during the whole sampling period. Also, the concentration of EC, which is an indicator for local anthropogenic sources, was continuously low (less than 5% of PM2.5), and there is no major ship port available within 30 km from the site (i.e., ship emission source).
Figure 1. Map of the Gosan sampling site in Jeju Island, Korea.
OC, EC, and water-soluble inorganic ions (sulfate, nitrate, ammonium, chloride, calcium, magnesium, potassium, and sodium) in PM2.5 were measured in the spring and fall of 2008 (5/20–6/01 and 10/09–10/19, respectively), 2009 (4/14–4/24 and 10/14–10/24, respectively), 2011 (5/10–5/24 and 10/17–10/31, respectively), and 2012 (4/08–4/28 and 10/5–11/29 [ions only], respectively). The PM samples were collected on Zefluor filters (with a 47-mm diameter and a 2.0-µm pore size, supported by polytetrafluoroethylene [PTFE]; Pall Life Science, USA) and Teflon filters (with a 47-mm diameter and a 2.0-µm pore size; Pall Life Science, USA) for ion analysis and on quartz fiber filters (with a 47-mm diameter; Whatman, USA) for OC and EC analysis. The URG cyclone (Teflon-coated aluminum cyclone with cut sizes of 2.5 μm at 16.7 lpm) was used for the inlet of the filter sampling. The sampling was performed for 24 hr starting at 9 a.m. (local time).
Field blanks were collected at the sampling site (at least three times in each sampling period) by doing all the same procedures as for real samples with no flow rate. The Teflon filters were conditioned at the desiccator (temperature: 20 ± 2°C and relative humidity [RH]: 35 ± 5%) more than 24 hr before and after sampling. The quartz filters were heated at 550ºC for 8 hr to remove any remaining contaminants prior to sampling. For the quartz filter sampling, we used two methods to correct the positive artifact caused by gas-phase organics. We used a backup quartz filter behind a main quartz filter to estimate particulate OC (= OC in the main quartz filter – OC in the backup quartz filter) in 2008 and 2009. In 2011 and 2012, a parallel-plate carbon filter denuder without backup quartz filter was installed upstream of the quartz filter to remove the gas-phase organics from the incoming air stream The removing efficiency of gas-phase organics by the parallel-plate carbon filter denuder was higher than 90% (Subramanian et al., Citation2004). Thus, the OC in the quartz filter was used as the particulate OC. All of the filters were stored in petri dishes sealed with Teflon tape and frozen before analysis.
For the OC and EC analysis, a part of each quartz filter (2.01 cm2) was removed. The concentrations of OC and EC were obtained using the Sunset OC/EC analyzer (Sunset Laboratory, Inc., USA), which employs the thermal optical transmittance (TOT) method with the National Institute for Occupational Safety and Health (NIOSH) 5040 temperature protocol (Bae et al., Citation2004; Kondo et al., Citation2006). The different protocols such as thermal optical reflectance (TOR) method with IMPROVE protocol may provide different OC and EC concentrations (Chow et al., Citation2001; Watson et al., Citation2005).
To analyze the ions, Teflon and/or Zefluor filters were extracted with 20 mL of deionized and distilled water (DI, 18.2 MΩ) in an ultrasonic bath for 1 hr. The extracted solutions were filtered using a syringe filter (PTFE, 0.20 μm), and water-soluble inorganic ions were analyzed using ion chromatography (Dionex DX-120 and Metrohm 850 professional IC), along with the IonPac CS14 column and Metrosep C4-150/4.0 column (1.0 mL/min flow rate, 100 µL injection volume, and 4.0 mM HNO3 eluent) for cations and IonPac AS14 column and Metrosep A supp 5 column (0.7 mL/min flow rate, 100 µL injection volume, 1.0 mM NaHCO3/3.2 mM Na2CO3 eluent, and 100 mM H2SO4 suppressor solution) for anions. Before and after the sample analysis, five-point calibration curves were obtained for each chemical component using standard solutions. Non-sea-salt (nss) sulfate concentrations were estimated by assuming all sodium ions originated from sea salts. The nss-sulfate, which can be considered secondary aerosol, was calculated as 96% of the total sulfate, based on sodium concentrations (nss-sulfate = total sulfate – 0.252 × sodium) (Sciare et al., Citation2003).
An air mass backward-trajectory analysis (120 hr) was conducted using the Hybrid Single-Particle Lagrangian Integrated Trajectory (HYSPLIT4, version 4) model (Draxler and Rolph, Citation2003) (https://ready.arl.noaa.gov/HYSPLIT_traj.php; NOAA Air Resources Laboratory, Silver Spring, MD) to investigate the origin and pathway of air masses arriving at an elevation of 1000 m above the ground level at the sampling site. Meteorological data (wind speed, wind direction, temperature, and RH) were obtained at the Gosan measurement site, which is operated by the Korea Meteorological Administration (KMA). The AOD over northeast Asia, including the measurement site, was retrieved using the modified Bremen Aerosol Retrieval (M-BAER) algorithm with MODIS Terra and Aqua hierarchical data (Kwon Ho et al., Citation2006; Lee et al., Citation2005; Lee et al., Citation2006). The data extend approximately from 100° E to 145° E and 20° N to 45° N, which includes Korea, Japan, most of eastern China, and parts of Mongolia and Russia.
Results and Discussion
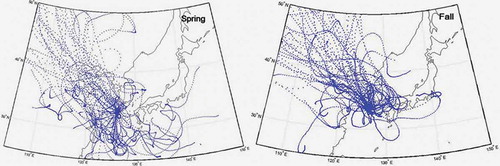
The meteorological data and air mass types are summarized in . There is no significant difference in the wind speed or direction between the two seasons. The average temperature is somewhat lower and the RH is higher in the spring than in the fall, but the difference is not very large. Thus, those meteorological conditions might not significantly affect aerosol properties. More details on the meteorological conditions are summarized in Supplemental Materials S1. Based on the air mass backward-trajectory analysis during the entire sampling periods (see ), the north and northwest air masses were dominant in both seasons; however, during the spring sampling period, air masses from the south and southeast appeared more often. Typically, air masses from the south or southeast become more dominant at the sampling site in the summer (Kim et al., Citation2007), which is not included in this study. Thus, the sampling site is mainly affected by long-range PM transported from north and northwest of China and Korea and marine aerosols produced from the surrounding ocean.
Table 1. Summary of meteorological and air mass data during the whole sampling period
Figure 2. Air mass backward trajectory data during the whole sampling period (spring vs. fall) (starting time: 00:00 UTC, time interval of each trajectory: 24 hr, and time interval between each dot in the singe trajectory: 1 hr).
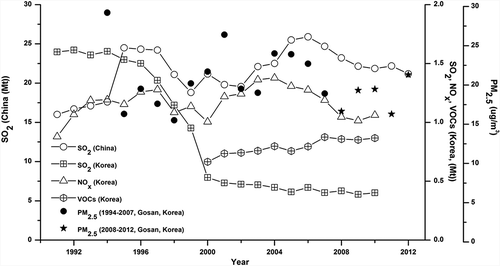
The PM2.5 concentration varied from 2.9 to 68.3 μg/m3 during the entire sampling period (2008–2012), with an average value of 18.6 μg/m3. Compared with prior PM2.5 data (1994–2007) (Kim et al., Citation2011), as shown in , there was no significant increase or decrease of PM2.5 in recent years (2008–2012). The average PM2.5 over 1994–2012 was 20.4 μg/m3. SO2 in 1991–2011 (China) (State Environmental Protection Administration, Citation2006–2011), SO2 in 1991–2010 (Korea) (Korean National Air Pollutants Emission Report, Citation2008–2010), NOx in 1991–2010 (Korea) (Korean National Air Pollutants Emission Report, Citation2008–2010), volatile organic compounds (VOC) in 1991–2010 (Korea) (Korean National Air Pollutants Emission Report, Citation2008–2010) emission data, and PM2.5 in 1994–2007 (Korea) (Kim et al., Citation2011), PM2.5 in 2008, 2009, 2011, and 2012 (Gosan, Korea) (this study), and PM2.5 in 2010 (Gosan, Korea) (National Institute for Environmental Research, 2010) data are also included in . Kim et al. (Citation2011) showed that during 1994–2007, the non-sea-salt (nss) sulfate concentration change in PM2.5 was similar to the SO2 emission trend in China and the nitrate concentration change in PM2.5 was consistent with the NOx emission change in both China and Korea. In recent years (2008–2012), the levels of SO2 in Korea and China, NOx in Korea, and VOC in Korea did not change much (i.e., the strength of the anthropogenic emissions from Korea and China varied little compared to previous years). Thus, the fluctuating level of PM2.5 at Gosan in 2008–2012 might be more affected by transport patterns and meteorological conditions than by the source strengths in China and Korea.
Figure 3. Annual variation of SO2 (China and Korea), NOx (Korea), VOC (Korea), and PM2.5 (Gosan, Korea), SO2 in 1991–2011 (China) (Press, China Statistics, Citation2008; State Environmental Protection Administration, Citation2006–2011), SO2 in 1991–2010 (Korea) (Korean National Air Pollutants Emission Report, Citation2008–2010), NOx in 1991–2010 (Korea) (Korean National Air Pollutants Emission Report, Citation2008–2010), VOC in 1991–2010 (Korea) (Korean National Air Pollutants Emission Report, Citation2008–2010), PM2.5 in 1994–2007 (Gosan, Korea) (Kim et al., Citation2011), PM2.5 in 2008, 2009, 2011, and 2012 (Gosan, Korea) (this study), and PM2.5 in 2010 (Gosan, Korea) (National Institute for Environmental Research, 2010).
The average concentrations of nss-sulfate, nitrate, and ammonium in PM2.5 in each sampling period are shown in . In the spring of 2011, an Asian Dust (AD) event occurred and led to enhanced PM2.5 (especially nitrate). The increase of nitrate can be caused by nitric acid uptake by dust particles (Fairlie et al., Citation2010). In the fall of 2011, the PM2.5 concentration was lower than that in other years. In the fall of 2011, compared to air masses in the fall of other years, north/northeast air masses (the air masses were originated from the north/northeast of Korea) were much more dominant than northwest air masses (more polluted), and clean southeast air mass also exist occasionally, possibly leading to the lower PM2.5 (see ). On average, the nss-sulfate (4.2 µg/m3) was the most dominant species, followed by OC (2.6 µg/m3), nitrate (2.1 µg/m3), ammonium (1.7 µg/m3), and EC (0.6 µg/m3) in the spring; in the fall, nss-sulfate (4.7 µg/m3) was also the most dominant, followed by OC (4.0 µg/m3), ammonium (1.7 µg/m3), nitrate (1.1 µg/m3), and EC (0.7 µg/m3).
Figure 4. Average concentrations of major ionic species (nss-sulfate, nitrate, and ammonium), OC, EC, and PM2.5 during each sampling period (the average data during 1994–2007 are obtained from Kim et al. [Citation2011]).
![Figure 4. Average concentrations of major ionic species (nss-sulfate, nitrate, and ammonium), OC, EC, and PM2.5 during each sampling period (the average data during 1994–2007 are obtained from Kim et al. [Citation2011]).](/cms/asset/3ddd298a-b5f2-4e8b-a74c-249000cbf3ef/uawm_a_1001883_f0004_b.gif)
In the ambient atmosphere, sulfur dioxides (SO2) and nitrogen oxides (NOx) undergo a series of oxidations to form H2SO4 and HNO3, respectively. These species typically react with other bases (e.g., ammonia) that are present in the atmosphere to produce sulfate and nitrate salts in aerosols. A scatterplot of [nss-SO42-] versus [NH4+] during the whole sampling period (except AD event) is shown in . The slope is 1.00, and the correlation coefficient is 0.93. These values suggest that the ammonia is sufficient to fully neutralize the sulfate. When a scatterplot of [nss-SO42-] + [NO3-] versus [NH4+] + [nss-Ca2+] + [nss-Mg2+] is created, as shown in , the slope is 1.03. Thus, aerosols are somewhat acidic. In addition, the slope between [nss-SO42-] + [NO3-] versus [NH4+] + [nss-Ca2+] + [nss-Mg2+] increased to 1.40 during the LTP events (Supplementary Materials S3), suggesting that aerosols during LTP events are more acidic. The depletion percentage of Cl was also calculated based on previous calculation (Cl depletion (%) = (1.81 × Na-Cl)/(1.81 × Na) × 100) (Zhao et al., Citation2008). It is 75.4%, suggesting that a significant amount of Cl was reacted with acidic gas species.
Figure 5. Scatter plots of (a) [nss-SO42-] versus [NH4+], and (b) sum of [nss-SO42-] + [NO3-] versus sum of [NH4+] + [nss-Ca2+] + [nss-Mg+] during the whole sampling period (except AD event).
![Figure 5. Scatter plots of (a) [nss-SO42-] versus [NH4+], and (b) sum of [nss-SO42-] + [NO3-] versus sum of [NH4+] + [nss-Ca2+] + [nss-Mg+] during the whole sampling period (except AD event).](/cms/asset/7e6a5047-3381-471b-b7ac-9cca40da653f/uawm_a_1001883_f0005_b.gif)
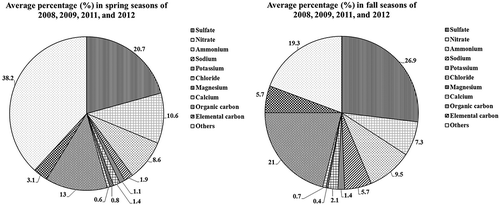
The average fractions (%) of the major chemical components in PM2.5 in the spring and fall are shown in . The higher nitrate fraction in the spring was caused by the production of nitrate in dust particles during the AD event that occurred in the spring 2011. It is possible that the higher fraction of “others” in the spring may contain mineral components (not measured in this study) of dust particles, which appeared in spring, but other components cannot be ruled out. Both sulfates and OC were higher in the fall than in the spring. As indicated in , on average, northwest air masses (polluted) were more dominant in the fall than spring, leading to the higher sulfate and OC. Biomass burning events might also play an important role in the higher OC. Previous satellite data often reported that biomass burning events (agricultural produce burning and forest fires) happened in the fall more frequently than spring in East Asia (Ichoku et al., Citation2008). Also, days with high potassium (an indicator of aerosols from biomass burning) fractions (that is, higher potassium than average values) were more often observed in the fall than in the spring (41.4% vs. 23%). The average EC concentration was 0.7 ± 0.4 μg/m3, or 3.6% of the PM2.5. There was no clear difference in the EC between the spring (0.6 µg/m3) and the fall (0.7 µg/m3). The OC/EC ratio can be a useful indicator to infer primary and secondary OC. With the OC/EC value less than 2.2, the OC would be produced by primary combustion sources like EC (Turpin and Huntzicker, Citation1991). The daily OC/EC ratio varied from 1.2 to 21.0, with averages of 5.1 ± 3.1 in the spring and 6.7 ± 3.5 in the fall, indicating that the OC would be secondary OC. Also, the correlation between OC and EC (R2 = 0.281 in the spring and R2 = 0.454 in the fall) was not strong. Our data suggest that the significant amount of OC was transported over a long distance, rather than locally produced along with EC.
Figure 6. Average fraction (%) of chemical components in PM2.5 (spring vs. fall).
The LTP events were defined as days when the level of the daily PM2.5 was more than 2 times higher than the average background value of the PM2.5 (around 14 µg/m3) and when the air mass originated from continental China and Korea. When air masses arrived from the ocean (south or southeast), the PM2.5 concentration level was as low as 10 μg/m3. In total, six strong LTP event days were identified during the entire sampling period. compares the concentrations of the chemical components of each LTP event with the average values without LTP event days. In the LTP 4 event (AD event) of 5/12/2011–5/14/2011, the increase of PM2.5 (59 μg/m3) would be caused by the transport of dust particles. The PM10 was as high as 180 μg/m3. The air mass backward trajectory reveals that the desert was the source of the PM. Additionally, high concentrations of nitrate, calcium, and magnesium were observed in the LTP 4 as shown in . The enhanced nitrate concentration during the AD event could be attributed to the production of calcium nitrate by the interaction of nitric acid and dust particles (i.e., dust particles take up nitric acid from the gas phase) (Fairlie et al., Citation2010).
Table 2. Comparison of chemical components in PM2.5 among the LTP events
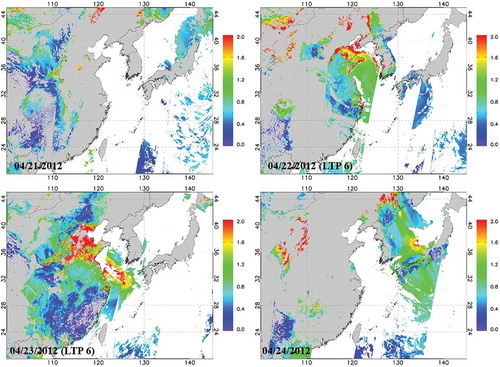
During LTP 3 and LTP 6, sulfate was more dominant (the mass fraction of sulfate in PM2.5 increased up to 29–31%) than OC, while during LTP 2, OC was higher than sulfate (mass fraction of OC in PM2.5 was 22%) (i.e., sulfate-dominant LTP vs. OC-dominant LTP). Both sulfate and OC were comparable in LTP 1 and LTP 5. In sulfate-dominant LTP events, air masses traversed the Shandong area of China and directly arrived at Gosan without passing over the Korea Peninsula, as shown in . The air masses arrived at the sampling site within 48 hr from mainland China. In eastern China, including Shandong and Henan Provinces, there are abundant SO2 emission industrial sources, and the concentration significantly increased after 2000 (Zhang et al., Citation2009; Lu et al., Citation2010). In sulfate-dominant LTP events, gas-phase ammonia and carbonate/bicarbonate in dust and sea spray are not sufficient to fully neutralize the sulfate (i.e., acid) due to high SO2 emissions over the industrial area of China (Lu et al., Citation2010; Zhang et al., Citation2009). The AOD data during LTP 6 (sulfate-dominant) event are also shown in , including data before and after the event. The high concentration of aerosols (i.e., high AOD) moved from eastern China over the Yellow Sea to Korea and Japan. The AOD at the Gosan site was calculated as 1.63 on April 22, 2012. Lee et al. (Citation2006) reported that fire and haze events led to the increase of the AOD (0.6–2.0). The AOD increased up to 2.34 during the LTP 4 event (i.e., the AD event), while on clear days, the AOD was observed to be less than 0.4.
Figure 7. Air-mass backward-trajectory data during the (a) sulfate-dominant versus (b) OC-dominant LTP event days (staring time: 00:00 UTC, time interval at each trajectory: 1 hr, time interval between each dot in the singe trajectory: 1 hr).
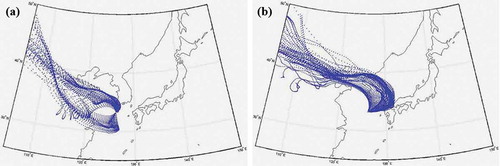
Figure 8. AOD data before, during, and after LTP 6 event.
On the other hand, in the OC-dominant LTP event, the air masses traversed Hebei Province (including Beijing and Tianjin) in China and the Korean Peninsula to arrive at the Gosan site, as shown in . The OC significantly increased under the direct influences of both Korea and China. In the OC-dominant LTP event, a higher residence time of the air masses in China and Korea (the air masses arrived at the sampling site within 60–80 hr from mainland China) was observed compared to the sulfate-dominant LTP event (air masses arrived at the sampling site within 48 hr from mainland China); thus, the OC might be highly oxidized (i.e., aged). Also, the OC/EC ratio in the OC-dominant LTP event was 5.1, which is higher than average value without LTP event days. Topping et al. (Citation2004) also showed that the organic fraction at Gosan under continental air masses was highly oxidized based on their compositional data. In the OC-dominant LTP event, the AOD was not available at Gosan, but the AOD over the Korean Peninsula, including Seoul, increased to 2.5.
Conclusion
Four-year measurements of OC, EC, and water-soluble inorganic ions (sulfate, nitrate, ammonium, chloride, calcium, magnesium, potassium, and sodium) in PM2.5 in the spring and fall of 2008–2012 (excluding 2010) were conducted at a site in Gosan to investigate chemical characteristics of long-range transported atmospheric aerosols. The sampling site has almost no local anthropogenic PM sources within 40–50 km, and it is an ideal place to study long-range transported atmospheric aerosols in northeast Asia. The PM2.5 concentration varied from 2.9 to 68.3 μg/m3 during the entire sampling period (2008–2012), with an average value of 18.6 μg/m3. No significant increase or decrease in PM2.5 occurred in recent years (2008–2012). On average, sulfate was the most dominant chemical species in PM2.5, regardless of the season. The data showed that sulfates and OC were higher in the fall than in the spring due to more dominant northwest air masses (polluted) and more frequent biomass burning events in the fall. In the fall, days with high potassium (an indicator of aerosols from biomass burning) concentrations were more often observed. The average EC concentration was 0.7 ± 0.4 μg/m3 (3.6% of the PM2.5). There was no clear difference in the EC between the spring (0.6 µg/m3) and the fall (0.7 µg/m3), and the correlation between OC and EC was not strong; therefore, the OC measured at Gosan was likely transported over a long range, rather than produced in a similar manner as the EC. Distinct types of LTP events (i.e., sulfate-dominant LTP versus OC-dominant LTP) were identified. In the sulfate-dominant LTP events, the air masses directly arrived at Gosan without passing over the Korean Peninsula from the industrial area of China (a high SO2 emission area) within 48 hr, and the acidic fraction of sulfate was found to be predominant. The AOD was calculated as 1.63 in the sulfate-dominant LTP event. In the OC-dominant LTP events, the air masses arrived at Gosan, across the Korean Peninsula, from China (i.e., the increase of OC was influenced by both China and Korea). The much slower air mass (arriving at Gosan within 60–80 hr from mainland China and across Korea) suggests that the OC can be highly aged.
Acknowledgment
The authors thank Kwan Chul Kim for the retrieval of the aerosol optical depth (AOD) images.
Funding
The research was supported by the National Leading Research Laboratory program (NRF-2011-0015548) and the PM2.5 Research Center (NRF-2014 M3C8A5028593) funded by the Ministry of Science, ICT, and Future Planning (MSIP) and the National Research Foundation (NRF) of Korea.
Supplemental Material
Supplemental data for this article can be accessed at http://dx.doi.org/10.1080/10962247.2014.1001883.
Supplemental_materials.pdf
Download PDF (330.7 KB)Additional information
Funding
Notes on contributors
KwangYul Lee
KwangYul Lee is a Ph.D. candidate at the Gwangju Institute of Science and Technology (GIST), Gwangju, Republic of Korea.
Young J. Kim
Young J. Kim is a professor at the School of Environmental Science and Engineering in Gwangju Institute of Science and Technology (GIST), Gwangju, Republic of Korea.
Chang-Hee Kang
Chang-Hee Kang is a professor at the department of chemistry in Jeju National University, Jeju-do, Korea.
Jeong-Soo Kim
Jeong-soo Kim and Lim-seok Chang are researchers at the National Institute of Environmental Research, Ministry of Environment, Incheon, Republic of Korea.
Lim-Seok Chang
Kihong Park is a professor at the School of Environmental Science and Engineering and director of PM2.5 research center in Gwangju Institute of Science and Technology (GIST), Gwangju, Republic of Korea.
References
- Arimoto, R., R.A. Duce, D.L. Savoie, J.M. Prospero, R. Talbot, J.D. Cullen, U. Tomza, N.F. Lewis, and B.J. Ray. 1996. Relationships among aerosol constituents from Asia and the North Pacific during PEM-West a. J. Geophys. Res. D Atmos. 101(D1): 2011–23. doi:10.1029/95JD01071
- Bae, M.S., J.J. Schauer, J.T. DeMinter, J.R. Turner, D. Smith, and R.A. Cary. 2004. Validation of a semi-continuous instrument for elemental carbon and organic carbon using a thermal-optical method. Atmos. Environ. 38(18): 2885–93. doi:10.1016/j.atmosenv.2004.02.027
- Chen, L.L., G.R. Carmichael, M.S. Hong, H. Ueda, S. Shim, C.H. Song, Y.P. Kim, R. Arimoto, J. Prospero, D. Savoie, K. Murano, J.K. Park, H.G. Lee, and C. Kang. 1997. Influence of continental outflow events on the aerosol composition at Cheju Island, South Korea. J. Geophys. Res. D Atmos. 102(23): 28551–74. doi:10.1029/97JD01431
- Chow, J.C., J.G. Watson, D. Crow, D.H. Lowenthal, and T. Merrifield. 2001. Comparison of IMPROVE and NIOSH carbon measurements. Aerosol Sci. Technol. 34(1): 23–34. doi:10.1080/02786820119073
- Draxler, R.R., and G. Rolph. 2003. HYSPLIT (HYbrid Single-Particle Lagrangian Integrated Trajectory) model access via NOAA ARL READY website (http://www. arl. noaa. gov/ready/hysplit4. html). NOAA Air Resources Laboratory, Silver Spring, MD.
- Fairlie, T.D., D.J. Jacob, J.E. Dibb, B. Alexander, M.A. Avery, A. van Donkelaar, and L. Zhang. 2010. Impact of mineral dust on nitrate, sulfate, and ozone in transpacific Asian pollution plumes. Atmos. Chem. Phys. 10(8): 3999–4012. doi:10.5194/acp-10-3999-2010
- Hoell, I.M., D.D. Davis, S.C. Liu, R.E. Newell, H. Akimoto, R.J. McNeal, and R.J. Bendura. 1997. The pacific exploratory mission-west phase B: February–March, 1994. J. Geophys. Res. D Atmos. 102(23): 28223–39. doi:10.1029/97JD02581
- Huebert, B.J., T. Bates, P.B. Russell, G. Shi, Y.J. Kim, K. Kawamura, G. Carmichael, and T. Nakajima. 2003. An overview of ACE-Asia: Strategies for quantifying the relationships between Asian aerosols and their climatic impacts. J. Geophys. Res. D Atmos. 108(23): ACE 1-1–ACE 1-20. doi:10.1029/2003JD003550
- Ichoku, C., L. Giglio, M.J. Wooster, and L.A. Remer. 2008. Global characterization of biomass-burning patterns using satellite measurements of fire radiative energy. Remote Sensing Environ. 112(6): 2950–62. doi:10.1016/j.rse.2008.02.009
- Kim, J.Y., Y.S. Ghim, C.H. Song, S.C. Yoon, and J.S. Han. 2007. Seasonal characteristics of air masses arriving at Gosan, Korea, using fine particle measurements between November 2001 and August 2003. J. Geophys. Res. D Atmos. 112(7): D07202. doi:10.1029/2005JD006946
- Kim, N.K., Y.P. Kim, and C.H. Kang. 2011. Long-term trend of aerosol composition and direct radiative forcing due to aerosols over Gosan: TSP, PM10, and PM2.5 data between 1992 and 2008. Atmos. Environ. 45(34): 6107–15. doi:10.1016/j.atmosenv.2011.08.051
- Kondo, Y., Y. Komazaki, Y. Miyazaki, N. Moteki, N. Takegawa, D. Kodama, S. Deguchi, M. Nogami, M. Fukuda, T. Miyakawa, Y. Morino, M. Koike, H. Sakurai, and K. Ehara. 2006. Temporal variations of elemental carbon in Tokyo. J. Geophys. Res. D Atmos. 111(12): D12205. doi:10.1029/2005JD006257
- Korean national air pollutants emission report. 2008–2010. http://airemiss.nier.go.kr/main.jsp ( accessed October 28, 2014).
- Kwon Ho, L., K. Young Joon, W. von Hoyningen-Huene, and J. Burrow. 2006. Influence of land surface effects on MODIS aerosol retrieval using the BAER method over Korea. Int. J. Remote Sensing 27(14): 2813–30. doi:10.1080/01431160500462139
- Lee, K.H., J.E. Kim, Y.J. Kim, J. Kim, and W. Von Hoyningen-Huene. 2005. Impact of the smoke aerosol from Russian forest fires on the atmospheric environment over Korea during May 2003. Atmos. Environ. 39(1): 85–99. doi:10.1016/j.atmosenv.2004.09.032
- Lee, K.H., Y.J. Kim, and M.J. Kim. 2006. Characteristics of aerosol observed during two severe haze events over Korea in June and October 2004. Atmos. Environ. 40(27): 5146–55. doi:10.1016/j.atmosenv.2006.03.050
- Lu, Z., D.G. Streets, Q. Zhang, S. Wang, G.R. Carmichael, Y.F. Cheng, C. Wei, M. Chin, T. Diehl, and Q. Tan. 2010. Sulfur dioxide emissions in China and sulfur trends in East Asia since 2000. Atmos. Chem. Phys. 10(13): 6311–31. doi:10.5194/acp-10-6311-2010
- Menon, S., J. Hansen, L. Nazarenko, and Y. Luo. 2002. Climate effects of black carbon aerosols in China and India. Science 297(5590): 2250–53. doi:10.1126/science.1075159
- Press, China Statistics. 2008. China statistical yearbook. Almanac of China’s Finance and Banking. China statistical yearbook (1995–2006). http://tongji.cnki.net/overseas/engnavi/NaviSearch.aspx?code (accessed January 27, 2015).
- Ramanathan, V., F. Li, M.V. Ramana, P.S. Praveen, D. Kim, C.E. Corrigan, H. Nguyen, E.A. Stone, J.J. Schauer, G.R. Carmichael, et al. 2007. Atmospheric brown clouds: Hemispherical and regional variations in long-range transport, absorption, and radiative forcing. J. Geophys. Res. D Atmos. 112(22): D22S21. doi:10.1029/2006JD008124
- Sahu, L.K., Y. Kondo, Y. Miyazaki, M. Kuwata, M. Koike, N. Takegawa, H. Tanimoto, H. Matsueda, S.C. Yoon, and Y.J. Kim. 2009. Anthropogenic aerosols observed in Asian continental outflow at Jeju Island, Korea, in spring 2005. J. Geophys. Res. D Atmos. 114(3): D03301. doi:10.1029/2008JD010306
- Sciare, J., H. Bardouki, C. Moulin, and N. Mihalopoulos. 2003. Aerosol sources and their Contribution to the chemical composition of aerosols in the Eastern Mediterranean Sea during summertime. Atmos. Chem. Phys. 3(1): 291–302. doi:10.5194/acp-3-291-2003
- Seinfeld, J.H., G.R. Carmichael, R. Arimoto, W.C. Conant, F.J. Brechtel, T.S. Bates, T.A. Cahill, A.D. Clarke, S.J. Doherty, P.J. Flatau, B.J. Huebert, J. Kim, K.M. Markowicz, P.K. Quinn, L.M. Russell, P.B. Russell, A. Shimizu, Y. Shinozuka, C.H. Song, Y. Tang, L. Uno, A.M. Vogelmann, R.J. Weber, J.H. Woo, and X.Y. Zhang. 2004. ACE-ASIA: Regional climatic and atmospheric chemical effects of Asian dust and pollution. Bulletin of the Am. Meteorol. Soc. 85(3): 367–80. doi:10.1175/BAMS-85-3-367
- Seinfeld, J.H., and S.N. Pandis. 2012. Atmospheric chemistry and physics: From air pollution to climate change. Hoboken, NJ: John Wiley & Sons.
- Solomon, S. 2007. Climate change 2007—The physical science basis: Working group I contribution to the fourth assessment report of the IPCC, vol. 4. New York. NY: Cambridge University Press.
- State Environmental Protection Administration. 2006–2011. http://english.mep.gov.cn/standards_reports_soe (accessed July 10, 2014).
- Streets, D.G., T.C. Bond, G.R. Carmichael, S.D. Fernandes, Q. Fu, D. He, Z. Klimont, S.M. Nelson, N.Y. Tsai, M.Q> Wang, J.H. Woo, and K.F. Yarber. 2003. An inventory of gaseous and primary aerosol emissions in Asia in the year 2000. J. Geophys. Res. D Atmos. 108 (21): GTE 30-1–GTE 30-23. doi:10.1029/2002JD003093
- Streets, D.G., and S.T. Waldhoff. 2000. Present and future emissions of air pollutants in China: SO2, NO(x), and CO. Atmos. Environ. 34(3): 363–74. doi:10.1016/S1352-2310(99)00167-3
- Subramanian, R., A.Y. Khlystov, J.C. Cabada, and A.L. Robinson. 2004. Positive and negative artifacts in particulate organic carbon measurements with denuded and undenuded sampler configurations special issue of aerosol science and technology on findings from the fine particulate matter supersites program. Aerosol Sci. Technol. 38(S1): 27–48. doi:10.1080/02786820390229354
- Topping, D., H. Coe, G. McFiggans, R. Burgess, J. Allan, M.R. Alfarra, K. Bower, T.W> Choularton, S. Decesari, and M.C. Facchini. 2004. Aerosol chemical characteristics from sampling conducted on the Island of Jeju, Korea during ACE Asia. Atmos. Environ. 38(14): 2111–23. doi:10.1016/j.atmosenv.2004.01.022
- Turpin, B.J., and J.J. Huntzicker. 1991. Secondary formation of organic aerosol in the Los Angeles Basin: A descriptive analysis of organic and elemental carbon concentrations. Atmos. Environ. Part A Gen. Topics 25(2): 207–15. doi:10.1016/0960-1686(91)90291-E
- Watson, J.G., J.C. Chow, and L.-W.A. Chen. 2005. Summary of organic and elemental carbon/black carbon analysis methods and intercomparisons. Aerosol Air Qual. Res. 5(1): 65–102.
- Zhang, D., and Y. Iwasaka. 2004. Size change of Asian dust particles caused by sea salt interaction: Measurements in southwestern Japan. Geophys. Res. Lett. 31(15): L15102-1–4. doi:10.1029/2004GL020087
- Zhang, Q., D.G. Streets, G.R. Carmichael, K. He, H. Huo, A. Kannari, Z. Klimont, L. Park, S. Reddy, and J. Fu. 2009. Asian emissions in 2006 for the NASA INTEX-B mission. Atmos. Chem. Phys. 9(14): 5131–53. doi:10.5194/acp-9-5131-2009
- Zhao, Y., and Y. Gao. 2008. Acidic species and chloride depletion in coarse aerosol particles in the US east coast. Sci. Total Environ. 407(1): 541–47. doi:10.1016/j.scitotenv.2008.09.002