
Abstract
Recovering valuable metals such as Si, Ag, Cu, and Al has become a pressing issue as end-of-life photovoltaic modules need to be recycled in the near future to meet legislative requirements in most countries. Of major interest is the recovery and recycling of high-purity silicon (>99.9%) for the production of wafers and semiconductors. The value of Si in crystalline-type photovoltaic modules is estimated to be ˜$95/kW at the 2012 metal price. At the current installed capacity of 30 GW/yr, the metal value in the PV modules represents valuable resources that should be recovered in the future. The recycling of end-of-life photovoltaic modules would supply >88,000 and 207,000 tpa Si by 2040 and 2050, respectively. This represents more than 50% of the required Si for module fabrication. Experimental testwork on crystalline Si modules could recover a >99.98%-grade Si product by HNO3/NaOH leaching to remove Al, Ag, and Ti and other metal ions from the doped Si. A further pyrometallurgical smelting at 1520ºC using CaO–CaF2–SiO2 slag mixture to scavenge the residual metals after acid leaching could finally produce >99.998%-grade Si. A process based on HNO3/NaOH leaching and subsequent smelting is proposed for recycling Si from rejected or recycled photovoltaic modules.
Implications:
The photovoltaic industry is considering options of recycling PV modules to recover metals such as Si, Ag, Cu, Al, and others used in the manufacturing of the PV cells. This is to retain its “green” image and to comply with current legislations in several countries. An evaluation of potential resources made available from PV wastes and the technologies used for processing these materials is therefore of significant importance to the industry. Of interest are the costs of processing and the potential revenues gained from recycling, which should determine the viability of economic recycling of PV modules in the future.
Introduction
To reduce the impact of global warming, several countries around the world have developed and used renewable energy resources to reduce greenhouse gas emissions. In this respect, the European Union (EU) has taken a leading role by adopting a 20% carbon reduction by 2020, a high target to be followed by most developed countries. One of the many options adopted is by replacing fossil fuels with solar energy. Electricity can be generated by capturing solar energy via a thermal mass or via photovoltaic (PV) devices (Desideri et al., Citation2013). According to a White Paper presented by the U.S. Department of Energy (U.S. DOE, Citation2010), the PV technology has improved markedly over the last decade, significantly reducing the cost of solar cell fabrication from USD ($) 8/W in the late 1990s for utility-scale systems to below $3.50/W in 2010 in the United States. The installation costs for Europe ($5.00/W), China ($4.42/W), and Japan ($5.02/W) are comparable to those in the United States for utility-scale projects, although it is generally more expensive for smaller scale residential applications (Branker et al., Citation2011). According to Razykov et al. (Citation2011), the PV market is dominated (>40%) by grid-connected residential systems at present. Module prices are in the range of $3.0–4.5/peak watt (system prices $5–7/W). The U.S. DOE forecasts that the cost of solar energy will be reduced to $0.06/kWh for utility, $0.08/kWh for commercial, and $0.10/kWh for residential applications by 2015 (Razykov et al., Citation2011). This should encourage many other countries to supplement their energy needs with solar energy-based electricity generation (Dincer, Citation2011; Solangi et al., Citation2011; Wang and Qiu, Citation2009; Tour et al., Citation2011; Liou, Citation2010). The European Photovoltaic Industry Association (EPIA) predicted that by 2040, PV energy might contribute up to 14% of the world’s electricity need (Marwede and Reller, Citation2012).
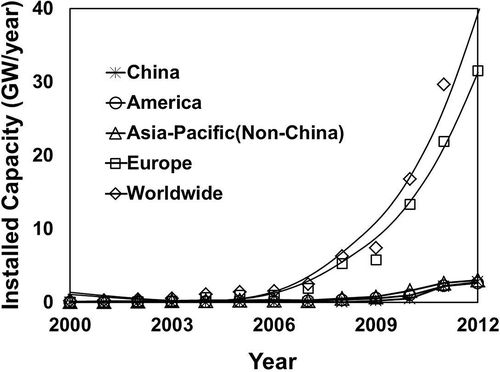
The world’s PV installed capacity has increased rapidly over the last 15 years. The total world production of PV modules produced was equivalent to 7.3 GW in 2009 according to McDonald and Pearce (Citation2010), on par with 7.437 GW predicted in other studies (Shiue and Lin, Citation2012; EPIA, Citation2012). China and Taiwan have been the main producers of modules, accounting for more than 49% of all manufactured PV cells since 2009. China produced more than 3.5 GW in 2009, while Taiwan’s production reached nearly 1.5 GW in the same year (Bio Intelligence Service, Citation2011). Most of this production has been exported to Germany and other countries in the EU. However, the projected use of solar energy would rise significantly over the next two decades in the main markets (Germany and Italy as leaders in EU, the United States, Japan, and China) as shown in . These data seem to fit well with those collected by the European Association for Recycling of PV Modules (PV Cycle), formed by companies representing 90% of solar cell production/use in Europe (PV Cycle, Citation2011). By the end of 2011, the yearly installation of PV had reached nearly 30 GW. The new installations are projected to increase annually by 25% to 2020, then 12.5% yearly to 2025, then 9.5% to 2030 (Bio Intelligence Service, Citation2011).
Figure 1. Solar energy installed—yearly capacity (data from EPIA, Citation2012). Europe has 27 countries using solar energy, with Germany and Italy as leaders. and Asia-Pacific (non-China) includes Japan, Australia, Korea, and India.
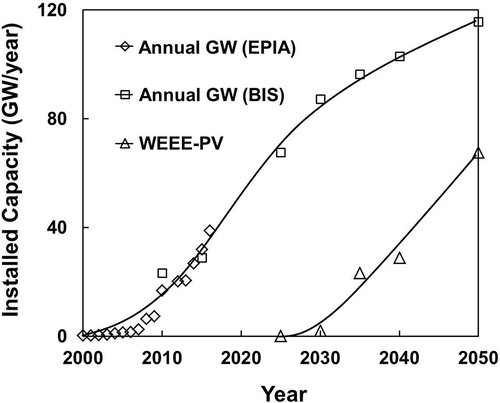
Although this represents significant amounts of PV modules to be installed in the future, and consequently, wastes generated by the industry, there is a lag of time for the end-of-life decommissioning of PV modules. Most experts believe that the installed PV modules would last for a minimum of 25 years, although some predicted shorter life spans of 20 years (Zuser and Rechberger, Citation2011). There is no doubt that solar energy has expanded rapidly due to the acceptance by the public. However, public concern over the handling of metallic wastes such as Cd, Se, Pb, and others used in PV modules is growing, which prompted the industry and government to look at their safe disposal or recycling in the future. As an example, the EU (Neidlein, Citation2012) has issued a directive, which will be enforced by laws in all member countries, to implement protocols for the collection and recycling of PV panels by their suppliers. PV modules are now classified as electrical and electronic equipment (WEEE) and have to be collected by suppliers at their end of life. Recycling of PV modules for recovering metal values and at the same time minimizing the wastes generated has become a major concern now for the solar energy industry. shows the rapid expansion of the current annual new installed capacity (23.28 GW in 2010) to the projected 103 GW within 20 yr (to 2040), according to the forecast by EU agencies (Bio Intelligence Service, Citation2011; EPIA, Citation2012). The WEEE-PV waste has already been collected and accumulated, to be treated in the future when its tonnage warrants economic viability.
Figure 2. Long-range forecast of annual installed capacity and waste generated (PV under EU’s WEEE classification). Data from EPIA (Citation2012) and Bio Intelligence Service (Citation2011).
Another issue related to waste minimization and Si recovery worth considering is the processing of kerf loss slurry. During the cutting of Si ingots for the production of Si wafers, 30–40% of Si is lost. The separation and recovery of high-purity Si from SiC and other sawing materials has been recently evaluated (Tomono et al., Citation2012; Wang et al., Citation2012; Tsai, Citation2011a, Citation2011b). The recovery of high-purity Si from kerf loss is as attractive as PV module recycling, as close to 50% of this metal is lost during wafer production.
This paper evaluates the key issues related to PV recycling, aiming to reflect the scenario that the world and in particular, the Korean solar energy industry will face in the future. Emphasis is placed on the estimation of metal value that can be recovered from Si-based modules. Tests were conducted to confirm the leachability of all metal dopants using chemicals and to determine the grade of Si that can be recovered from acid etching and purification smelting.
Critical Evaluation of Photovoltaic Waste Recycling
The industry has recognized two major factors that affect the recycling of PV modules in the years to come. Of utmost concern are environmental issues due to the generation of waste and old modules (which since 2012 are classified as WEEE by the EU and have to be collected by suppliers at end of life) due to contamination of Cd, Pb, and so on. The potential shortage of raw materials has also drawn a great deal of attention by the industry. According to experts, recycling of PV modules is not viable at the present time due to the fact that the volume of wastes generated is still too small to be economically viable for recycling. However, by 2030, the waste generated from PV modules is expected to reach over 130,000 tpa, the level that is sustainable for its recycling, according to the European Association for the Recovery of PV Modules (PV Cycle, Citation2011).
Value of contained metals in PV modules
The PV technology has advanced rapidly using silicon and other metals that are rare or produced in small quantities (Paridaa et al., Citation2011). The recycling of thin-film PV modules based on CdTe and CIGS (copper, indium, gallium, germanium, and selenium) is considered worthwhile to recover high-value metals used, as they have been produced only in small quantities annually (<2,000 tpa for Se, <600 tpa for In, and <150 tpa for Te), according to Berger et al. (Citation2010). The market for both of these thin film types is expected to grow from <5% now to 25% after 2020 (Bio Intelligence Service, Citation2011) and 50% by 2040 (Zuser and Reshberger, Citation2011). However, the production of crystalline silicon-based (c-Si) PV modules has been dominant (>90% of the market) for more than a decade due to their lower cost and higher efficiency (EPIA, Citation2012; Kang et al., Citation2012). It is safe to assume that in the period 2030–2050 the metals that will be recovered from PV module recycling are predominantly Si, Ag, Cu, and Al; all are metal components of crystalline (c-Si) solar cells.
The raw material cost, mainly of Si for (c-Si) PV modules, can be estimated from the quantity used for producing each peak watt of solar energy. The Advanced Research Projects Agency of the U.S. Department of Energy summarized the cost component for making 1 W of solar energy in its White Paper reported at a workshop in Washington, DC (U.S. Department of Energy, Citation2010). According to this report, although there is a push to reduce the cost of 1 W of solar energy to $1.00/W by 2017, the production cost as of 2010 was $1.70/E, of which the chemicals and metals were the main contributors to the raw material components (Si, Cu, Al, dopants, chemicals), estimated at $0.54/W.
Based on the world production of solar energy at 12 GW in 2010 (), the cost for Si raw material, dopants, and chemicals ($0.54/W × 12 × 109 W/yr) could easily reach $6.5 billion. With the target of 85% of PV wastes to be recycled from now on as set by the EU (Neidlein, Citation2012; Bio Intelligence Service, Citation2011), this represents a major resource of Si and other rare metals that should be recovered in the future.
gives the breakdown of all metals used in the production of crystalline (c-Si) and amorphous (a-Si) PV modules, the two major types produced over the last 15 years. It can be easily recognized that the greatest potential for metal recovery is from (c-Si) PV modules, as they contain more metal value compared to other thin film types. From data summarized in and the current (2012) metal prices, these major metal components (Si, Cu, Al, and Ag) contribute to a value of $126.54/kW if 4N Si is used in the fabrication process. All metal values, of which Si represents the highest contribution, therefore constitute ˜25% of the raw material and chemical cost of $0.54/W reported by the U.S. DOE (2010) for (c-Si) PV modules.
Table 1. Types of metals that can be recovered from PV modules
It is worth noted that the high-purity Si (4N–5N) used for producing wafers is ˜9 tonne/MW (Shiue and Lin, Citation2012), although only ˜3.07 tonne/MW ends up in the PV modules, as shown in . This indicates that a significant amount of Si is lost due to breakage or attrition during cutting and fabrication, and this can also be recycled in the same recycling plant in the future. In this respect, the loss of high-purity Si to sawing waste (containing SiC) and so on during wafer production could be 40% of the starting material. The processing of the resulting kerf loss from wafer fabrication has also been a topic of much research lately (Wang et al., Citation2012; Tomono et al., Citation2012; Tsai, Citation2011a, Citation2011b; Lin et al., Citation2010).
The EU is aiming to collect and recycle 85% of end-of-life PVs. Combining this with standard total metal process recoveries from primary or secondary resources (at 80–90%), it is expected that 70–75% of the metal value ($126/kW for 4N-c-Si PV) from PV wastes could be recovered. This represents a minimum recovered metal value of $95/kW PV-energy produced at the 2012 4N Si metal price.
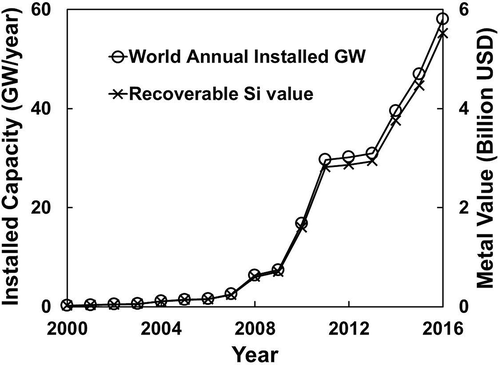
shows the world installation of PV energy, yearly from 2000 to 2011 with projected expansion into 2016 (EPIA, Citation2012). The cumulative installed capacity up to 2016 has reached 274.19 GW, representing a metal value of $26.05 billion (based on the existing metal value of $95/kW at 2012 for 4N Si prices estimated earlier).
Figure 3. Annual PV installed capacity worldwide and recoverable metal value (based on 2012 average metal prices).
Supply of raw materials and potential for metal recovery from PV waste
Marwede and Reller (Citation2012) predicted that the industry has to rely on all Te recycled by 2038 to meet its need of new thin-film CdTe installations. Zuser and Rechberger (Citation2011) proposed a model to predict the utilization of all metals in the fabrication of PV modules in the period 2010–2040. For non-Si thin-film PV, apart from Te, other metals required (Cd, Cu, In, Ga, Se) seem to be of adequate supply to meet the demand. However for both c-Si and a-Si PVs the “realistic” prediction for maximum Si demand reaches 445,543 tonne/yr by 2040, which should be mostly met by recycled Si.
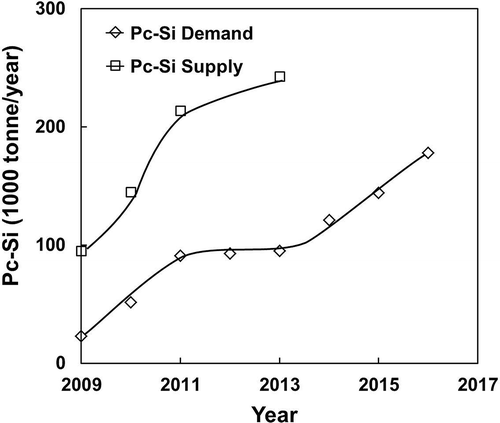
The short-term forecast for the Si demand and supply until 2016 can be determined from published data. Using the figures reported by Bio Intelligence Service (Citation2011) on behalf of the EU (summarized in ), the requirement for (c-Si) PV modules is 3.069 tonne Si/MW installed. The forecast of polycrystalline Si demand for 2016 as shown in would reach 178,000 tonne Si/yr, corresponding to an annual installation of 58.04 GW capacity. The supply of polycrystalline Si at this stage, as tabulated by the U.S. Geological Survey (USGS) in its “Mineral Yearbook for Si” (2010), shows more than twice the amount contained in c-Si PV cells up to then. Taking into account the kerf loss (at 30–40%) and breakage of Si wafers/cells during production at maximum 50% (Tomono et al., Citation2012; Wang et al., Citation2012; Tsai, Citation2011a, Citation2011b; Lin et al., Citation2010), the demand for polycrystalline Si up to 2016 should be easily met. According to the USGS Mineral Industry Survey (USGS, 2012), the resources for Si (high purity silica) are abundant around the world and the supply for Si should be more than adequate to meet the demand for all types of Si. The increasing cost of production, if any, for c-Si is the only concern for the industry. At the present stage, there seems to be a surplus of high-purity polysilicon (7N–9N) used for the fabrication of PV cells, which leads to the significant price drop lately (Wicht, Citation2012; Glenn, Citation2012).
Figure 4. Short-term supply and demand for polycrystalline Si until 2016 calculated from data from Bio Intelligence SErvie (2011) Report for the EU and supply data from USGS (2010) Mineral Yearbook for Si.
Based on the current and future installation forecast by EPIA (Citation2012) and Bio Intelligence Service on behalf of the EU (2011), the long-term demand for c-Si is plotted in , together with the potential supply from end-of-life WEEE-PV modules targeted in the EU and the total Si production. The demand for Si is based on twice the contained c-Si in PV modules (2 × 3.069 tonne/MW), counting 50% kerf loss and breakage during wafer fabrication. Results are also tabulated in for current and projected demand of c-Si and its supply from mine production and recycled PV.
Figure 5. Long-term demand and supply for c-Si from EU’s WEEE-PV recycling and current/short-term Si production from mineral resources.
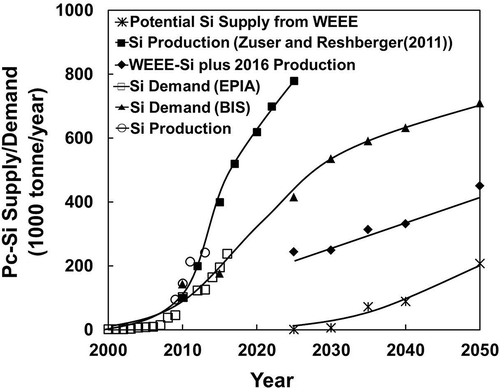
Table 2. Current and projected long-term demand and supply (tonnes per year) of c-Si from EU’s WEEE-PV recycling and current/short term production. Data from EPIA-Citation2012 and Bio Intelligence Service (Citation2011)
It should also be of top priority to develop new technology now for the separation and recovery of high purity c-Si from SiC, grinding material, and so on in the kerf loss (40%), rather than waiting for the recycled PV modules to build up to a significant level from 2030 onward.
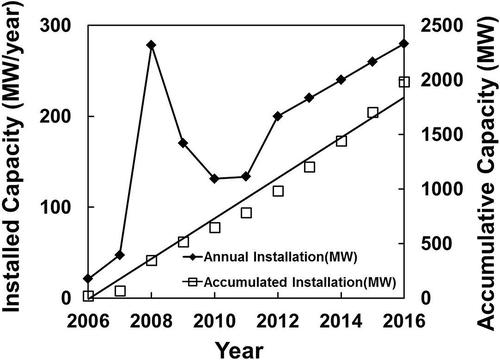
The PV industry in Korea, however, is modest, compared to those reported earlier in this paper. Data from the Korea Photovoltaic Industry Association (2012) are plotted in , showing less than 200 MW of PV panels has been installed yearly since 2007, except for 2008, which saw the installation peak at 273 MW. In the short-term projection until 2016, Korea would only install 200–280 MW/yr. The total solar cell production capacity reached a level as high as 1.3 GW/yr in 2010, but most of this has been exported. The outlook for the solar energy industry is encouraging with the government’s announcement that from 2015, the country would investment USD20 billion to expand the use of PV in Korea (KOPIA, 2012).
Figure 6. Annual installed capacity in Korea (data from EPIA, Citation2012).
The recycling of PV modules in Korea has a potential to recover only $25–30 million/yr of metal values contained from 2030 onward (at $95,000/MW using 4N Si feed and annual installation of 250–300 MW) unless there is a significant expansion of solar energy application in the next decade. No cost is yet anticipated at this stage for the recovery of this described metal value until a proven recycling process flow sheet is determined.
Proposed PV module recycling processes
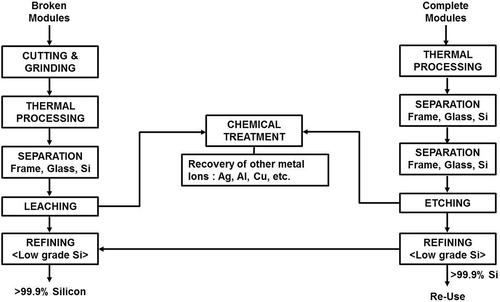
There are several processes currently being developed to recover valuable metal components from PV wastes (Berger et al., Citation2010; Kang et al., Citation2012; Klugmann-Radziemska et al., Citation2010; Klugmann-Radziemska and Ostrowski, Citation2010). Several process steps need to be incorporated to separate the metal frame, back sheet, EVA resins, and the protective tempered glass sheet before the PV modules can be recovered. These modules are then subjected to chemical leaching to produce >99% Si for recycling. A typical flow sheet for Si module recycling is shown in .
Figure 7. Typical process adopted for recycling Si modules incorporating thermal treatment to remove the ancillary materials before chemical treatment.
Experimental Procedures
The materials tested were collected from Symphony Solar (Korea) as broken PV cells that have been manually dismantled from their modules at the plant. The separation of frame–glass–Si wafers was completed at the plant and is not the focus of this research. Both monocrystalline Si and polycrystalline Si cells were tested. All copper wiring to the cells was cut off but the conducting strips were left “as-is” for treatment. All cells were crushed to pieces of 1–2 cm2 before weighed samples were subjected to leaching tests. The Si content of the original material was assayed in the range of 97–98% Si.
As crushed pieces of Si cells were used for the leaching tests, they could not be suspended properly for effective leaching. An ultrasonic bath (KODO, model NXP-5030) was therefore used to create microstirring and to promote the leaching of doped metal ions such as Ag, Al, Cu, and others and the conducting strips from the cell material. Self-heating of the solution by ultrasound raised the temperature to 40ºC in most cases, providing also favorable conditions for leaching. Known weight samples were added to the leachants (1–3 M HCl or H2SO4 or HNO3 and NaOH) at a weight ratio for solid/leachant of 1:5 and leached for 2 hr. Leached solution samples (2 mL) were taken to determine the percentage of metal recovered by mass balance calculations. Solutions were analyzed for metal concentrations using inductively coupled plasma–mass spectroscopy (ICP-MS; Agilent 5500). In some cases, leached material was also subjected to scanning electron microscopy (SEM) with energy-dispersive spectroscopy (EDS) analysis to check the composition of the Si surface and more. For the smelting tests, acid-leached Si cells were then ground and mixed with a (CaO + CaF2 + SiO2) mixture at a Si cell/slag mixture weight ratio of 5:1, 7:1, and 10:1 and melted at 1520ºC for 6 hr. The slag mixture was prepared with equal weights of CaO, CaF, and SiO2.
Results and Discussion
Leaching/etching of metal ions from Si cells
In this study the etching and/or leaching of metal additives from broken Si cells was conducted in batches to optimize the conditions for high-purity Si recovery. Broken PV wafers were subjected to leaching at 20–40ºC, using either hydrochloric, sulfuric and nitric acid, or caustic NaOH, under ultrasonic treatment to enhance the leaching rate. The concentration of the acids used was varied from 1 to 3 M and treatment time was within 2 hr. The results for these leaching tests are summarized in and , showing the effect of time and acid concentration, respectively, for different types of leachants. Only typical results for Ag and Al additives for both single-crystal and poly-crystal Si cells are shown, as the other components were also mostly removed. The removal (%) of a metal was calculated from the available mass in the original sample used and the metal content in the leached solution.
Figure 8. Effect of time on acid leaching of Al and Ag for both single-crystal (Sc) and poly-crystal (Pc) Si modules.
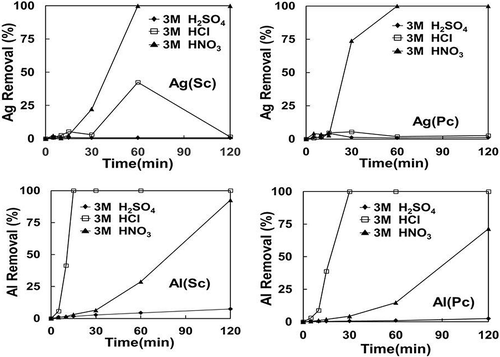
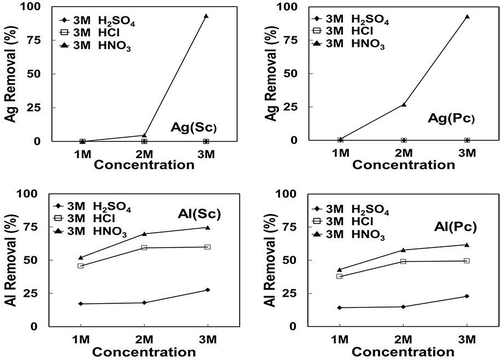
Figure 9. Effect of concentration of different acids (HNO3, H2SO4, and HCl) on the extraction of Al and Ag.
The chemical etching/leaching of metals with nitric acid (oxidizing acid) can be represented by the chemical equation
Both sulfuric acid and hydrochloric acid are not effective for Ag dissolution due to formation of insoluble salts of silver sulfate or chloride. As later shown in the Stabcal modeling and SEM analysis, Al could only be fully dissolved with NaOH after acid leaching due to possible formation of Al–Si compounds during acid treatment.
The use of nitric acid as an oxidizing acid is more effective in dissolving most metals, including silver. The etching efficiency increases with concentration of the acid used for Al extraction, whereas nitric acid leaching only partly removes aluminum, which requires a subsequent treatment with NaOH. The chemical etching process would yield up to 99.98% Si after treatment typically, as shown in .
Table 3. Composition of Si wafers before and after chemical treatment using 3 M nitric acid and 3 M sodium hydroxide (all are in mg/kg except Si)
The chemical leaching could produce 3N Si as shown in , although the treatment could remove critical components of P and B to less than the specification for 5N Si ingots (<5 mg/kg P and <3 mg/kg B; Symphony Silicon Ltd, Korea). However, the total metal content is still higher than specification (<2 mg/kg total metal) for 5N Si.
Smelting with (CaO + CaF + SiO2) slag mixture
A subsequent pyrometallurgical treatment using a (CaO + CaF + SiO2) slag mixture to scavenge residual metals or metal oxide remaining in the Si material was also found effective in removing residual metal additives. The addition of this slag mixture corresponded to 5:1, 7:1, and 10:1 weight ratio with respect to the acid-leached Si material (containing minimum 3N Si). The smelting at 1520ºC for 6 hr of the acid-leached Si and the slag mixture would yield >99.998% Si final product. This smelting step is believed to also remove residual SiO2 from the oxidation of Si when nitric acid is used. Typical compositions of Si materials before and after pyrometallurgical treatment are shown in .
Table 4. Compositions of materials before and after pyrometallurgical treatment at different CaO–CaF2–SiO2 slag mixture/Si cell ratios (all are in mg/kg except Si)
SEM-EDS analysis of the front and back of random samples of polycrystalline and single-crystalline cells (before and after chemical treatment) shows elements detected as shown in . Areas (A–G) correspond to the SEM images presented in .
Table 5. Composition (%) of different areas of determined by SEM-EDs
Figure 10. SEM-EDS analysis of a polycrystalline (top) and monocrystalline (bottom) Si cell samples.
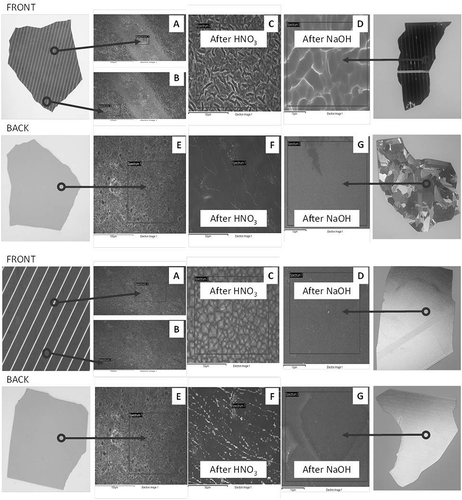
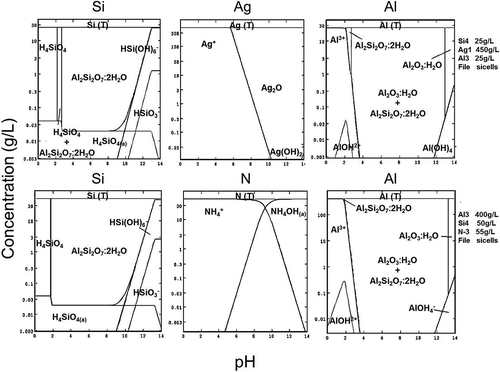
The SEM-EDS analysis confirms the process chemistry, which needs to be understood before the leaching scheme was devised. As shown before in and , HCl and H2SO4 are not effective in dissolving precious metals (Ag), and HNO3 as oxidizing acid is more suitable for leaching. In this respect, chemical speciation modeling based on Stabcal (Huang, Citation2008), which has been used effectively in predicting metal dissolution and precipitation characteristics (An et al., Citation2012), was carried out to also confirm the chemical leaching of Si cells. Simulation of conditions where 100 g of Si cells (front and back Al-SiN and Ag-Al-Si materials) was leached in 500 mL of leachant shows stability of various Si, Ag, and species at different pH values in the pH range 0–14 (). The results indicate that most critical to the dissolution processes is the use of caustic NaOH to dissolve Al, as solid Al2SiO7·H2O could be formed at low pH to passivate the dissolution process. The use of NaOH in the second stage of leaching also removes SiO2 coating, as most should be solubilized at high pH. This finding allows caustic to be effectively used to dissolve antireflection coating materials (SiO2 and silicon nitride) and avoids toxic HF being used in the leaching process for such a task.
Figure 11. Stabcal speciation modelling showing the stability of different species formed during leaching (shaded area: solid species).
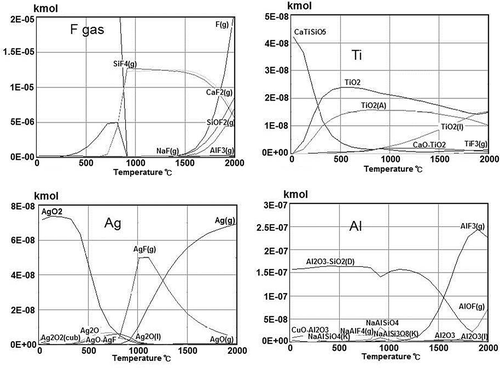
Outotec’s HSC (HSC Chemistry, n.d.) software was used to predict the processes of removing residual impurities from the acid-treated Si by smelting with a (CaO + CaF + SiO2) slag mixture. Typical results (CaO + CaF + SiO2)/Si mass ratio 10:1 are shown in for major impurities left in the treated Si (Ti, Ag, Al). At the smelting temperature 1500–1600ºC, Ti would be incorporated into the slag as Ca-titanate or TiO2. For Al, apart from aluminum silicate, which would be transferred to the slag form, an AlF3 gas phase is predicted. The gaseous phase also contains Ag(g) and other fluorides of Ag, Na, Al, and Si. The smelting process therefore has to incorporate a fluoride treatment step to handle this gas emission.
Figure 12. HSC modeling for predicting removal of impurities from Si melts using CaF2–CaO–SiO2 mixtures.
Conclusions
It is technically feasible to recycle PV modules to recover Si, the main and most costly component of crystalline-Si cells. Si cells could be first leached in nitric acid, then caustic sodium hydroxide. Although nitric acid (initial 3 M) could remove all Ag, it cannot completely remove Al or N. Subsequent leaching in NaOH would remove N and Al completely to yield 99% Si. Subsequent smelting of the (HNO3 + NaOH)-treated materials at 1520ºC with CaO–CaF2–SiO2 is used to scavenge all metal impurities to produce >99.998% Si.
Although the cost benefit of recycling depends also on other aspects of recycling, including collection and sorting, to separate the Si cells from other ancillaries, recycling of PV modules is necessary to fit in with the regulatory requirements of several countries around the world. The industry should benefit from the corporate and social responsibility point of view by handling and recycling its wastes in a way to fit in with the “green energy” image PV systems are presenting.
Additional information
Notes on contributors
Youn Kyu Yi
Yoon Kyu Yi and Hyun Soo Kim are master’s-degree students within the Department of Energy & Resources Engineering. Sung Kil Hong is a professor in materials science and engineering while Myong Jun Kim is professor in energy and resources engineering. Tam Tran was previously professor and director of the Centre for Minerals Engineering at the University of New South Wales (Sydney, Australia) until 2007. He joined Chonnam National University as a professor in minerals engineering economics in 2009. All authors are with Chonnam National University in Gwangju, Korea.
References
- An, J.W., D.J. Kang, T.K. Tran, M.J. Kim, and T. Tran. 2012. Recovery of lithium from Uyuni salar brine. Hydrometallurgy 117–118:64–70. doi:10.1016/j.hydromet.2012.02.008
- Berger, W., F.G. Simon, K. Weimann, and E.A. Alsema. 2010. A novel approach for the recycling of thin film photovoltaic modules. Resources Conserv. Recycling 54:711–718. doi:10.1016/j.resconrec.2009.12.001
- Bio Intelligence Service. 2011. Study on photovoltaic panels supplementing the impact assessment for a recast of WEEE directive. Report for the European Commission DG ENV (Project No. ENV.G.4/FRA/2007/0067). http://ec.europa.eu/environment/waste/weee/pdf/Study%20on%20PVs%20Bio%20final.pdf ( accessed 1 November 2013).
- Branker, K., M.J.M. Pathak, and J.M. Pearce. 2011. A review of solar PV levelised cost of electricity. Renew. Sustain. Energy Rev. 15:4470–4482. doi:10.1016/j.rser.2011.07.104
- Desideri, U., F. Zepparelli, V. Morettini, and E. Garroni. 2013. Comparative analysis of concentrating solar power and phtovoltaic technologies: Technical and environmental evaluations. Appl. Energy 102:765–784. doi:10.1016/j.apenergy.2012.08.033
- Dincer, F. 2011. The analysis on photovoltaic electricity generation status, potential and policies of the leading countries in solar energy. Renew. Sustain. Energy Resources 15:713–720. doi:10.1016/j.rcer.010.09.026
- European PV Industry Association. 2012. Global market outlook—2016. http://files.epia.org/files/Global-Market-Outlook-2016.pdf ( accessed 1 September 2013).
- Glenn, G.U. 2012. Solar polysilicon price in October declines the highest rate since February. http://www.isuppli.com/Photovoltaics/MarketWatch/Pages/Solar-Polysilicon-Pricing-in-October-Declines-by-Highest-Rate-Since-February.aspx ( accessed 24 October 2013).
- Huang, H. H. 2008. Stabcal software, available from Montana Tech, University of Montana. http://www.mtech.edu
- HSC Chemistry Software, Version 7.1. n.d. From Outotec. http://www.outotec.com/en/Products–services/HSC-Chemistry
- Kang, S.M., S.Y. Yoo, J. Lee, B.H. Boo, and H.J. Ryu. 2012. Experimental investigations for recycling of silicon and glass from waste photovoltaic modules. Renew. Energy 47:152–159. doi:10.1016/j.renene.2012.04.030
- Klugmann-Radziemska, E., P. Ostrowski, K. Drabczyk, P. Panek, and M. Szkodo. 2010. Experimental validation of crystalline silicon solar cells recycling by thermal and chemical methods. Solar Energy Mater. Solar Cells 94:2275–2282. doi:10.1016/j.renene.2012.04.030
- Klugmann-Radziemska, E., and P. Ostrowski. 2010. Chemical treatment of crystalline silicon solar cells as a method of recovering pure silicon from photovoltaic modules. Renew. Energy 35:1751–1759. doi:10.1016/j.renene.2009.11.031
- Korea Photovoltaic Industry Association. 2012. PV Technology Status. http://kopia.asia/en/subpage.php?p=m41 ( accessed 11 November 2013).
- Lin, Y.C., T.Y. Wang, C.W. Lan, and C.Y. Tai. 2010. Recovery of silicon powder from kerf loss slurry by centrifugation. Powder Technol. 200(3): 216–223. doi:10.1016/j.powtec.2010.02.028
- Liou, H.M. 2010. Overview of the PV technology and perpespective in Taiwan. Renew. Sustain. Energy Rev. 14(4): 1202–1215. doi:10.1016/j.rser.2009.11.018
- Marwede. M., and A. Reller. 2012. Future recycling flows of tellurium from CdTe photovoltaic waste. Resources Conserv. Recycling 69:35–49. doi:10.1016/j.resconrec.2012.09.003
- McDonald, N.C., and J.M. Pearce. 2010. Producer responsibility and recycling solar photovoltaic modules. Energy Policy 38:7041–7047. doi:10.1016./j.enpol.2010.07.023
- Neidlein, H.C. 2012. PV module recycling mandatory for all EU members by Q1 2014. http://www.pv-magazine.com/news/details/beitrag/pv-module-recycling-mandatory-for-all-eu-members-by-q1-2014_100008396/#axzz2B1nK2XIU ( accessed 1 November 2012)
- Paridaa, B., S. Iniyanb, and R. Goicc. 2011. A review of solar photovoltaic technologies. Renew Sustain. Energy Rev. 15:1625–1636. doi:10.1016/j.rser.2010.11.032
- PV Cycle. 2011. Annual Report 2011. http://www.pvcycle.org/wp-content/uploads/PV-CYCLE_Annual-Report_2011_FINAL.pdf ( accessed 1 November 2013).
- Razykov, T.M., C.S. Ferekides, D. Morel, E. Stefanakos, H.S. Ullhal, and H.M. Upadhyaya. 2011. Solar PV electricity: Current status and future prospects. Solar Energy 85:1580–1608. doi:10.1016/j.solener.2010.12.002
- Shiue, Y.C.,and C.Y. Lin. 2012. Applying analytical network process to evaluate the optimum recycling technology in upstream of solar energy industry. Energy Build. 54:266–277. doi:10.1016/j.enbuild.2012.07.032
- Solangi, K.H., M.R. Islam, R. Saidur, N.A. Rahim, and H. Fayaz. 2011. A review on global solar energy policy. Renew. Sustain. Energy Rev. 15:2149–2163. doi:10.1016/j.rser.2011.01.007
- Tomono, K., H. Furuya, S. Miyamoto, Y. Okamura, M. Sumimoto, Y. Sakata, R. Komatsu, and M. Nakayama. 2012. Investigations on hydrobromination of silicon in the presence of silicon carbide abrasives as a purification route of kerf loss waste. Separation Purification Technol. 103:109–113. doi:10.1016/j.seppur.2012.10.031
- Tour, A., A. Glachant, and Y. Meniere. 2011. Innovation and international technology transfer: The case of the Chinese photovoltaic industry. Energy Policy 39: 761–770. doi:10.1016/j.enpol.2010.10.050
- Tsai, T.H. 2011a. Silicon sawing waste treatment by electrophoresis and gravitational settling. J. Hazard. Mater. 189:526–530. doi:10.1016/j.jhazmat.2011.02.070
- Tsai, T.H. 2011b. Modified sedimentation system for improving separation of silicon and silicon carbide in recycling of sawing waste. Separation Purification Technol. 78:16–20. doi:10.1016/j.seppur.2011.01.011
- U.S. Department of Energy. 2010. $1/W photovoltaic systems, White paper to explore—A grand challenge for electricity from solar. http://www1.eere.energy.gov/solar/sunshot/pdfs/dpw_white_paper.pdf ( accessed 1 November 2013).
- U.S. Geological Survey. 2010. Mineral yearbook 2010—Silicon. http://minerals.usgs.gov/minerals/pubs/commodity/silicon/myb1-2010-simet.pdf ( accessed 8 November 2013).
- U.S. Geological Survey. 2012. Mineral industry survey. http://minerals.usgs.gov/minerals/pubs/commodity/silicon/mis-201205-simet.pdf, http://minerals.usgs.gov/minerals/pubs/commodity/copper/mis-201207-coppe.pdf ( accessed 8 November 2013).
- Wang, Q., and H.N. Qiu. 2009. Situation and outlook of solar energy utilization in Tibet, China. Renew. Sustain. Energy Rev. 13:2181–2186. doi:10.1016/j.rser.2009.03.011
- Wang, H.Y., Y. Tan, J.Y. Li, Y.Q. Li, and W. Dong. 2012. Removal of silicon carbide from kerf loss slurry by Al-Si alloying process. Separation Purification Technol. 89:91–93. doi:10.1016/j.seppur.2012.01.021
- Wicht, H. 2012. Surplus supply of polysilicon pressures pricing but not all polysilicon prices are equal. http://www.isuppli.com/Photovoltaics/News/pages/Surplus-Supply-of-Polysilicon-Pressures-Pricing-but-not-all-Polysilicon-Prices-are-Equal.aspx ( accessed 24 October 2013).
- Zuser, A., and H. Rechberger. 2011. Considerations of resource availability in technology development strategies: The case study of photovoltaics. Resources Conserv. Recycling 56:56–65. doi:10.1016/j.resconrec.2011.09.004