
Abstract
Oil and natural gas exploration and production (E&P) activities generate emissions from diesel engines, compressor stations, condensate tanks, leaks and venting of natural gas, construction of well pads, and well access roads that can negatively impact air quality on both local and regional scales. A mobile, autonomous air quality monitoring laboratory was constructed to collect measurements of ambient concentrations of pollutants associated with oil and natural gas E&P activities. This air-monitoring laboratory was deployed to the Allegheny National Forest (ANF) in northwestern Pennsylvania for a campaign that resulted in the collection of approximately 7 months of data split between three monitoring locations between July 2010 and June 2011. The three monitoring locations were the Kane Experimental Forest (KEF) area in Elk County, which is downwind of the Sackett oilfield; the Bradford Ranger Station (BRS) in McKean County, which is downwind of a large area of historic oil and gas productivity; and the U.S. Forest Service Hearts Content campground (HC) in Warren County, which is in an area relatively unimpacted by oil and gas development and which therefore yielded background pollutant concentrations in the ANF. Concentrations of criteria pollutants ozone and NO2 did not vary significantly from site to site; averages were below National Ambient Air Quality Standards. Concentrations of volatile organic compounds (VOCs) associated with oil and natural gas (ethane, propane, butane, pentane) were highly correlated. Applying the conditional probability function (CPF) to the ethane data yielded most probable directions of the sources that were coincident with known location of existing wells and activity. Differences between the two impacted and one background site were difficult to discern, suggesting the that the monitoring laboratory was a great enough distance downwind of active areas to allow for sufficient dispersion with background air such that the localized plumes were not detected.
Implications
Monitoring of pollutants associated with oil and natural gas exploration and production activity at three sites within the Allegheny National Forest (ANF) showed only slight site-to-site differences even with one site far removed from these activities. However, the impact was evident not in detection of localized plumes but in regional elevated ethane concentrations, as ethane can be considered a tracer species for oil and natural gas activity. The data presented serve as baseline conditions for evaluation of impacts from future development of Marcellus or Utica shale gas reserves.
Introduction
Oil and natural gas exploration and production (E&P) activities generate emissions that can negatively impact air quality on both local and regional scales. Challenges in estimating the impacts from these emissions include the sporadic nature of drilling activity, the relatively small magnitude and wide dispersion over a geographic area of the emission sources, and poor coverage of existing ambient air monitoring networks in the typically remote areas where extensive development occurs. Also, there is a lack of information on emissions from the recently popular technique of horizontal drilling and hydraulic fracturing as compared to conventional natural gas development. The pollutants associated with natural gas and oil E&P vary by source and activity. Diesel-powered drilling rigs, pumps, and compressor stations emit significant amounts of fine particulate matter (PM2.5) and oxides of nitrogen (NOx) into the atmosphere. Diesel engines, compressor stations, and condensate tanks also emit volatile organic compounds (VOCs), which together with NOx can contribute to ozone formation. The construction of well pads and increased truck traffic on unpaved access roads generate particulate matter. Although not uniform in magnitude from well to well, emissions of methane and VOCs from liquids unloading can be significant (Allen et al., Citation2013). Fugitive emissions, characterized as leaks and venting of natural gas, are sources of methane and VOCs. Drilling rigs and hydraulic fracturing operations are known to have NOx and PM emissions, but these operations are very limited per well drilled. Therefore, connecting monitoring data collected at distant locations to times of these operations is challenging.
To collect measurements of ambient pollutant concentrations from oil and natural gas exploration and production activities, a trailer-based autonomous air emissions monitoring laboratory that houses instrumentation to measure downwind concentrations of nonmethane volatile organic compounds (VOCs); ozone; oxides of nitrogen (NOx); sulfur dioxide; PM mass and speciated components such as organic and elemental carbon; and meteorological parameters such as temperature, relative humidity, wind speed, and wind direction was developed. This mobile air monitoring laboratory was deployed to the Allegheny National Forest (ANF) in northwestern Pennsylvania for a campaign that resulted in the collection of approximately 7 months of data split between three monitoring locations between July 2010 to June 2011. Historically a productive area for oil and gas wells, the 513,000-acre forest has seen the number of wells escalate from 8,000 in 2005 to currently over 12,000, and increasing development of the deeper Marcellus shale formation is expected. The federal government owns surface rights in the ANF, but 93% of the underlying mineral rights are privately owned and supersede the surface rights.
Experimental Methods
Mobile air monitoring laboratory
The mobile air monitoring laboratory was constructed in an 18-ft temperature-controlled trailer and was equipped with analytical instrumentation to measure ambient concentration of pollutants listed in . The laboratory was designed to be autonomous, with personnel conducting visits on a weekly basis to perform instrument maintenance, calibrations, and troubleshooting. A satellite link provided remote access communications with laboratory computers for instrument control and downloading of data. The station required an external source of electrical power at each monitoring location. The main sampling inlet on the roof of the laboratory provided a source of ambient air that was inducted by a blower and distributed to the instruments from a manifold. Two instruments, the Thermo Scientific tapered element oscillating microbalance (TEOM) and the Sunset Laboratory Field Organic and Elemental Carbon (OC/EC) Analyzer, required separate air inlets. The blower, operating at 30 scfm, kept the flow of ambient air constant at the inlet and provided adequate flow for instrument exhaust to the exterior of the trailer.
Table 1. Mobile air monitoring laboratory instrumentation
Monitoring in the ANF
Three sites within the ANF were selected as monitoring locations: the Kane Experimental Forest (KEF) area in Elk County, which is downwind of the Sackett oilfield; the Bradford Ranger Station (BRS) in McKean County, which is downwind of a large area of historic natural gas and oil production; and the U.S. Forest Service Hearts Content campground (HC) in Warren County, which is in an area relatively unimpacted by oil and gas development and which therefore yielded background pollutant concentrations in the ANF. The three monitoring locations and the locations of existing oil and natural gas wells are shown in .
Figure 1. Location of oil and gas wells and the three air monitoring sites within the ANF (shaded green).

Beginning in July 2010, the original plan involved monitoring 1–2 months at each location; however, the VOCs analyzer encountered numerous problems while at the KEF site, delaying the move to the second site until December 2010. The VOCs analyzer problems were resolved, resulting in 2 months of successful data collection. The mobile air monitoring laboratory was then returned to NETL’s Pittsburgh location for a 2-month period to wait for a break in the weather before it was moved to the HC site in March 2011 for 6 weeks of operation, followed by 7 weeks of operation at the BRS site beginning in May 2011 ().
Table 2. Monitoring locations in the ANF
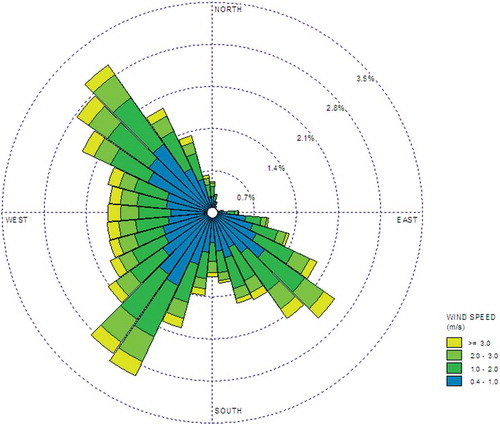
At the KEF site, wind direction was predominantly in the range of 225–300° (). The Sackett oilfield, one of the most active development areas within the ANF, is located at 220–235° from the monitoring site, and there is also a cluster of active wells to the west; therefore, it is likely for emissions to be transported to the monitoring site from these areas. At the HC and BRS sites, the wind direction was more variable ( and , respectively). As the HC site was meant to serve as a control, variable wind direction was desirable. The site will have been influenced by any potential sources surrounding the area. At the BRS site, existing oil and gas wells are located in all directions with exception of the 0–90° sector, with the highest concentration to the southwest. Therefore, the wind direction measurements at the site are favorable for intercepting plumes from oil and gas activity.
Figure 2. Measured wind direction from 7/21/2010 to 11/5/2010 at the Kane Experimental Forest monitoring site in the form of a wind rose. Data from 11/6/2010 to12/11/2010 are not included due to meteorological station malfunction.
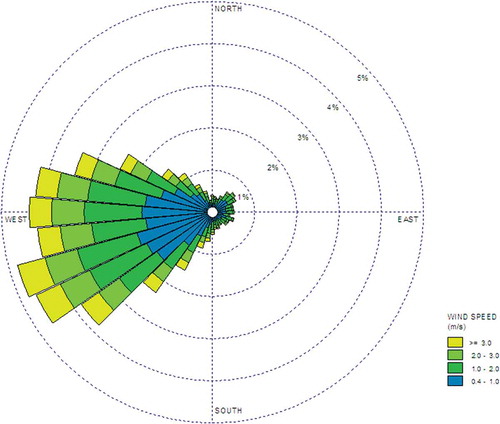
Figure 3. Measured wind direction from 4/1/2011 to 5/12/2011 at the Hearts Content monitoring site in the form of a wind rose.
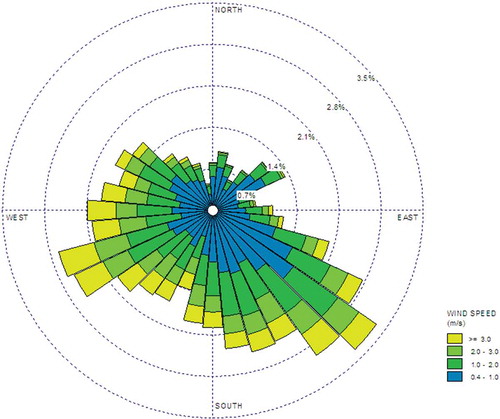
Figure 4. Measured wind direction from 5/12/2011 to 6/28/2011 at the Bradford Ranger Station monitoring site in the form of a wind rose.
Results and Discussion
Preliminary results have been discussed in Pekney et al. (Citation2012a) and Pekney et al. (Citation2012b); here, results for the complete data set are presented. Also, the conditional probability function (CPF) is used for a comparative analysis of pollutant concentrations with wind direction to determine probable source locations. CPF has been applied in many source apportionment studies (Pekney et al., Citation2006; Xie et al., Citation2007; Zhao et al., Citation2004; Zhou et al., Citation2004). CPF determines the probability that, given ambient concentrations of a pollutant and the associated wind direction during each measurement, a source of that pollutant is located within a particular wind direction sector, ΔΘ, or
Volatile organic compounds
Condensate tanks, compressor stations, impoundments, vehicles, and operations such as venting and flaring can all be sources of VOCs. VOCs measured at the three ANF sites include those on the U.S. Environmental Protection Agency (EPA) Photochemical Assessment Monitoring Stations (PAMS) target ozone precursors hydrocarbons list (U.S. EPA, Citation1994). Several VOCs, such as benzene, ethyl benzene, hexane, styrene, and xylene, are classified as hazardous air pollutants (HAPS) by the U.S. EPA, causing adverse health effects from chronic exposure.
Results from other air monitoring studies regarding the magnitude of VOCs emissions from natural gas operations have led to varying conclusions. The Texas Commission on Environmental Quality (TCEQ) conducted air monitoring projects connected to the development of the Barnett Shale formation, with the reported high concentrations of benzene causing great concern (TCEQ, Citation2010). Conversely, both the Northeastern and the Southwestern Pennsylvania Marcellus Shale Short-Term Ambient Air Sampling studies conducted by the Pennsylvania Department of Environmental Protection (PA DEP) concluded that concentrations of benzene and other VOCs emitted from the sources measured did not indicate a potential for major air-related health issues (PA DEP, 2011a, Citation2011b). Ambient air monitoring of VOCs conducted at eight sites as part of the City of Fort Worth Natural Gas Air Quality Study yielded no pollutant concentrations that exceeded any published short-term health benchmark published by the Texas Commission on Environmental Quality (TCEQ), U.S. EPA, or the Agency for Toxic Substances and Disease Registry (ATSDR) (ERG and Sage Environmental Consulting, Citation2011).
Average concentrations for several of the VOCs measured at the three sites in the ANF, with maximum measured concentration and percent of samples detected at concentrations above the detection limit, are presented in . No results are shown for VOCs that were measured but detected in less than 10% of the samples. Isoprene results are not shown because isoprene is a naturally occurring VOC produced and emitted from many species of trees and is not associated with oil and gas production. Average concentrations for each of the compounds in were compared to determine statistically significant differences between the three sites. A t-test of the means revealed that all are statistically significantly different at the 99% confidence level with the exception of the following pairs: m,p-xylene at KEF and BRS (P = 0.02), ethylene at BRS and HC (P = 0.03), and benzene at BRS and HC (P = 0.02). Although differences were small, higher averages were observed at the two impacted sites (BRS and KEF) than at the nonimpacted site (HC) for VOCs that are constituents of natural gas: ethane, propane, isobutane, n-butane, isopentane, n-pentane, and hexane, as well as toluene and styrene.
Table 3. Concentrations of VOCs measured during the ANF monitoring campaign
At all three sites, concentrations of ethane, propane, isobutene, and n-butane were strongly correlated (r > 0.8, significant at >99% confidence level). At the BRS and HC sites, n-pentane and isopentane were also strongly correlated with this group of compounds (r > 0.7, significant at >99% confidence level). Hexane was strongly correlated with this set of compounds at the BRS site (r > 0.7, significant at >99% confidence level). These compounds are all constituents of natural gas.
To calculate the most probable source direction of the VOCs associated with oil and natural gas development, CPF ( eq 1) was applied to the ethane and wind direction data. Because other VOCs were highly correlated with ethane, results would be similar. Although a large number of data points were not used in the analysis because average wind speed was less than 1 m/sec, the total numbers of data points in the CPF analyses were 227, 222, and 539 for the KEF, BRS, and HC sites, respectively. The results in are compared to the known locations of wells and drilling activity (). In addition to the oil and natural gas extraction activity in the ANF, another significant source of ethane could be an oil refinery in Warren, PA (northwest edge of the ANF; see ). At the KEF site, the wind directions with the highest probability of measured ethane concentrations greater than the 75th percentile (14.6 ppb) are 210–300° (24–53% probability). These findings agree with the location of the Sackett oilfield (220–235°) and a cluster of active wells to the west. The probability in the direction of the oil refinery (315°) is 0%, and the distance to the refinery is approximately 40 km. At the BRS site, the most likely (84% probability) source directions were 240–270° for ethane concentrations greater than the 75th percentile (19.7 ppb). The immediate area in this direction is densely populated with wells, and the oil refinery is 26 km west of the site. At the HC site, probability from sector to sector is more variable, but sectors with highest probability are 30–90° (69–83%) and 150–180° (68%). The oil refinery is 19 km from the site at approximately 40°. Although the distance to the developed areas is greater for the HC site compared with the KEF and BRS sites, probable directions are consistent with the location of existing wells.
Figure 5. Most probable source direction using CPF for ethane concentrations measured at the three monitoring locations: KEF, BRS, and HC.
Criteria pollutants: Ozone, NOx, PM10, PM2.5
With the exception of the shape of the NOx peaks, NOx and ozone measured at the three monitoring locations within the ANF varied little between sites, as shown in and . Ozone is not emitted directly from oil- and gas-related sources. NOx and VOCs emitted from these sources react photochemically with molecular oxygen in air to form ozone. Extensive natural gas activity was shown to cause wintertime ozone concentrations that exceeded National Ambient Air Quality Standards in Wyoming’s rural Upper Green River Basin and Utah’s Uintah Basin (Schnell et al., Citation2009; Utah Department of Environmental Quality [DEQ], Citation2011, Citation2013). However, the Uintah Basin may be a unique case in which a complex and mountainous terrain, a prolonged wintertime inversion layer in the atmosphere, and the presence of snow on the ground led to unique conditions for elevated ozone formation in 2011 and 2013. Studies during winter 2012 in the Uintah Basin did not see the same ozone impacts (Utah DEQ, Citation2012). Ozone has a daily maximum 8-hr standard of 75 ppb (U.S. EPA, Citation2012). Average ozone concentrations at both the HC and BRS sites were 42 ppb, and monthly average concentrations at the KEF site ranged from 35 to 46 ppb. Hourly ozone maximums at all three sites were not higher than 60 ppb. shows the hourly averaged ozone concentrations presented by time of day for the three monitoring sites. At each site, the typical diurnal pattern of higher concentrations during daylight hours and lower concentrations at nighttime was observed. The difference between minimum and maximum concentration was only 9 ppb at the HC site, as compared to 17 ppb and 22 ppb at the KEF and BRS sites, respectively. Because monitoring at the three sites occurred during different seasons, the minor differences between sites may be due to variations in solar intensity rather than to local oil and natural gas activity.
Figure 6. Hourly averaged ozone concentrations displayed by time of day at the KEF site, the BRS site, and the HC site. Error bars represent one standard deviation.
Figure 7. NOx, NO, and NO2 concentrations for a 1-week period at the KEF site (a), the BRS site (b), and the HC site (c).
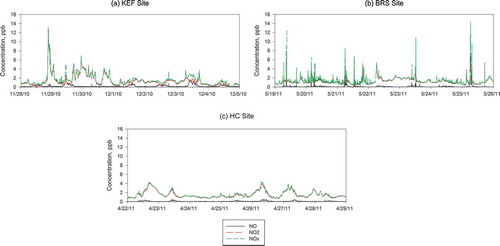
NOx represents the sum of nitric oxide (NO) and nitrogen dioxide (NO2). NO can be formed by combustion of fuels, such as gasoline and diesel for trucks, drills, pumps, and compressors used for natural gas and oil drilling and production. The NO is then oxidized in the atmosphere to form NO2. NO2, the marker for NOx, has an annual average standard of 53 ppb and a 1-hr primary standard of 100 ppb (U.S. EPA, Citation2012). NOx concentrations at each of the three monitoring sites were generally very low with short-term peaks. The NO2/NOx ratio was typically high, as most of the NO had been oxidized. This is indicative of aged rather than fresh emissions. The range of monthly average NOx concentrations at the KEF site was 0.9–1.5 ppb, and averages at the HC and BRS sites were 1.7 ppb and 1.5 ppb, respectively. A typical week of data selected from each of the three monitoring locations is shown in . Although the average concentrations are close in magnitude, the peaks of NOx at the three sites are different in shape. At the sites impacted by natural gas and oil operations (KEF and BRS), the peaks are shorter in duration and greater in concentration, while the peaks at the HC site tend to be broader and lower in concentration, suggesting that the impacted sites are closer to and seeing influence from individual sources of NOx, while concentrations at the HC site may reflect more regional trends. However, as NOx concentrations vary seasonally, the differences at the three sites can also possibly be explained by the time of year that the samples were collected.
PM can be emitted directly from oil and natural gas development sources like suspension of road dust from heavy truck traffic, or it can originate from chemical reactions of gases emitted to the atmosphere from vehicles, compressor stations, venting, flaring, and so on. PM10 and PM2.5 concentrations are only available for the KEF site, as the TEOM unit was malfunctioning at the HC and BRS sites. PM10 has a 24-hr standard of 150 μg/m3 and PM2.5 has a primary annual average standard of 12 μg/m3 as well as a 24-hr standard of 35 μg/m3 (U.S. EPA, Citation2012). The overall average concentrations of PM10 and PM2.5 measured at the KEF site were 9 μg/m3 (± 9.9 μg/m3) and 13 μg/m3 (± 7.9 μg/m3), respectively (Supplemental Information ). Maximum hourly average concentrations were 58 μg/m3 for PM10 and 48 μg/m3 for PM2.5.
Organic and elemental carbon
In addition to speciated VOCs concentration, bulk organic carbon (OC) concentration in PM2.5 was measured; the same instrument also measured elemental carbon (EC) concentrations. EC is formed by combustion of organic material, such as fossil fuels, and is solely a primary pollutant. OC can be a primary or secondary pollutant. Primary sources can be anthropogenic or biogenic, and secondary sources are atmospheric oxidation processes. Both OC and EC can be emitted from the same source.
OC and EC concentrations measured at the three monitoring sites are shown in , and shows the concentration minimum, maximum, average, and standard deviation. At the KEF site, where PM2.5 mass concentration data were available, the OC accounted for 20% of the PM2.5 mass and EC accounted for 3% of the PM2.5 mass. Higher correlations between OC and EC concentrations imply emission from common sources. The correlation coefficients for OC and EC were 0.70, 0.66, and 0.53 at the KEF, HC, and BRS sites, respectively. These values are all significant at the 99% confidence level. The ratio of OC to EC can give an indication of emission sources, because EC can be considered a tracer for primary emissions of carbonaceous species (Turpin and Huntzicker, Citation1995, and references therein). Particulate OC to EC ratios greater than 2.0 are indicative of contribution from secondary organic aerosol (SOA) formation (Turpin et al., Citation1990; Turpin et al., Citation1991). The average OC to EC ratios were 6.6, 6.4, and 8.7 at the KEF, HC, and BRS sites, respectively. Therefore at each site there was likely a significant contribution from SOA formation. In previous studies, OC to EC ratios characteristic of various sources have been reported: 1.0–4.2 for diesel- and gasoline-powered vehicle exhaust (Shauer et al., Citation1999, Citation2002), 2.5-10.46 for coal burning (Chen et al., Citation2006), and 16.8–40 for wood burning (Shauer et al., Citation2001). There is little discernible difference in OC and EC behavior at the three monitoring sites, and it is likely that all were influenced by a mix of sources: gasoline and diesel exhaust, wood burning, coal burning, and secondary aerosol formation.
Figure 8. OC and EC concentrations for the KEF site (a), the BRS site (b), and the HC site (c).
Table 4. Minimum, maximum, average, and standard deviation of OC and EC concentrations in μg C/m3, measured at the KEF, BRS, and HC monitoring sites
Conclusion
The ANF has had a long history of oil and natural gas production. Monitoring pollutants associated with oil and natural gas development at three sites in the ANF has provided a means by which to compare two areas that would presumably be impacted by development, and one area that is relatively removed from existing wells and new development. However, concentrations of most measured pollutants did not vary significantly between the three sites. It should not be assumed, however, that because there was no significant difference that the oil and gas activity in the ANF does not have an impact on air quality. It may be that the monitoring laboratory was far enough downwind to allow for sufficient dispersion with background air such that the localized plumes were not detected. This is especially true for the KEF site, which was 8–9 km from the nearest areas of extensive development. At this distance the impact was not distinguishable from background. Monitoring during different seasons at each site introduced uncertainty as well, since air temperature and meteorological patterns could influence pollutant behavior. Concentrations of VOCs, including benzene, were well below published exposure limits.
Ethane can be considered a tracer species for oil and natural gas activity. Ethane is the second most abundant constituent of natural gas (approximately 5% by volume) after methane (approximately 83%); for oil the methane content is approximately 47% by volume, and ethane content is approximately 10% by volume (U.S. EPA, Citation2010). Sources of atmospheric ethane are almost exclusively from fossil fuel extraction, processing, and use. Background concentration of tropospheric ethane in the Northern Hemisphere is around 1 ppb (Rinsland et al., Citation1987; Rudolph et al., Citation1996). With average concentrations measured at the KEF, BRS, and HC sites of 10.3, 15.9, and 9.2 ppb, respectively, the elevated values are evidence of impact from nearby ethane sources and an indication that production emissions may be significant.
The collected data presented here may serve as baseline, or predevelopment, conditions for consideration of impacts from future development of Marcellus or Utica shale gas reserves. Both formations underlie the ANF, although at the time of this study, there were only four Marcellus wells in the ANF and no Utica wells (). With the increasing prevalence of horizontal drilling and hydraulic fracturing to access previously inaccessible shale gas formations, there is value in having measurements of predevelopment concentrations of pollutants specific to natural gas exploration and production operations that are not covered by existing state and federal air monitoring networks.
Supplemental Materials
Supplemental data for this paper can be accessed on the http://www.tandfonline.com/uawmpublisher’s website.
Supplemental_Material.zip
Download Zip (451.2 KB)Acknowledgment
The authors acknowledge the assistance of Ralph Perron, Jim McCloskey, Ernie Wiltsie, and Susan Stout of the U.S. Forest Service Allegheny National Forest and the Northern Research Station in establishing the monitoring locations and providing guidance, and James Sams of the National Energy Technology Laboratory for preparing a figure used in the paper.
Additional information
Notes on contributors
Natalie J. Pekney
Natalie J. Pekney and Garret Veloski are researchers on the Engineered Natural Systems Division Monitoring Team at the U.S. Department of Energy’s National Energy Technology Laboratory (NETL), Pittsburgh, PA.
Matthew Reeder
Matthew Reeder is an Oak Ridge Institute for Science and Eduation post-graduate researcher at NETL, Pittsburgh, PA.
Joseph Tamilia
Joseph Tamilia is a retired engineering technician, formerly with URS Corporation, Pittsburgh, Pennsylvania.
Erik Rupp
Erik Rupp is a researcher in the Department of Energy Resources Engineering, Stanford University, Stanford, CA.
Alan Wetzel
Alan Wetzel is a U.S. Forest Service employee at the Allegheny National Forest Bradford District, Bradford, PA.
Related Research Data
References
- Allen, D., V. Torres, J. Thomas, D. Sullivan, M. Harrison, A. Hendler, S. Herndon, C. Kolb, M. Fraser, A. Hill, B. Lamb, J. Miskimins, R. Sawyer, and J. Seinfeld. 2013. Measurements of methane emissions at natural gas production sites in the United States. Proc. Natl. Acad. Sci. USA 110: 17768–73. doi:10.1073/pnas.1304880110
- Chen, Y., G. Zhi, Y. Feng, J. Fu, J. Feng, G. Sheng, and B.R.T. Simoneit. 2006. Measurements of emission factors for primary carbonaceous particles from residential raw-coal combustion in China. Geophys. Res. Lett. 33: articleL20815. doi:10.1029/2006GL026966
- Eastern Research Group, Inc., and Sage Environmental Consulting, LP, 2011. City of Fort Worth Natural Gas Air Quality Study Final Report. http://fortworthtexas.gov/uploadedFiles/Gas_Wells/AirQualityStudy_final.pdf ( accessed December 2012).
- Pekney, N.J, R. Hammack, G. Veloski, J. Tamilia, and M. McCawley. 2012a. Impacts to air quality from oil and natural gas development in Pennsylvania’s Allegheny National Forest. Paper presented at the Air & Waste Management Association Air Quality Measurement Methods and Technology Conference, Durham, NC, April 24–26.
- Pekney, N.J., R. Hammack, G. Veloski, J. Tamilia, and M. McCawley. 2012b. Oil and natural gas development impacts to air quality: NETL’s air sampling initiatives. Paper presented at the Air & Waste Management Association Annual Conference and Exhibition, San Antonio, TX, June 19–22.
- Pekney, N.J, C. Davidson, L. Zhou, and P. Hopke. 2006. Application of PSCF and CPF to PMF-modeled sources of PM2.5 in Pittsburgh. Aerosol Sci. Technol. 40:952–61. doi:10.1080/02786820500543324
- Pennsylvania Department of Environmental Protection, 2011a. Northeastern Pennsylvania Marcellus Shale Short-Term Ambient Air Sampling Report. http://www.dep.state.pa.us/dep/deputate/airwaste/aq/aqm/docs/Marcellus_NE_01-12-11.pdf ( accessed November 2013).
- Pennsylvania Department of Environmental Protection, 2011b. Southwestern Pennsylvania Marcellus Shale Short-Term Ambient Air Sampling Report. http://www.dep.state.pa.us/dep/deputate/airwaste/aq/default.htm ( accessed September 2011).
- Rinsland, C.P., R. Zander, C.B. Farmer, R.H. Norton, and J.M. Russell. 1987. Concentrations of ethane (C2H6) in the lower stratosphere and upper troposphere and acetylene (C2H2) in the upper troposphere deduced from atmospheric trace molecule spectroscopy/Spacelab 3 spectra. J. Geophys. Res. 92:11951–64. doi:10.1029/JD092iD10p11951
- Rudolph, J., R. Koppmann, and C. Plass Dulmer. 1996. The budgets of ethane and tetrachroloethane: Is there evidence for an impact of reactions with chlorine atoms in the troposphere? Atmos. Environ. 30:1887–94. doi:10.1016/1352-2310(95)00385-1
- Schauer, J.J., M.J. Kleeman, G.R. Cass, and B.R.T. Simoneit. 1999. Measurement of emissions from air pollution sources. 2. C1 through C30 organic compounds from medium duty diesel trucks. Environ. Sci. Technol. 33:1578–87. doi:10.1021/es980081n
- Schauer, J.J., M.J. Kleeman, G.R. Cass, and B.R.T. Simoneit. 2001. Measurement of emissions from air pollution sources. 3. C1–C29 organic compounds from fireplace combustion of wood. Environ. Sci. Technol. 35:1716–28. doi:10.1021/es001331e
- Schauer, J.J., M.J. Kleeman, G.R. Cass, and B.R.T. Simoneit. 2002. Measurement of emissions from air pollution sources. 5. C1–C32 organic compounds from gasoline-powered motor vehicles. Environ. Sci. Technol. 36:1169–80. doi:10.1021/es0108077
- Schnell, R.C., S.J. Oltmans, R.R. Neely, M.S. Endres, J.V. Molenar, and A.B. White. 2009. Rapid photochemical production of ozone at high concentrations in a rural site during winter. Nat. Geosci. 2:120–22. doi:10.1038/ngeo415
- Texas Commission on Environmental Quality. 2010. Barnett Shale Formation Area Monitoring Projects. Document Number BS0912-FR. http://www.tceq.state.tx.us/assets/public/implementation/barnett_shale/2010.01.27-BarnettShaleMonitoringReport.pdf ( accessed September 2011).
- Turpin, B.J., R.A. Cary, and J.J. Huntzicker. 1990. An in-situ, time resolved analysis for aerosol organic and elemental carbon. Aerosol Sci. Technol. 12:161–71. doi:10.1080/02786829008959336
- Turpin, B.J., J.J. Huntzicker, S.M. Larson, and G.R. Cass. 1991. Los Angeles summer midday particulate carbon: primary and secondary aerosol. Environ. Sci. Technol. 25:1788–93. doi:10.1021/es00022a017
- Turpin, B.J., and J.J. Huntzicker. 1995. Identification of secondary organic aerosol episodes and quantisation of primary and secondary organic aerosol concentrations during SCAQS. Atmos. Environ. 29:3527–44. doi:10.1016/1352-2310(94)00276-Q
- U.S. Environmental Protection Agency. 1994. Photochemical Assessment Monitoring Stations Implementation Manual. Triangle Park, NC: Office of Air Quality Planning and Standards Research, EPA-454/B-93-051.
- U.S. Environmental Protection Agency. 2010. Natural gas for use in the oil and natural gas sector rulemaking. http://www.regulations.gov/#!documentDetail;D=EPA-HQ-OAR-2010-0505-0084U.S. ( accessed April 2013).
- U.S. Environmental Protection Agency. 2012. National Ambient Air Quality Standards. http://www.epa.gov/air/criteria.html ( accessed September 2012).
- Utah Department of Environmental Quality. 2011. Air quality and energy development in the Uintah Basin. http://www.deq.utah.gov/locations/uintahbasin/index.htm ( accessed December 2012).
- Utah Department of Environmental Quality. 2012. 2012 Uintah Basin winter ozone and air quality study. http://rd.usu.edu/files/uploads/ubos_2011-12_final_report.pdf ( accessed December 2013).
- Utah Department of Environmental Quality. 2013. Summary of findings from the Uintah Basin ozone study: Preliminary update from 2013 field study. http://www.deq.utah.gov/locations/uintahbasin/docs/2013/09Sep/SummaryFindings_UBSO2013_23Sep2013.pdf ( accessed January 2014).
- Xie, Y., and C. Berkowitz. 2007. The use of conditional probability functions and potential source contribution functions to identify source regions and advection pathways of hydrocarbon emissions in Houston, Texas. Atmos. Environ. 41:5831–47. doi:10.1016/j.atmosenv.2007.03.049
- Zhao, W., P.K. Hopke, and T. Karl. 2004. Source identification of volatile organic compounds in Houston, Texas. Environ. Sci. Technol. 38:1338–47. doi:10.1021/es034999c
- Zhou, L.M., E. Kim, P.K. Hopke, C.O. Stainer, and S. Pandis. 2004. Advanced factor analysis on Pittsburgh particle size distribution data. Aerosol Sci. Technol. 38(S1):118–32. doi:10.1080/02786820390229589