
Abstract
The Proposed New Environmental Quality (Clean Air) Regulation 201X (Draft), which replaces the Malaysia Environmental Quality (Clean Air) 1978, specifies limits to additional pollutants from power generation using fossil fuel. The new pollutants include Hg, HCl, and HF with limits of 0.03, 100, and 15 mg/N-m3 at 6% O2, respectively. These pollutants are normally present in very small concentrations (known as trace elements [TEs]), and hence are often neglected in environmental air quality monitoring in Malaysia. Following the enactment of the new regulation, it is now imperative to understand the TEs behavior and to assess the capability of the existing abatement technologies to comply with the new emission limits. This paper presents the comparison of TEs behavior of the most volatile (Hg, Cl, F) and less volatile (As, Be, Cd, Cr, Ni, Se, Pb) elements in subbituminous and bituminous coal and coal combustion products (CCP) (i.e., fly ash and bottom ash) from separate firing of subbituminous and bituminous coal in a coal-fired power plant in Malaysia. The effect of air pollution control devices configuration in removal of TEs was also investigated to evaluate the effectiveness of abatement technologies used in the plant. This study showed that subbituminous and bituminous coals and their CCPs have different TEs behavior. It is speculated that ash content could be a factor for such diverse behavior. In addition, the type of coal and the concentrations of TEs in feed coal were to some extent influenced by the emission of TEs in flue gas. The electrostatic precipitator (ESP) and seawater flue gas desulfurization (FGD) used in the studied coal-fired power plant were found effective in removing TEs in particulate and vapor form, respectively, as well as complying with the new specified emission limits.
Implications:
Coals used by power plants in Peninsular Malaysia come from the same supplier (Tenaga Nasional Berhad Fuel Services), which is a subsidiary of the Malaysia electricity provider (Tenaga Nasional Berhad). Therefore, this study on trace elements behavior in a coal-fired power plant in Malaysia could represent emission from other plants in Peninsular Malaysia. By adhering to the current coal specifications and installation of electrostatic precipitator (ESP) and flue gas desulfurization, the plants could comply with the limits specified in the Malaysian Department of Environment (DOE) Scheduled Waste Guideline for bottom ash and fly ash and the Proposed New Environmental Quality (Clean Air) Regulation 201X (Draft).
Introduction
Despite emitting common pollutants such as particulate matter (PM), sulfur oxide (SOx), and nitrogen oxide (NOx), the coal-fired power plant is also a source of trace elements (TEs) emissions. Trace elements (TEs) are defined as elements that exist at concentrations of <100 ppm (Xu et al., Citation2004). It is observed that coal contains most of the identified TEs (i.e., in the Periodic Table) (Swaine, Citation1990). Emissions of TEs from coal should be a great concern as the emissions were higher in coal-based power plants than for fuel-oil-fired power plants (Reddy et al., Citation2005). In addition, a comparison between coal, oil and natural gas combustion by the U.S. Environmental Protection Agency (EPA) (2011) showed that coal was found to emit highest amount of 6 priority hazardous air pollutants (HAPs) which are also TEs compounds (i.e., arsenic [As], chromium [Cr], mercury [Hg], nickel [Ni], hydrogen chloride [HCl], hydrogen fluoride [HF]).
Trace elements (TEs) are emitted into the air in solid (fly ash) and gaseous states (Meij and te Winkel, Citation2007). Trace elements can be essential or hazardous, depending on the concentration (Swaine, Citation1990). Finkelman (Citation2000) pointed out that modern coal-burning utilities in the United States did not cause health problems, as the coals burned contain low to modest concentrations of potentially toxic trace elements. The utilities were also equipped with sophisticated air pollution control devices (APCDs) such as electrostatic precipitator (ESP) and flue gas desulfurization (FGD) to reduce the emission of hazardous elements. Even though APCDs have successfully reduced the emission of TEs into air, there is concern about the increase of the TEs concentration in solid and liquid waste from coal-fired power plants. Instead of being emitted into air, the TEs shift into fly ash from ESP and effluent from FGD. A report by Barbara et al. (Citation2010) highlighted that TEs in coal ash, such as As, boron (B), cadmium (Cd), chromium (Cr), lead (Pb), mercury (Hg), molybdenum (Mo), selenium (Se), and thallium (Tl), can cause cancer and neurological damage in humans and also are harmful to animals. The exposure pathways could be through air (fine particles or dust), water (leaching from ash pond), and consumption of contaminated foods. Wang et al. (Citation2010) reviewed a selenosis (Se) poisoning case in China due to usage of high-Se coal. Agricultural soil close to coal mines and power plants was contaminated with Se, which posed a health risk from consumption of local staple food (i.e., corn and vegetables). In addition, Se concentration in the air was also high, causing the residents to eat and inhale Se every day. Realizing that coal-fired power plants emit high amounts of Hg and also other TEs that are known to be highly harmful to human health, the U.S. EPA has recently regulated Mercury and Air Toxics Standards (MATS) for electric generating units (EGUs) in the United States.
A review by Vejahati et al. (Citation2010) showed that several factors affect the emission and distribution of TEs in waste streams of coal-fired power plant (i.e., bottom ash, fly ash, and flue gas). Among the factors are modes of the TEs occurrence in coal (i.e., their chemical affinities either toward organic or inorganic mineral compounds), mineral content and distribution in coal, and physical factors such as combustion conditions and pollution control devices. It is important to stress that TE content varies with coal type (Xu et al., Citation2004). TEs may exist in a coal in more than one form and can be associated partly with organic and partly with mineral contents of coal. Therefore, total TE is a sum of TE in organic and inorganic mineral contents in coal (Swaine, Citation1990). It should be noted that emission of inorganic TEs from coal-fired power plants has drawn much interest among the industries, regulators, and researchers (Miller and Miller, Citation2010; Córdoba, Ochoa-Gonzalez, et al., Citation2012). Thus, inorganic TEs are the focus in this study.
During coal combustion, TEs are redistributed into gas and solid phases. The temperature determines the degree of volatilization of specific trace elements contained in coal. Classification of TEs by Meij (Citation1995) according to their volatility is commonly adopted in studies on TEs partitioning during coal combustion. The author introduced a relative enrichment (RE) factor to describe the behavior of TEs that end up in ash. RE was defined as follows:
The classification of TEs according to RE factor is as follows (Meij, Citation1995):
Class I
RE factor is about 1, nonvolatile elements, equally distributed in bottom ash and fly ash.
Al, Ca, Ce, Cs, Eu, Fe, Hf, K, La, Mg, Sc, Sm, Si, Sr, Th, Ti.
Class II
RE < 0.7, volatile in boiler but condensation in ESP on the ash particles.
Class II is divided into three groups with increasing volatility from IIc to Iia:
IIc—Ba, Cr, Mn, Na, Rb, Sr.
IIb—Be, Co, Cu, Ni, P, U, V, W.
IIa—As, Cd, Ge, Mo, Pb, Sb, Tl, Zn.
Class III
RE ≪ 1, very volatile, some to hardly any condensation on ash particles in ESP.
B, Br, C, Cl, F, Hg, I, N, S, Se.
The temperature profile across furnace, boiler, economizer, and pollution control devices exhibits temperature drop from about 1300°C to about 150°C, resulting in the process of volatilization of TEs in coal, followed by condensation and adsorption on previously formed particles. TEs in Class I have the highest boiling point and are the least volatile, leading to the elements being concentrated in the coarse residues (i.e., bottom ash) or are equally divided between coarse residues and finer particles (i.e., fly ash). For TEs of which the dewpoint is passed (normally at a particulate control device), condensation will occur on the surface of fly ash particles (Class II). TEs with low dewpoint (i.e., Hg) condense partly in this region and some may be emitted in the vapor phase, whereas the most volatile elements such as Cl and F exist entirely in the vapor phase (Class III). Therefore, modern coal-fired power plants are equipped with particulate control devices such as an electrostatic precipitator (ESP) and fabric filter (FF) to control TEs in the particle phase and flue gas desulfurization (FGD) to control TEs in the vapor phase.
Of all TEs, there have been various studies conducted on Hg, such as on the emission (Yokoyama et al., Citation2000; Meij and te Winkel, Citation2006; Pudasainee et al., Citation2009), element speciation (Lee et al., Citation2006), and removal by APCDs (Zhong et al., Citation2010; Brown et al., Citation2000; Wang et al., Citation2011; Wang et al., Citation2008). Despite its very low concentration in coal, such specific studies have been done on Hg because coal combustion is found to be the main source of anthropogenic Hg emission and its capture by pollution control devices is problematic (Xu et al., Citation2004). This is because Hg exists in three forms, elemental (Hg°), particulate (HgP), and divalent (Hg2+). Therefore, a combination of pollution control devices is required to achieve high efficiency of Hg removal. According to Srivasta et al. (Citation2001), the combination of powdered activated carbon (PAC) injection and FF removes Hg better than the corresponding PAC injection and ESP combination because FF provides added residence time and a contact bed for increased absorption of mercury. Similar findings were reported by Wang et al. (Citation2008), Tian (2011), and Swanson et al. (Citation2013). Other control technologies include the combination of selective catalytic reactor (SCR), cold side (CS)-ESP, and wet FGD which shows better performance than the combination of ESP and FGD (Pudasainee et al., Citation2009).
In recent years, the emissions of other TEs emissions from coal-fired power plant have also gained interest, such as of F, Cl, As, Se, Ni, and Sb (Chen et al., Citation2013; Córdoba, Font, et al., Citation2012; Córdoba, Ochoa-Gonzalez, et al., Citation2012; Wang et al., Citation2010). Flue gas desulfurization (FGD) using wet limestone was reported to be capable of achieving removal efficiency of As, Cl, F, S, and Se in the range of 96 to 100% and 60% for Hg (Álvarez-Ayuso et al., Citation2006).
Coal-fired power plants in Malaysia
In Malaysia, a fuel diversification strategy has been practiced since the year 1980 to achieve balanced utilization of natural gas, coal, oil, hydro, and renewable energy. The development of coal-fired power plants in Malaysia started in 1987 and currently there are a total of four coal-fired power plants in Peninsular Malaysia and a few in East Malaysia. Tenaga Nasional Berhad (TNB), the largest electric utility provider in Malaysia and also a coal supplier for the plants in Peninsular Malaysia, recorded increasing coal consumption in Peninsular Malaysia reaching up to 16 million tons/year in 2010 and is expected to see a further increase due to the expansion of the existing coal-fired power plants.
Current electricity generation mix in Malaysia is at 58% gas, 33% coal, and 9% hydro. Based on the approved generation development plan as reported by the Energy Commission (Citation2013), the power generation sector will have more coal plants as the gas price increases, where by the year 2019, the generation mix will be at 64% coal, 32% gas, and 4% hydro. Such planning is made in order to control the cost of electricity, as coal prices are less affected by market variations. Two existing coal-fired power plants at Manjung and Tanjung Bin are currently under expansion to add another 2000 MW to national capacity by 2016, which will consequently result in increased coal consumption at around 25 million tonnes/year.
The emissions from coal-fired power plants in Malaysia have to comply with the Environmental Quality (Clean Air) 1978 for parameters such as dust (PM10), SOx, and NOx. Recently, the Department of Environment Malaysia enacted a new regulation called the Proposed New Environmental Quality (Clean Air) Regulation 201X (Draft). This new regulations replaces Malaysia Environmental Quality (Clean Air) 1978, besides specifying limits to additional pollutants from power generation using fossil fuel. The new pollutants include Hg, HCl, and HF with limits of 0.03, 100, and 15 mg/Nm3 at 6% O2, respectively. The three pollutants are included as they originate from the most volatile TEs (Hg, Cl, and F), which mainly emitted in the vapor phase.
To date, there are no published study related to TEs behavior in bottom ash, fly ash, and flue gas for Malaysian coal-fired power plants. But many studies have been conducted in countries that rely on coal to generate electricity, such as in China (Chen et al., Citation2013; Lee et al., Citation2006; Li et al., Citation2012; Tang et al., Citation2012; Wang et al., Citation2011; Wang et al., Citation2010; Wang et al., Citation2008; Zhong et al., Citation2010), the United States (Nyberg et al., Citation2009; Swanson et al., Citation2013), and India (Reddy et al., Citation2005; Sushil and Batra, Citation2006; Vejahati et al., Citation2010). The studies are mainly driven by the increasing number of coal-fired power plants, which leads to higher coal consumption and introduction of stringent regulation such as the Mercury and Air Toxic Standard (MATS) in the United States.
Therefore, this paper presents a comparison of behavior for the most volatile (Hg, Cl, F) and less volatile (As, Be, Cd, Cr, Ni, Se, Pb) TEs in subbituminous and bituminous coal and coal combustion products (CCP) (i.e., fly ash and bottom ash). The subbituminous and bituminous coal were separately burned in a coal-fired power plant in Malaysia. The effect of APCDs configuration in removal of TEs was also investigated to evaluate the effectiveness of abatement technologies used in the plant. This could assist power-plant operators in Malaysia in optimizing the application of APCDs for compliance with the new specified pollutants emission limits.
Methodology
Plant descriptions
The findings presented in this paper are based on sampling conducted at one coal-fired power plant in Malaysia. The descriptions of the power plant are provided in . The plant generates a total of 800 tons/day (tpd) of bottom ash and fly ash, of which 15% (120 tpd) is bottom ash and 85% (680 tpd) is fly ash. The bottom ash is dumped in an on-site ash pond, while fly ash is transported to be used as raw material in cement production.
Basic information of the studied coal-fired power plant
Coal characteristics
The studied coal-fired power plant burns subbituminous and bituminous coals that are imported from Indonesia, Australia, and South Africa. The plant practices coal blending before firing. The plant receives three types of coal quality, which vary in sulfur (S) content: for example, high (0.8 wt% S content), medium, and low (about 0.1 wt% S). The coals are stockpiled in the coal yard according to the different S content. Prior to feeding into furnace, a stacker reclaimer will grab and mix the coals before dumping the mixture into the conveyor to the feeder of the furnace.
The characteristics of the two types of coal are shown in . Generally, subbituminous coal is characterized by a lower calorific value (CV), carbon (C), and S content compared to bituminous coal. The plant practices coal quality specification such as S content < 1.1 wt%, ash content < 15 wt%, and moisture content < 28% to ensure minimal environmental impacts due to emission from coal combustion. The seawater FGD will not be operated if the S content of the coal is less than 0.3 wt%.
Characteristics of subbituminous and bituminous coals utilized in the studied coal-fired power plant
Plant configuration during sampling
For the purpose of this study, sampling configurations were designed as shown in . This is in order to study the effects of coal type and FGD operation on emissions of TEs from the studied coal-fired power plant. It should be noted that ESP was in operation for all runs.
Stack sampling configurations
Sample collection
Solid samples
The feed coal, fly ash and bottom ash samples were obtained from Run 1 (subbituminous coal, FGD off) and Run 3 (bituminous coal, FGD off). The samples of feed coal, fly ash and bottom ash were collected by grab sampling using a scoop. This is in accordance with the methods outlined in EPRI (Citation1994). A total of 2 kg sample for each feed coal, fly ash, and bottom ash was collected.
Flue gas sampling
Flue gas was sampled in accordance with the modified U.S. EPA Method 5: “Determination of particulate matter emissions from stationary sources” during firing of subbituminous and bituminous coal respectively. The method is preferred in this study, as TEs emissions are commonly associated with particulate phase. The sampling train is illustrated in .
Figure 1. Particulate sampling train (modified U.S. EPA Method 5).
The sampling train was comprised of filter paper (to trap pollutants in particulate phase), deionized water (to trap moisture), solution of H2O2 (to absorb heavy metals in vapor phase) and KMnO4 (to absorb Hg in vapor phase), and silica gel (to trap moisture).
Filter paper from the sampling train was analyzed for Hg, Cd, Pb, Sb, As, Zn, and Cu to determine emissions of the TEs in the particulate phase. For emissions of TEs in the vapor phase, solution of H2O2 was analyzed for Cl, F, Hg, Cd, Pb, Sb, As, Zn, and Cu, while the solution of KMnO4 was analyzed for Hg only. Even though KMnO4 is the reagent to absorb Hg, Hg was also tested for in H2O2 solution. This is because in the event that the valve of the stack sampler is quickly closed, backflow in impingers (refer to ) will occur, thus causing some KMnO4 to enter the H2O2 solution. This may result in the presence of Hg in H2O2 solution.
Analytical methods
Coal, fly ash, bottom ash, and flue gas samples were analyzed by accredited laboratories in Malaysia, namely, Spectrum Laboratories Sdn Bhd, TNB Research QATS Sdn Bhd, and NM Laboratory Sdn Bhd. More than one laboratory was engaged for the analysis due to the limited facilities at each laboratory. The sample preparation procedures were carried out in accordance with EPRI (Citation1994).
Concentrations of As, Be, Cd, Cr, Ni, Se, Pb, and Hg in coal, fly ash, and bottom ash were determined after microwave acid digestion using nitric acid (HNO3) and hydrofluoric acid (HF) in accordance with U.S. EPA Method 3052. A representative sample of 0.5 g was digested in 9 mL of concentrated HNO3 and 4 mL of HF for 15 min using microwave heating at temperature of 180°C. The accuracy of the method was verified using the reference material NIST SRM 2704. The resulting solutions were then analyzed by inductively coupled plasma–optical emission spectroscopy (ICP-OES) for As, Be, Cd, Cr, Ni, Se and Pb and atomic absorption spectrometry (AAS) for Hg. Concentrations of Cl and F were determined according to ASTM 6721-01 and BS EN 14582: 2007, respectively. The analysis techniques are summarized in .
Analytical method used to determine TEs in coal, bottom ash, and fly ash samples
Flue gas in sampling media collected from sampling train were analyzed as shown in . In addition, analysis of a field blank sample was also carried out. This is to verify that low blank concentrations were maintained in impingers’ reagents during fieldwork and to demonstrate that the reagents have not been contaminated during the field tests. In order to verify the measured concentration of Hg, F, and Cl, mass balance calculation was also carried out to determine the theoretical concentration of the TEs in flue gas, in which the measured concentration should be lower than its theoretical value.
Analytical method used to determine TEs in flue gas
Results and Discussion
TEs behavior in coal, bottom ash, and fly ash
Coal
As depicted in , subbituminous coal is characterized with lower C, S, CV, and ash content than bituminous coal. The average TEs concentrations in subbituminous and bituminous coals in comparison with published data are shown in . In this study, the TEs reported as “not detected” were assumed to be at the detection limit value. This is because TEs exist in low-level concentrations such that sometimes the analytical instruments used in measuring TE concentration are not capable to detect the presence of TEs. Therefore, it is inappropriate to simply state that a substance is not present as this would result in making poor environmental decisions. It was observed that the TEs concentrations in coal determined in this study do not deviate much from published data.
TEs (mg/kg) in subbituminous and bituminous coal
The concentration of TEs in subbituminous coal was found to be in the order of
The concentration of TEs in bituminous coal was found to be in the order of
The order of TEs concentrations differed with type of coal due to their different chemical affinity and mineral constituents such as quartz, gypsum, pyrite, and so on, which is not discussed in this study. The reasons for variation in TEs concentrations have been reviewed by Vejahati et al. (Citation2010), and include dissimilarity of analytical procedures used in determining the TEs concentrations. Chlorine and Ni were found higher in subbituminous coal while F, Be, Cr, and Pb were higher in bituminous coal. Li et al. (Citation2012) reported that low ash content in feed coal has resulted in low concentration of most TEs in fly ash and bottom ash. They also suggested that coal characterized with low S and ash content and medium CV would be expected to produce fly ash and slag that pose a reduced threat to the environment. Nevertheless, besides controlling the coal quality, it is also important to ensure that the combustion is efficient and the appropriate air pollution control system is installed to reduce the impacts of pollutant emissions to the environment.
Bottom ash
The elements in bottom ash from firing of subbituminous and bituminous coal are shown in . The C and S content in bottom ash of both coals corresponds well to their content in coal. Bituminous coal with higher C and S content than subbituminous coal resulted in bottom ash that has high C and S content.
Major elements (%) and trace elements (mg/kg) in bottom ash
The concentration of TEs in subbituminous bottom ash was found to be in the order of
The concentration of TEs in bituminous bottom ash was found to be in the order of
Arsenic (As), Hg, and Se content in bottom ash of both bituminous and subbituminuous coals showed similar concentrations as in feed coal (see ), with Hg having the lowest concentration (based on detection limit value). It is reported that for power plants equipped with hot-side ESP, the capture of Hg by bottom ash and fly ash was low and almost equal (Goodarzi, Citation2009), most probably due to the high volatility of the element. Berylium (Be) content was found equal in bottom ash from both type of coal, Cl and Ni were higher in bottom ash from subbituminous coal, and Cd, Cr, and Pb were higher in bituminous coal. Partitioning of TEs after combustion has resulted in different behavior of F. Even though the concentration of F was high in coal, its high volatility characteristic caused F to shift into fly ash and flue gas, and hardly condensed on bottom ash. Comparison of TEs in bottom ash from both coal types with TEs from other studies () showed good agreement. However, some discrepancies were observed, probably due to coal origin and combustion process. Goodarzi (Citation2009) reported that bottom ash from bituminous coal contained high concentrations of TEs such as As, Cr, Hg, Ni, and Pb compared to subbituminous coal. Such similar effects can be seen in this study for Cr and Pb only.
Fly ash
In general, fly ash is reported to contain higher concentrations of most TEs compared to bottom ash, which is especially true for very volatile TEs in Class III and to some extent for TEs in Class II (note that some works reported higher TEs in bottom ash compared to fly ash) (Bhangare et al., Citation2011; Córdoba, Ochoa-Gonzalez, et al., Citation2012; Sushil and Batra, Citation2006; Depoi et al., Citation2008; Reddy et al., Citation2005; Swanson et al., Citation2013). This is due to the volatilization of TEs during combustion and condensation on the surface of fly ash particles. A study by Świetlik et al. (Citation2012) showed that the concentrations of volatile TEs (Cd, Cu, Pb, and Zn) increase with decreasing particle size of fly ash that has higher surface area, whereas hardly volatile TEs (Fe and Mn) showed slight reduction.
The elements in fly ash from firing of subbituminous and bituminous coal are shown in . Comparison of TEs content between fly ash () and bottom ash () showed that, for subbituminous coal, the concentrations of Be, Pb, and Ni were lower in fly ash; however for bituminous coal, the concentrations of Cd and Pb were higher in fly ash. In contrast with bottom ash, F was detectable in fly ash, which indicated that F was volatilized during coal combustion and condensed on the surface of fly ash particles.
Major elements (%) and trace elements (mg/kg) in fly ash
The concentration of TEs in subbituminous fly ash was found to be in the order of
The concentration of TEs in bituminous fly ash was found to be in the order of
C and S content in fly ash was found to have a pattern similar to that of bottom ash from both coals. Bituminous coal with higher C and S content than subbituminous coal resulted in fly ash that has high C and S content. Concentration similar to coal and bottom ash was observed for As, Hg, and Se for both coal type. Mercury (Hg) remained to occur in the lowest concentration, indicating that the element most probably escaped in flue gas.
Relative enrichment (RE) factor
The RE factor for bottom ash and fly ash was determined using eq 1 and is shown in . For RE determination, the TEs reported as not detected were assumed to be at the detection limit value. It was found that subbituminous coal yielded a very low RE factor compared to bituminous coal, implying that ash from bituminous coal captured more elements than ash from subbituminous coal. Based on the RE definition that includes ash content in coal, it is speculated that such finding could be due to low ash content (2.3%) in subbituminous coal. Other studies reported higher ash content in coal of 11% in the Netherlands (Meij, Citation1995), 32.51–36.25% in India (Reddy et al., Citation2005), 28.7–54.25% in Brazil (Depoi et al., Citation2008), 15.3–33.2% in Canada (Goodarzi, Citation2009) and 26.31–30.5% in China (Tang et al., Citation2012). Ash content influences coal combustion in several aspects. Boyd (Citation2004) reported that high ash content caused coal to burn at lower temperature and subsequently affected partitioning behavior of TEs. Further, this would also affect the emission as reported by Goodarzi et al. (Citation2008). They observed increase of Hg and Ni emission and deposition from coal with high ash content.
Relative enrichment (RE) factor for bottom ash and fly ash
The RE factors for bottom ash and fly ash from both type of coals were mostly below than 1 except for for Cd, indicating that the TEs were volatilized with some condensed on the surface of fly ash particles and the remainder could be possibly emitted in flue gas. The findings from this study generally agree with the classification by Meij (Citation1995), where the studied TEs exhibited behavior similar to elements classified in Class II (As, Be, Cd, Cr, Ni, Pb) and Class III (Hg, Se, Cl, F).
TEs behavior in flue gas
The TEs behavior in flue gas was analyzed for most volatile (volatility in the order of Hg < Cl < F) and less volatile (Cd, Pb, Sb, As, Zn, and Cu) Tes from separate firing of subbituminous and bituminous coals, with and without FGD operation (). The amount of TEs in filter paper, H2O2 and KMnO4 collected from sampling train are shown in , , and , respectively. The results of filter paper digestion show that Hg, Cd, Sb, As, and Cu were not trapped in filter paper, suggesting that the TEs could be mainly emitted in the vapor phase. The presence of Pb and Zn in filter paper was probably due to condensation of the TEs on submicrometer particles that escaped ESP. Analysis of H2O2 and KMnO4 solution shows the presence of Cl, F, Cd, Pb, Zn, Cu, and Hg in the vapor phase, with Cl, F, and Hg detected at higher concentrations compared to other TEs. This is in agreement with Álvarez-Ayuso et al. (Citation2006), which reported that Cl, F, and Hg entered FGD mainly in vapor species. The findings correlate well with the volatility of TEs. As discussed previously, Hg was not detectable in coal, bottom ash, and fly ash. The detection of Hg in flue gas implied that Hg has a very low concentration in coal and after combustion it remained in the volatilized phase. It was also found from the analysis that particulate and vapor forms of As and Sb were not detected in flue gas. The TEs are Class II element and most probably enriched in fly ash. Nevertheless, as discussed earlier, As was below detection limit in coal, fly ash, and bottom ash. Thus, the emission of As from the studied power plant should be of less concern.
TEs (mg) in filter paper digestion solution
TEs (mg/L) in H2O2 solution
Mercury (Hg) (mg/L) in KMnO4 solution
Comparison of TEs emission between firing of subbituminous and bituminous coal
In terms of coal type, it was observed that type of coal in a certain way influenced the emission of TEs in flue gas. For emission of TEs in particulate phase (), it was found that emission of particulate Pb was slightly lower for subbituminous coal and no distinct trend was observed for Zn. For emission of TEs in vapor form (), concentrations of Cl, Zn, and Cu were higher for subbituminous coal and no distinct trend was observed for F, Cd, and Pb. The concentration of Pb and Cl in flue gas could be related to their concentration in coal. As shown in , subbituminous coal with originally lower concentration of Pb and higher Cl than bituminous coal has led to lower Pb and higher Cl emission from firing of subbituminous coal. The influence of Hg content in coal on Hg emission was not clear, as its concentration in both coals was similar. Nevertheless, a correlation of Hg emission with Cl and S content in coal can be observed. Subbituminous coal (runs 1 and 2 in ) with high Cl but lower S content than bituminous coal resulted in slightly lower Hg emission. A number of studies have shown that Cl could improve the removal of Hg (Wang et al., Citation2008; Serre and Chun, Citation2009; Buitrago, Citation2011), where Cl could oxidize elemental mercury (Hg°) to divalent mercury (Hg2+). The former is only slightly soluble in water and is highly volatile at typical combustion and air pollution control temperatures, which make its capture by conventional means difficult, whereas the latter is water soluble and easily removed by wet FGD. However, a review by Buitrago (Citation2011) shows that in the presence of high SO2, the oxidization process is inhibited because SO2 is a dechlorination agent, thus resulting in decreased Hg oxidation by Cl.
Effects of APCDs configuration to TEs content in flue gas
The studied plant installed ESP and FGD, which are typical APCDs in coal-fired power plants. The ESP is a cold-side type, while the FGD uses seawater as sorbent. The APCDs were initially installed to comply with specified limits in Environmental Quality (Clean Air) 1978 for parameters of dust, SOx, and NOx, with ESP for dust and FGD for acid gases removal. For the proposed new regulation, which includes Hg, HCl, and HF, it is important to assess the effectiveness of the abatement technologies in removal of the pollutants.
The removal of particulate TEs by ESP was indicated by the presence of selected TEs in fly ash (). Of the measured TEs concentration in fly ash, Be, Cd, Ni, and Pb were detected in fly ash while concentrations of As, Hg, Se, and Cr were below detection limit. A study by Świetlik et al. (Citation2012) reported the occurrence of Cd and Pb in fly ash from ESP where Cd was detected at very low concentration (<1.5 mg/kg), indicating discharge to the atmosphere, while Pb concentration was increasing with decreasing particle size, which confirmed the mechanism of formation through a volatilization–condensation process.
For emission of vapor TEs, the emission that resulted from operation of ESP only (runs 1 and 3 in and ) showed lower Hg and Cl compared to when FGD was applied regardless of coal type, but no distinct trend was observed for F. This is contrary to the findings that wet FGD could reduce the emission of volatile TEs as reported in the literature (Córdoba, Ochoa-Gonzalez, et al., Citation2012; Meij and te Winkel, Citation2007; Swanson et al., Citation2013; Tang et al., Citation2012). The reduction could be achieved because FGD resulted in the cooling of flue gas, allowing the more volatile TEs to condense from the vapor phase (Swaine and Goodarzi, Citation1995). It should be noted that the reported wet FGD used limestone as sorbent, whereas the FGD in this study used seawater as sorbent. It is predicted that such contradictory occurrence in this study is due to the type of sorbent used in FGD. Based on literature search, the data on TEs emissions from seawater FGD are not well published. Nevertheless, the increase of chlorine when FGD was applied could be due to seawater being a source of chlorine. Seawater contains about 25,150 mg/L Cl (Abu-Eishah and Babahar, Citation2011). A similar situation could be seen for limestone FGD, where the lime provides a significant source of TEs such as As, Cd, Pb, and Zn and contributes to more than 90% of the TEs introduced to FGD system (Clarke, Citation1995). Another similar example is application of Hg control technologies such as activated carbon injection (ACI), addition of calcium chloride (CaCl2) to coal, and addition of sorbent enhancement additive (SEA), which have resulted in increase of Cr, Ni, and Pb emission that was most likely due to the halides introduced into the flue gas (Nyberg et al., Citation2009). For vapor emission of less volatile TEs such as Pb, Cd, and Zn, it was found that FGD could increase the removal of these elements in flue gas.
Environmental assessment
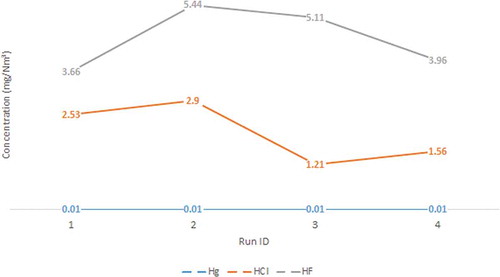
The impacts of TEs emission from coal-fired power plant could be assessed by comparing with available guidelines and regulations. The concentrations of TEs in bottom ash and fly ash measured in this study were well below Malaysian Department of Environment (DOE) Scheduled Waste Guideline limits (As: 500, Be: 75, Hg: 20, Cd: 100, Cr: 2500, Ni: 2000, Se: 100, Pb: 1000, all in mg/kg). Meanwhile, the emission concentrations of Hg (0.01 mg/Nm3), HCl (1.21–2.59 mg/Nm3), and HF (3.66–5.11 mg/Nm3) as shown in were also below the specified limits of 0.03, 100, and 15 mg/Nm3 at 6% O2, respectively, in the Proposed New Environmental Quality (Clean Air) Regulation 201X (Draft), which replaces Malaysia Environmental Quality (Clean Air) 1978. Therefore, the impacts of TEs emission from the studied coal-fired power plant could be deemed minimal.
Figure 2. Concentration (mg/N-m3) of Hg, HCl, and HF in flue gas.
Emissions of Hg, HCl, and HF obtained in this study are then compared to data from other plants in Malaysia and other countries. It was found that data on Hg emission from actual coal-fired power plants are well published, whereas data for HCl and HF are very much limited to small coal combustion facilities as reported in Gieré et al. (Citation2006) and Serre and Chun (Citation2009); meanwhile, some literature reported emission in Cl and F form, making comparison difficult.
Based on an unpublished monitoring report, the Hg emission from Plant A in Malaysia is 0.02 mg/Nm3, which is higher than the Hg emission (0.01 mg/N-m3) obtained for the plant in this study. A review on Hg emission data from other countries demonstrates lower values, for example, 0.0011–0.0024 mg/N-m3 in Korea (Pudasainee et al., Citation2009), 0.00042–0.0011 mg/N-m3 in Japan (Yokoyama et al., Citation2000), and <0.011 mg/N-m3 in Poland (Glodek and Pacyna, Citation2009). The high Hg emission from this study is found to be in the range of Hg emission measured at the inlet of FGD (0.0085 mg/N-m3) reported in Pudasainee et al. (Citation2012). Therefore, it is worth pointing out that even though the Hg emission reported in this study is lower than the specified emission limit, it may be necessary to introduce Hg control technology in the studied plant to further reduce Hg emission.
Even though true comparison cannot be made, literature values of HCl/Cl and HF/F emission are more or less similar to the values reported in this study (1.21–2.9 mg/N-m3 for HCl and 3.66-5.11 mg/N-m3 for HF). Gieré et al. (Citation2006) reported 3.83 mg/N-m3 HCl and 1.11 mg/N-m3 HF from coal combustion in a stoker boiler equipped with a cyclone and ESP. In term of Cl and F emission, Ito et al. (Citation2006) reported total F (gas and particulate) of 0.6 mg/N-m3. Meij and te Winkel (Citation2004) presented variation of Cl and F emission with and without installation of a gas–gas heat exchanger (GGHE). For installation with GGHE, Cl and F emission is 1.9 and 0.476 mg/N-m3, respectively, whereas for installation without GGHE, Cl and F emission increased to 3.76 and 2.855 mg/N-m3, respectively.
Conclusion
This paper presents the comparison of TEs behavior of the most volatile (Hg, Cl, F) and less volatile (As, Be, Cd, Cr, Ni, Se, Pb) in subbituminous and bituminous coal and coal combustion products (CCP) (i.e., fly ash and bottom ash) from separate firing of subbituminous and bituminous coal in a coal-fired power plant in Malaysia. The effect of APCDs configuration in removal of TEs was also investigated to evaluate the effectiveness of abatement technologies used in the plant.
It was found that subbituminous and bituminous coals and their CCPs have different TEs behavior. The TEs behavior in bottom ash, fly ash, and flue gas was influenced by their chemical properties such as volatility and composition in coal and could be described by RE factor. The RE factors for ash from subbituminous coal were found very low when compared to bituminous coal, possibly due to low ash content of subbituminous coal. Thus, this could imply that ash from bituminous coal captured more elements than ash from subbituminous coal. The RE factors for bottom ash and fly ash from both type of coals were mostly below than 1, indicating that the TEs were volatilized with some condensed on the surface of fly ash particles, and the remainder could possibly be emitted in flue gas.
It was observed that type of coal and concentrations of TEs in coal in certain ways influenced the emission of TEs in flue gas. The ESP and FGD used in the studied coal-fired power plant were found effective in removing TEs in particulate and vapor form, respectively. The environmental assessment of TEs emission from the studied coal-fired power plant showed compliance with the limits specified in the Malaysian Department of Environment (DOE) Scheduled Waste Guideline for bottom ash and fly ash and the Proposed New Environmental Quality (Clean Air) Regulation 201X (Draft), which replaces the Malaysia Environmental Quality (Clean Air) 1978 for stack emission. From the findings of this study, it can be concluded that the operation of ESP alone could mitigate the emission of TEs; nevertheless, FGD is still required for removal of SO2 when coal of high S content is burned. In addition, this study indicates that it may be necessary to introduce Hg control technology in the studied plant to further reduce Hg emission.
Funding
The authors express their sincere gratitude to Universiti Teknologi Malaysia and Ministry of Higher Education (MOHE), Malaysia, for supporting the project under Research University Grant (RUG) Vote Q.J130000.2544.03H37.
Additional information
Notes on contributors
Mutahharah M. Mokhtar
Mutahharah M. Mokhtar is a Ph.D. candidate and Rozainee M. Taib is a professor in environmental engineering at Universiti Teknologi Malaysia.
Mimi H. Hassim
Mimi H. Hassim is a lecturer and researcher in occupational safety and health at Universiti Teknologi Malaysia.
References
- Abu-Eishah, S.I., and H.S.A. Babahar. 2011. Investigation on the minimization of SO2 emissions at Das Island (UAE): Part I—Current schemes vs. modified schemes. J. Environ. Pollut. Control Manage. 3(1): 47–67.
- Álvarez-Ayuso, E., X. Querol, and A. Tomás. 2006. Environmental impact of a coal combustion-desulphurisation plant: Abatement capacity of desulphurisation process and environmental characterisation of combustion by-products. Chemosphere 65(11): 2009–17. doi:10.1016/j.chemosphere.2006.06.070
- Barbara, G., G.G. Steven, and G.E. Lisa. 2010. Coal ash: The toxic threat to our health and environment. Physicians for Social Responsibility and Earth Justice. http://www.psr.org/assets/pdfs/coal-ash.pdf.
- Bhangare, R.C., P.Y. Ajmal, S.K. Sahu, G.G. Pandit, and V.D. Puranik. 2011. Distribution of trace elements in coal and combustion residues from five thermal power plants in India. Int. J. Coal Geol. 86 (4): 349–56. doi:10.1016/j.coal.2011.03.008
- Boyd, R.J. 2004. Trace elements in coal from Collinsville, Bowen Basin, Australia-in-ground mode of occurence and behaviour during utilisation. School of Earth Sciences, James Cook University, Townsville, Queensland, Australia.
- Brown, T.D., D.N. Smith, W.J. O’Dowd, and R.A. Hargis, Jr. 2000. Control of mercury emissions from coal-fired power plants: A preliminary cost assessment and the next steps for accurately assessing control costs. Fuel Process. Technol. 65–66(0):311–41. doi:10.1016/S0378-3820(00)00081-3
- Buitrago, P.A. 2011. Gas-Phase Mercury Oxidation: Effects of Bromine, Chlorine and SO2 Under Air Firing and Oxy-Fuel Conditions, Experimental and Modeling Study. Department of Chemical Engineering, University of Utah, Salt Lake City, UT.
- Chen, J., G. Liu, Y. Kang, B. Wu, R. Sun, C. Zhou, and D. Wu. 2013. Atmospheric emissions of F, As, Se, Hg, and Sb from coal-fired power and heat generation in China. Chemosphere 90(6): 1925–32. doi:10.1016/j.chemosphere.2012.10.032
- Clarke, L.B. 1995. The fate of trace elements in emissions control systems. In Environmental Aspects of Trace Elements in Coal, ed. D.J. Swaine and F. Goodarzi, 128–143. Dordrecht, The Netherlands: Kluwer Academic.
- Córdoba, P., O. Font, M. Izquierdo, X. Querol, C. Leiva, M. A. López-Antón, M. Díaz-Somoano, R. Ochoa-González, M. Rosa Martinez-Tarazona, and P. Gómez. 2012. The retention capacity for trace elements by the flue gas desulphurisation system under operational conditions of a co-combustion power plant. Fuel 102(0): 773–88. doi:10.1016/j.fuel.2012.06.059
- Córdoba, P., R. Ochoa-Gonzalez, O. Font, M. Izquierdo, X. Querol, C. Leiva, M. A. López-Antón, M. Díaz-Somoano, M. Rosa Martinez-Tarazona, C. Fernandez, and A. Tomás. 2012. Partitioning of trace inorganic elements in a coal-fired power plant equipped with a wet Flue Gas Desulphurisation system. Fuel 92(1): 145–57. doi:10.1016/j.fuel.2011.07.025
- Depoi, F. S., D. Pozebon, and W. D. Kalkreuth. 2008. Chemical characterization of feed coals and combustion-by-products from Brazilian power plants. Int. J. Coal Geol. 76(3): 227–36. doi:10.1016/j.coal.2008.07.013
- Electric Power Research Institute . 1994. Electric Utility Trace Substances Synthesis Report. Volume 1: Synthesis Report (TR-104614-V1). Palo Alto, CA: Electric Power Research Institute (EPRI).
- Energy Commission. 2013. Peninsular Malaysia Electricity Supply Industry Outlook 2013. Malaysia.
- Finkelman, R. B. 2000. Health Impacts of Coal Combustion. USGS Fact Sheet FS–094–00. http://pubs.usgs.gov/fs/fs94-00/fs094-00.pdf.
- Gieré, R., K. Smith, and M. Blackford. 2006. Chemical composition of fuels and emissions from a coal + tire combustion experiment in a power station. Fuel 85(16): 2278–85. doi:10.1016/j.fuel.2005.11.024
- Glodek, A., and J.M. Pacyna. 2009. Mercury emission from coal-fired power plants in Poland. Atmos. Environ. 43(35): 5668–73. doi:10.1016/j.atmosenv.2009.07.041
- Goodarzi, F. 2009. Environmental assessment of bottom ash from canadian coal-fired power plants. Open Environ. Biol. Monit. J. 2:1–10. doi:10.2174/1875040000902010001
- Goodarzi, F., F.E. Huggins, and H. Sanei. 2008. Assessment of elements, speciation of As, Cr, Ni and emitted Hg for a Canadian power plant burning bituminous coal. Int. J. Coal Geol. 74(1): 1–12. doi:10.1016/j.coal.2007.09.002
- Ito, S., T. Yokoyama, and K. Asakura. 2006. Emissions of mercury and other trace elements from coal-fired power plants in Japan. Sci. Total Environ. 368(1): 397–402. doi:10.1016/j.scitotenv.2005.09.044
- Lee, S.J., Y.-C. Seo, H.-N. Jang, K.-S. Park, J.-I. Baek, H.-S. An, and K.-C. Song. 2006. Speciation and mass distribution of mercury in a bituminous coal-fired power plant. Atmos. Environ. 40(12): 2215–24. doi:10.1016/j.atmosenv.2005.12.013
- Li, J., X. Zhuang, X. Querol, O. Font, N. Moreno, and J. Zhou. 2012. Environmental geochemistry of the feed coals and their combustion by-products from two coal-fired power plants in Xinjiang Province, Northwest China. Fuel 95(0): 446–56. doi:10.1016/j.fuel.2011.10.025
- Meij, R. 1995. The distribution of trace elements during the combustion of coal. In Environmental Aspects of Trace Elements in Coal, 111–27. Dordrecht, The Netherlands: Kluwer Academic.
- Meij, R., and B. te Winkel. 2004. The emissions and environmental impact of PM10 and trace elements from a modern coal-fired power plant equipped with ESP and wet FGD. Fuel Process. Technol. 85(6–7): 641–56. doi:10.1016/j.fuproc.2003.11.012
- Meij, R., and H. te Winkel. 2006. Mercury emissions from coal-fired power stations: The current state of the art in the Netherlands. Sci. e Total Environ. 368(1): 393–96. doi:10.1016/j.scitotenv.2005.09.083
- Meij, R., and H. te Winkel. 2007. The emissions of heavy metals and persistent organic pollutants from modern coal-fired power stations. Atmos. Environ. 41(40): 9262–72. doi:10.1016/j.atmosenv.2007.04.042
- Miller, B.G., and S.F. Miller. 2010. Trace Elements Emitted During Stationary Combustion. Penn State University Earth and Mineral Science Energy Institute. http://www.energy.psu.edu/sites/default/files/file/Trace_Elements_Program.pdf.
- Nyberg, C.M., J.S. Thompson, Y. Zhuang, J.H. Pavlish, L. Brickett, and S. Pletcher. 2009. Fate of trace element haps when applying mercury control technologies. Fuel Process. Technol. 90(11): 1348–53. doi:10.1016/j.fuproc.2009.06.025
- Pudasainee, D., J.-H. Kim, and Y.-C. Seo. 2009. Mercury emission trend influenced by stringent air pollutants regulation for coal-fired power plants in Korea. Atmos. Environ. 43(39): 6254–59. doi:10.1016/j.atmosenv.2009.06.007
- Pudasainee, D., J.-H. Kim, Y.-S. Yoon, and Y.-C. Seo. 2012. Oxidation, reemission and mass distribution of mercury in bituminous coal-fired power plants with SCR, CS-ESP and wet FGD. Fuel 93(0): 312–18. doi:10.1016/j.fuel.2011.10.012
- Reddy, M. S., S. Basha, H. V. Joshi, and B. Jha. 2005. Evaluation of the emission characteristics of trace metals from coal and fuel oil fired power plants and their fate during combustion. J. Hazard. Mater. 123(1–3): 242–49. doi:10.1016/j.jhazmat.2005.04.008
- Serre, S.D., and W.L. Chun. 2009. Evaluation of the Impact of Chlorine on Mercury Oxidation in a Pilot-Scale Coal Combustor—The Effect of Coal Blending. Washington, DC: U.S. Environmental Protection Agency.
- Srivasta, R.K., C.B. Sedman, J.D. Kilgroe, D. Smith, and S. Renninger. 2001. Preliminary estimates of performance and cost of mercury control technology applications on electric utility boilers. J. Air Waste Manage. Assoc. 51:1460–70. doi:10.1080/10473289.2001.10464376
- Sushil, S., and V.S. Batra. 2006. Analysis of fly ash heavy metal content and disposal in three thermal power plants in India. Fuel 85 (17–18): 2676–79. doi:10.1016/j.fuel.2006.04.031
- Swaine, D.J. 1990. Trace Elements in Coal. London, UK: Butterworth.
- Swaine, D.J., and F. Goodarzi. 1995. Environmental Aspects of Trace Elements in Coal. Dordrecht, The Netherlands: Kluwer Academic.
- Swanson, S.M., M.A. Engle, L.F. Ruppert, R.H. Affolter, and K.B. Jones. 2013. Partitioning of selected trace elements in coal combustion products from two coal-burning power plants in the United States. Int. J. Coal Geol. 113(0): 116–26. doi:10.1016/j.coal.2012.08.010
- Świetlik, R., M. Trojanowska, and M.A. Jóźwiak. 2012. Evaluation of the distribution of heavy metals and their chemical forms in ESP-fractions of fly ash. Fuel Process. Technol. 95(0): 109–18. doi:10.1016/j.fuproc.2011.11.019
- Tang, Q., G. Liu, Z. Yan, and R. Sun. 2012. Distribution and fate of environmentally sensitive elements (arsenic, mercury, stibium and selenium) in coal-fired power plants at Huainan, Anhui, China. Fuel 95(0): 334–39. doi:10.1016/j.fuel.2011.12.052
- U.S. Environmental Protection Agency. 2011. National emission standards for hazardous air pollutants from coal and oil-fired electric utility steam generating units and standards of performance for fossil-fuel-fired electric utility, industrial-commercial-institutional, and small industrial-commercial-institutional steam generating units. In 40 CFR Parts 60 and 63.
- Vejahati, F., Z. Xu, and R. Gupta. 2010. Trace elements in coal: Associations with coal and minerals and their behavior during coal utilization—A review. Fuel no. 89(4): 904–11. doi:10.1016/j.fuel.2009.06.013
- Wang, J., W. Wang, W. Xu, X. Wang, and S. Zhao. 2011. Mercury removals by existing pollutants control devices of four coal-fired power plants in China. J. Environ. Sci. 23(11): 1839–44. doi:10.1016/S1001-0742(10)60584-0
- Wang, L., Y. Ju, G. Liu, C-L. Chou, L. Zheng, and C. Qi. 2010. Selenium in Chinese coals: distribution, occurrence, and health impact. Environ. Earth Sci. 60: 1641–51. doi:10.1007/s12665-009-0298-8.doi:10.1007/s12665-009-0298-8
- Wang, Y.-J., Y.-F. Duan, L.-G. Yang, Y.-M. Jiang, C.-J. Wu, Q. Wang, and X.-H. Yang. 2008. Comparison of mercury removal characteristic between fabric filter and electrostatic precipitators of coal-fired power plants. J. Fuel Chem. Technol. 36(1): 23–29. doi:10.1016/S1872-5813(08)60009-2
- Xu, M., R. Yan, C. Zheng, Y. Qiao, J. Han, and C. Sheng. 2004. Status of trace element emission in a coal combustion process: A review. Fuel Process. Technol. 85(2–3): 215–37. doi:10.1016/S0378-3820(03)00174-7
- Yokoyama, T., K. Asakura, H. Matsuda, S. Ito, and N. Noda. 2000. Mercury emissions from a coal-fired power plant in Japan. Sci. Total Environ. 259(1–3): 97–103. doi:10.1016/S0048-9697(00)00552-0
- Zhong, L.-P., Y. Cao, W.-Y. Li, W.-P. Pan, and K.-C. Xie. 2010. Effect of the existing air pollutant control devices on mercury emission in coal-fired power plants. J. Fuel Chem. Technol. 38(6): 641–46. doi:10.1016/S1872-5813(11)60001-7