
Abstract
Extensive use of biochar to mitigate nitrous oxide (N2O) emission is limited by the lack of understanding on the exact mechanisms altering N2O emission from biochar-amended soil. Biochars produced from rice straw and dairy manure at 350 and 500 °C by oxygen-limited pyrolysis were used to investigate their influence on N2O emission. A quadratic effect of biochar levels was observed on the N2O emissions. The potential mechanisms were explored by terminal restriction fragment length polymorphism (T-RFLP) and real-time polymerase chain reaction (qPCR). A lower relative abundance of bacteria, which included ammonia-oxidizing bacteria (AOB) and nitrite-oxidizing bacteria (NOB), was observed at 4% biochar application rate. Reduced copy numbers of the ammonia monooxygenase gene amoA and the nitrite reductase gene nirS coincided with decreased N2O emissions. Therefore, biochar may potentially alter N2O emission by affecting ammonia-oxidizing and denitrification bacteria, which is determined by the application rate of biochar in soil.
Implications:
Biochar research has received increased interest in recent years because of the potential beneficial effects of biochar on soil properties. Recent research shows that biochar can alter the rates of nitrogen cycling in soil systems by influencing nitrification and denitrification, which are key sources of the greenhouse gas nitrous oxide (N2O). However, there are still some controversial data. The purpose of this research was to (1) examine how applications of different dose of biochar to soil affect emission of N2O and (2) improve the understanding of the underlying mechanisms.
Introduction
Biochar research has received increased interest in recent years because of the potential beneficial effects of biochar on soil properties. Biochar is a carbon-rich, fine-grained, porous substance produced by the thermal decomposition of biomass under oxygen-limited conditions and at relatively low temperatures (<700 °C) (Manyà, Citation2012; Lehmann and Joseph, Citation2009). Biochar is relatively stable in soil, with nutrient retention better than for other forms of organic matter. Nitrogen (N) is an essential nutrient, and recent research shows that biochar can alter the rates of N cycling in soil systems by influencing nitrification and denitrification, which are key sources of the greenhouse gas nitrous oxide (N2O). Yanai et al. (Citation2007) performed a short-term laboratory incubation experiment where biochar derived from municipal biowaste was applied at 180 t ha−1 and found a significant decrease in N2O emission in a wetted volcanic ash soil. In line with these results, Zhang et al. (Citation2010) showed that total N2O emissions from a hydroagric stagnic anthrosol decreased by 40–51% and by 21–28% after adding biochar (produced by slow pyrolysis of wheat straw at 350–550 °C) at a rate of 40 t ha−1 compared with control treatments with and without N-fertilizer, respectively. Similar findings have been reported by Sarkhot et al. (Citation2012) for dairy manure–derived biochar (DBC; 26% reduction in cumulative N2O flux). However, extensive use of biochar to mitigate N2O emission is limited by the lack of understanding on the exact mechanisms altering N2O emission from biochar-amended soils. Yanai et al. (Citation2007) believed that biochar improves soil aeration, thereby reducing denitrification. However, the addition of biochar cannot sufficiently improve soil aeration to reduce denitrification at 83% water-filled porosity, and N2O fluxes increase (Clough and Condron, Citation2010). Thus, the mechanisms behind the change in N2O dynamics remain more complex than previously believed.
Two microbial processes, namely, nitrification and denitrification, are mainly responsible for N2O production in soil (Davidson, Citation1986; Wrage, Citation2001). Nitrification is the key and often rate-limiting step in N removal (Hee-Deung, 2006), and it includes two steps: oxidation of ammonia to nitrite catalyzed by ammonia-oxidizing bacteria (AOB), and oxidation of nitrite to nitrate by nitrite-oxidizing bacteria (NOB). The AOB synthesize ammonia monooxygenase (AMO), the key enzyme responsible for the conversion of ammonia to hydroxylamine. AMO is composed of three subunits encoded by amoA, amoB, and amoC genes (Klotz et al., Citation1997). Among these three genes, amoA is the most extensively used to study ammonia oxidizers and has a well-established database compared with amoB and amoC (Francis et al., Citation2005; Okanoet et al., Citation2004). Di et al. (Citation2010) showed that total N2O emissions were significantly related to the amoA gene copy numbers of the AOB population. Nitrite reductase is a central enzyme in the denitrification pathway because it catalyzes the reaction producing the first gaseous product, nitric oxide (NO), which is largely unavailable for use by other organisms (Ye, Citation1994). Nitrite reductase has two primary forms: one containing cytochromes c and d1 (cd1-NiR) and the other containing two copper centers (Cu-NiR) at each active site. Cu-NiR is encoded by the nirK gene, and cd1-NiR is encoded by the nirS gene. Despite their structural differences (Adman et al., Citation1995; Williams et al., Citation1997), these two forms of nitrite reductase have the same physiological function in denitrifying bacteria. The potential mechanisms for biochar to reduce production of the greenhouse gas N2O and resulting N loss from soil should be studied in more details.
We hypothesized that biochar can potentially alter N2O emission in soil by affecting ammonia- and nitrite-oxidizing bacteria, which is determined by the application rate of biochar. However, data on the dose-response of biochar application to soil lack systematic assessment and the effects of biochar on ammonia- and nitrite-oxidizing bacteria in soil are limited (Quilliam et al., Citation2012). Several important analytical challenges arise as a result of the strong sorption of lysed cells, cell contents, and microbial exoenzymes to biochar. When biochar is added to soil, DNA yield typically decreases (Jin, Citation2010), and this phenomenon has been described previously for various charcoals and activated carbons (Gani et al., Citation1999). Enzyme interactions with biochars have been studied by Bailey et al. who recommended fluorescence studies because sorption can make color reactions less reliable (Bailey et al., Citation2010). Jin (Citation2010) affirmed the robustness of results of terminal restriction fragment length polymorphism (T-RFLP) analyses. T-RFLP technique is based on the detection of fluorescently labeled terminal restriction fragments of the target gene. The application of T-RFLP in the analysis of soil microbial communities enables the presence of dominant taxa within a community to be detected (Singh and Walker, Citation2006).
In the present study, T-RFLP and real-time polymerase chain reaction (qPCR) quantitative analyses were used to analyze the community composition and to determine the identity of specific organisms in soil amended with biochar. The qPCR analysis is a very sensitive, quantitative molecular method applied in clinical microbiology, molecular ecology, and environmental microbiology (Yu et al., Citation2005). Unlike other quantitative molecular techniques, qPCR is a fluorescence-based, kinetic PCR method that allows rapid quantification of the initial number of copies of a target gene. The purpose of this research was to (1) examine how applications of different dose of biochar to soil affect emission of N2O and (2) improve the understanding of the underlying mechanisms.
Materials and Methods
Biochar
The biochar used was produced from rice straw and dairy manure biomass. In a typical procedure, air-dried rice straw or air-dried dairy manure were passed through a 1-mm sieve and then heated at 350 or 500 °C in a muffle furnace under an oxygen-limited condition during biochar production for 4 hr. The different biochars characterized for mineral composition and elemental concentrations are presented in detail in . Total carbon (C), total N, and other elements were measured in the Instrumental Analysis Center of Shanghai Jiao Tong University, Shanghai, China.
Table 1. Selected properties of the biochar (BC), mean of three replicates (n = 3)
Soil sampling and treatment
Soils were collected from Pujiang (31°05′N, 121°30′E) in Shanghai, China. Three soil cores were obtained within a 1-m radius of the sampling site and analyzed as composite samples. Soils were collected from a depth of 0–20 cm, air dried, and passed through a 2-mm sieve. The soils were characterized for pH, organic C (OC), cation exchange capacity (CEC), particle size, and concentrations of N and P using standard methods. (American Society for Testing and Materials [ASTM], Citation2000; Miller and Keeney, Citation1982; U.S. Environmental Protection Agency [EPA], Citation1986). Selected properties are presented in .
Table 2. Physical and chemical properties of the tested soils, mean of three replicates (n = 3)
Mesocosms (plastic containers) with a height of 10 cm and a diameter of 13 cm were incubated in triplicate per treatment. Per mesocosm was mixed with 500 g of (<2 mm) air-dried soil with the biochar at addition rates of 1%, 2%, 4%, and 8% dry weight. Soil without biochar was designated as a control, and these treatments were incubated at a moisture content of 20 ± 5% by gravimetric method. The mesocosms were put in closed airtight with a lid and incubated at 25 °C inside an incubation cabinet. After expected period, soil samples were collected and analyzed for N2O, bacterial community, and qPCR.
N2O emission determination
For N2O emission determination, a quantity of nitrate equivalent to 100 mg N kg−1 soil was added from a KNO3 solution. After 1 hr incubation, the concentration of N2O-N in the headspace was measured by extracting 10 mL of headspace air with a gas-tight syringe. The N2O-N was measured via gas chromatography (GC; Agilent 5890 GC; Agilent Technologies, Little Falls, DE, USA) equipped with an electron capture detector (ECD). Calibration curves for each treatment were obtained before each measurement by injecting the N2O standard gas. After each measurement, the plastic containers were left open to replenish oxygen. N2O emissions were measured till the N2O concentrations in the headspace of the closed containers were below detection limit. Percent N2O emission inhibition by biochar was calculated by the following formula: N2O emission inhibition (%) = (N0 − NB) × 100/N0, where N0 and NB denote the N2O emissions from soil without or with biochar (Mukome et al., Citation2013).
Bacterial community analysis
The heterogeneity of 16S rRNA gene sequences from control and biochar-amended paddy soil DNA samples was analyzed by T-RFLP (Max et al., Citation2011). Total bacterial DNA was extracted from soil samples and performed using E.Z.N.A. soil DNA kit (Omega BioTek, Inc., Norcross, GA, USA) according to the manufacturer’s instructions. The DNA pellet was dissolved in 60 μL of TE buffer (10 mM Tris–HCl, 1 mM EDTA, pH 8.0). DNA recovered was purified further using a AxyPrep gel extraction kit (AxyGen, Hangzhou, China). Extracted purified DNA was visualized by electrophoresis in 1% agarose gels and spectrophotometrically quantified by NanoDrop 2000 (NanoDrop Technologies, Wilmington, DE, USA). Finally, extracted DNA was diluted to 10 ng mL−1 prior to PCR amplification. An approximately 600-bp fragment of bacterial 16S rRNA gene was amplified by PCR using the primers 341f (5’-CCT ACG GGA GGC AGC AG-3’) labeled with 6-carboxyfluorescein at the 5’ end, and 907r (5’-CCG TCA ATT CMT TTG AGT TT-3’) (Liu et al., Citation1997). PCR amplification consisted of an initial denaturation step of 95 °C for 180 sec, followed by 25 cycles of denaturation at 94 °C for 45 sec, annealing at 55 °C for 30 sec, and elongation at 72 °C for 180 sec. Cycling was completed with a final elongation step of 72 °C for 10 min (Egert and Friedrich, Citation2003). PCR products were purified using an Axygen gel extraction kit. Finally, DNA was resuspended in nuclease-free double-distilled water and spectrophotometrically quantified by NanoDrop 2000. Approximately 2-mg aliquots of each pooled PCR product were digested for 16 hr at 37 °C with MspI. The size of individual terminal fragments (T-RFs) was determined with an ABI Prism 3130 genetic analyzer (Applied Biosystems, Foster City, CA, USA). The peaks in each profile were related to specific fragment lengths based on a size marker (500MapMarker). Raw T-RFLP data were retrieved using Peak Scanner version 1.0 (Applied Biosystems). The size (in base pairs) of each peak (T-RF) was used to indicate an operational taxonomic unit (OTU), whereas the areas of the peak were used to determine its relative abundance in the profile. T-RF sizes were aligned to the nearest size. In each sample, T-RF areas were normalized by the total area of T-RFs in that sample. UPGMA (unweighted pair group method with arithmetic mean) clustering analysis based on Jaccard similarity was performed using the PAleo-ecology Statistics (PAST) freeware package, version 2.15 (Hammer, Citation2001).
Real-time quantitative PCR assay
The abundance of N cycle genes was assessed by real-time qPCR using an ABI Step OnePlus system (Applied Biosystems). To quantify potential ammonia oxidizers and denitrifiers in soil, the amoA and nirS gene copy numbers were quantified by qPCR. The primers used for amoA and nirS amplification were (a) amoA1F (5’-GGG GTT TCT ACT GGT GT-3’) and amoA2R (5’-CCC CTC KGS AAA GCC TTC TTC-3’); and (b) nirS4F (5’-TTC (A/G)TC AAG AC(C/G) CA(C/T) CCG AA-3’) and nirS6R (5’-CGT TGA ACT T(A/G)C CGG T-3’) (Rotthauwe et al., Citation1997; Braker et al., Citation1998).
The qPCR mixture (20 μL final volume) contained 2 μL of template DNA (or filtered sterile molecular biology water [Sigma Aldrich, St. Louis, MO, USA] as a negative control), 10 μL of SYBR Premix Ex Taq II (2×) (TaKaRa, DaLian, China), 0.4 μL of ROX reference dye (50×), and 10 μmol of each primer (amoA1F and amoA2R) for amoA and (nirS4F and nirS6R) nirS. The following two-stage temperature profile was used for amplification: heating to 95 °C for 30 sec, followed by 40 cycles of denaturation at 95 °C for 5 sec and primer annealing at specific annealing temperatures (58 °C for 30 sec for amoA and 60 °C for 30 sec for nirS). At the end of real-time PCR, a melting curve consisting of measurements of SYBR Green signal intensities from 60 to 95 °C at 0.4 °C increments every 10 sec was performed as a final step. The corresponding plot of change in fluorescence versus temperature showed a single peak for every amplicon at its specific melting temperature. For each set of primers, calibration curves were obtained from standard DNA prepared from pMD18-T plasmids (TaKaRa) containing the cloned target sequences. The plasmid DNA concentration was quantified using a NanoDrop 2000 spectrophotometer (NanoDrop Technologies). The copy number of standard plasmids was calculated according to the plasmid size and insert lengths, with the assumption of a molecular mass of 660 Da per base pair. Stock solutions of standard DNA were prepared at a concentration of 109 copies of plasmid μL−1. For the calibration curves, DNA standards ranging from 109 to 101 target gene copies μL−1 were prepared by diluting the stock solutions. All standard curves were linear (R2 > 0.99) over 9 orders of magnitude (109 to 101 μL−1) of gene copy number. Every sample was run in triplicate, and each experiment was repeated at least twice. In every run, accuracy in detecting the target gene in the soil samples was confirmed by comparing the melting curves and the qPCR products with the ones obtained from DNA extracted from model organisms (positive control) to avoid false detection in the environmental samples.
Date analysis
N2O emissions were calculated based on the increase of N2O over the three samples collected within the 20-min interval (Hutchinson and Mosier, Citation1981). The concentrations of N2O followed a linear relationship with time. Daily emissions were then calculated based on the hourly fluxes, assuming that the fluxes measured represented the average hourly flux of the day. Cumulative emissions were calculated by integrating the measured daily fluxes for the whole experiment. Analysis of variance was performed using SPSS 19.0 (IBM SPSS Inc., Armonk, NY, USA) to test the significance of treatment effects. Standard errors of the mean were calculated and presented in the graphs. The graphs were created in Origin 9.0 (OriginLab Corporation, Northampton, MA, USA).
Results and Discussion
N2O emission from biochar-amended soil
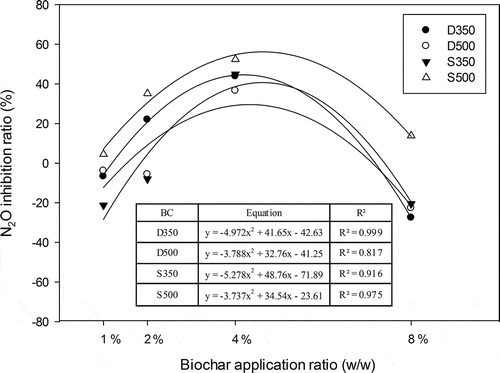
N2O emission patterns and temporal trends for the different treatments were similar (). N2O fluxes varied from <1 μg N kg−1 to peaks of around 50–175 μg N kg−1 after biochar applications. The emission peaked within 7 days of biochar application and subsequently without N2O emission. The cumulative emission kept constant level. We calculated the N2O inhibition ratio from different treatments at stable emission stage (after 30 days). The results showed that the effects of biochar on N2O emission depended on the biochar application rate in soil. Data significantly fitted to a quadratic polynomial regression and showed a typical inverted U-shaped curve with increased doses of biochar, which is agreement with hormesis (). Maximum inhibition was reached at 4% (w/w) biochar. Compared with control treatment, the N2O fluxes were reduced by 36–52% due to the 4% addition of the biochars. In particular S500 treatment, the N2O flux inhibition ratio was significantly higher (4.52 ± 1.5%, 35.19 ± 2.3%, 52.32 ± 4.2%, and 13.87 ± 2.2% in 1%, 2%, 4%, and 8% biochar amended in soil, respectively) than those in other treatments. For the biochar derived from straw, the N2O flux was significantly lower in high pyrolysis temperature (S500) than low pyrolysis temperature (S350) after 30 days of incubation. However, the biochar derived from dairy manure was opposite. Hormesis is characterized by nonmonotonic dose-response that is biphasic, displaying opposite effects at low and high doses. In recent year, the hormesis caused by biochar was reported. However, the mechanisms that result in a U-shaped dose-response curve to biochar are yet poorly understood. One possibility is that biochars contain varying types and amounts of organic compounds that can be biotoxicity at certain levels (Jaiswal et al., Citation2014).
Figure 1. Cumulative N2O emissions (mg N g−1 soil) from the different treatments after 30 days. Error bars indicate standard deviations (n = 3). (a) D350; (b), D500; (c), S350; (d), S500. D = dairy manure–derived biochar; S = straw-derived biochar; 350 and 500 = pyrolysis temperatures.
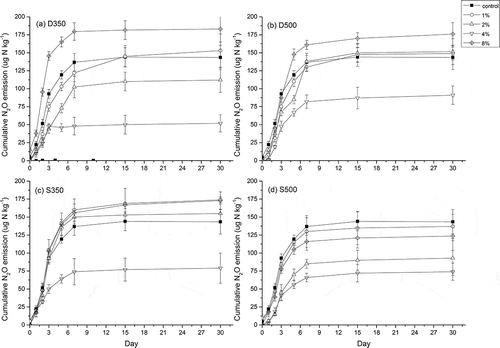
Figure 2. N2O emission inhibition ratios for the different biochar doses. D = dairy manure–derived biochar; S = straw-derived biochar; 350 and 500 = pyrolysis temperatures.
Bacterial community analysis
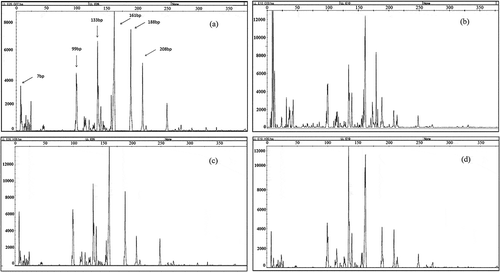
Molecular fingerprinting analyses (T-RFLP) of 16S rRNA gene fragments were performed to compare the community composition of soil bacteria in biochar-amended with that in nonamended (control) soils. shows the T-RFLP profiles of the samples representing the samples with different application rates of biochar. Each peak on the profile corresponded to anonymous taxa referred to as an OTU (operational taxanomic unit), and the peak area corresponded to the proportion of this OTU in the bacterial community. Such a peak may be complex and correspond to several bacterial species. However, regardless of their anonymity and complexity, the T-RFLP profiles provided a convenient integrated means for detecting changes in microbial communities. shows that samples significantly differed in the profiles of bacterial communities, and that the bacterial communities contained a certain proportion of peaks common to all samples. However, a smaller peak area was observed in the samples from soils receiving a biochar 4% application rate.
Figure 3. T-RFLP profiles of the bacterial communities by MspI corresponding to samples S350 with different rates of application biochar. (a) Control; (b) 1S350; (c) 4S350; (d) 8S350. Numbers 1, 4, and 8 indicate the biochar concentration in the treatment. S = straw-derived biochar; 350 = pyrolysis temperature.
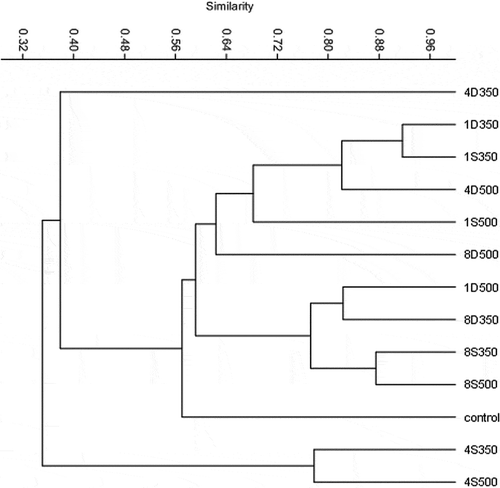
Clustering of T-RFs digested with MspI showed two distinct statistically significant (P < 0.01) soil clusters, demonstrating a strong effect of biochar on the bacterial community composition. shows the cluster analysis results using MspI. Paddy soil T-RF clusters were characterized by the presence of separate, statistically significant (P < 0.01) subclusters representing biochar-amended soils in one cluster and control (nonamended) samples alone in another (). The major bacterial communities formed four distinct clusters depending on the biochar application rate, i.e., 4D350, 4S350 + 4S500, control, and others. Compared with the control, the difference in bacterial communities in soils amended at the rate 4% application rate was greater than that in 1% or 8% biochar. These figures showed that significant changes existed in the bacterial community composition after adding 4% biochar. However, little difference was observed in the bacterial community after adding 1% and 8% biochar. These results showed that the effect of biochar on soil microbial community is not a linear relationship. Bartell (Citation2000) noted that ecosystem-level hormesis could involve key ecological processes such as nutrient cycling, usage of energy inputs, and stability. He argued that hormesis may well be occurring at the ecosystem level (Chapman, Citation2001).
Figure 4. Effect of biochar on the bacterial community composition of paddy soil the cluster analysis of T-RFLP patterns generated by MspI digestion of partial 16S rRNA gene sequences. The dendrogram shows triplicate replicates of soil samples from each treatment. UPGMA clustering analysis based on Jaccard similarity was performed using the ecology statistics freeware package PAST, version 2.15. Numbers 1, 4, and 8 indicate the biochar concentration in the treatment. D = dairy manure–derived biochar; S = straw-derived biochar; 350 and 500 = pyrolysis temperatures.
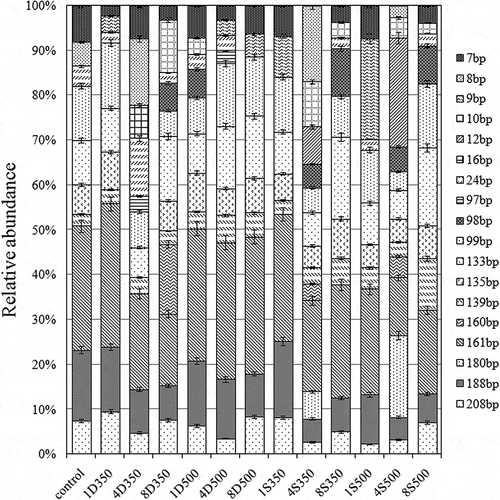
The relative abundances of bacterial community members were estimated by T-RFLP analyses. In the T-RFLP profiles, 208, 188, 161, 139, 135, 133, 99, and 7 bp were detected as major peaks (relative abundance >3%) (). This finding indicated that these fragments were dominant populations. The values 208, 188, and 161 bp were less than the control in all biochar samples. Up to 4% biochar was also reduced in 161 bp. Based on alignment online analyses of fragments, different terminal restriction fragments were assigned to different bacterial lineages as follows: 208 bp to Planctomyces, 188 bp to Lactobacillus, 161 bp to Bacillus marismortui str., Corynebacterium genitalium, Desulfomicro biumbaculatum str., and Hongiakoreensis str. fragments (https://secure.limnology.wisc.edu/trflp/index.jsp). These bacteria included AOB and NOB. The abundance in base pairs of each terminal restriction fragment is shown in .
Figure 5. Effect of biochar application in soil on T-RFLP profiles. The terminal restriction fragments generated after MspI digestion of 16S rRNA gene PCR products. Numbers 1, 4, and 8 indicate the biochar concentration in the treatment. D = dairy manure–derived biochar; S = straw-derived biochar; 350 and 500 = pyrolysis temperatures.
Quantitative analysis of amoA and nirS genes
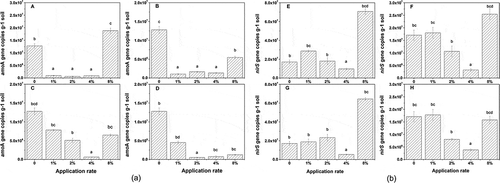
shows the effect of different biochar application rate on the AOB and NOB population abundance in terms of the amoA and nirS copy number per gram soil. These effects were application rate dependent. As seen in , the amoA copy numbers in biochar-amended soils were lower than those in the controls except for 8% biochar addition (D350). For nirS copy number, there were significantly inhibition in 4% all biochar and 2% biochar from straw (S350 and S500), whereas the other had no significantly inhibition. In contrast, the nirS copy number increased significantly in 8% biochar addition except S500 sample (). In all treatments, 4% biochar application had the most significant effect in reducing the amoA and nirS copy numbers. Compared with control, the reductions of amoA and nirS copy numbers by biochar were 93˜98.1% and 43.1˜81.5%, respectively. The suppression of amoA gene was greater than those of nirS gene. Reduced amoA and nirS copy numbers coincided with decreased N2O emissions. There is significant exponential relationship between the daily N2O emission and the AOB amoA gene copy numbers (Dai et al., 2012). Polycyclic aromatic hydrocarbons (PAHs) seem a dominant factor for the reduced N2O emission because biochar may retain PAHs, which could have bactericidal properties. These results may partly interpret the inhibition of N2O emission by biochar (Wang et al., Citation2013).
Figure 6. Effect of the rate of biochar incorporation on the copy numbers of amoA and nirS genes. Data are means ± SE; n = 3. Different letters indicate significant differences (P < 0.05) between treatments. (a) amoA: A, D350; B, S350; C, D500; D, S500. (b) nirS: E, D350; F, S350; G, D500; H, S500. The numbers indicate the biochar concentration in the treatment. D = dairy manure–derived biochar; S = straw-derived biochar; 350 and 500 = pyrolysis temperatures.
pH of soil with biochar
Similar to burned plant residues, biochar can contain various concentrations of ash alkalinity directly added to the soil as Ca, Mg, K, and Na oxides, as well as hydroxides and carbonates (). This soluble form of ash alkalinity in biochar can be rapidly released into soil and be leached down the soil profile to alter soil pH. shows that the pH values of biochar were significantly higher than those of the paddy soil (7.05) before incubation. The lowest pH value was 9.50 in S350. After these biochars were added to soil and incubated for 12 months, the maximum pH value of the amended soil increased to 7.59, 7.61, 7.93, and 7.68 in D350, D500, S350, and S500 samples at the highest application rate (8%), which was consistent with the report of increased pH in short-term incubation (). This result may have been due to the oxidation of the biochar surface over time, which creates more carboxylic groups (Cheng et al., Citation2006). Soil pH strongly affects the activities of microbial communities and the biogeochemical processes that they mediate. Evidence shows that the growth and activity of bacterial ammonia oxidizers decrease at low pH (Nicol et al., Citation2008).
Table 3. Soil pH of biochar applied to paddy soil after 1 year, mean of three replicates (n = 3)
N2O emissions reportedly decrease with biochar application to soil, but not consistently. The mechanisms underlying the effect of biochar on the soil nitrogen cycle remain unclear. Nitrification and denitrification are responsible for N2O emission and N availability for agricultural productivity. Our results in the laboratory experiment showed that biochar application to soil reduced the copy number of amoA and nirS, the genes involved in nitrification and denitrification, and therefore alleviated N2O emission caused by nitrification and denitrification. These effects depended on the biochar application rate. An optimal level of biochar incorporation in soil, beyond which the effects may be less pronounced, existed. The 4% rate of SBC and DBC biochar application resulted in the maximum inhibition in terms of the ammonia monooxygenase gene amoA and the nitrite reductase gene nirS. It is possibly because some chemical and physical properties of the soil were modified by biochar application. Apart from pH, direct effects of ethylene (C2H2) may also provide an explanation, although this aspect has not yet been specifically investigated. Ethylene generated by fresh biochars may be linked to decreased N2O production (Spokas and Reicosky, Citation2009). Klemedtsson et al. (Citation1988) reported that a low concentration of C2H2 can selectively inhibit N2O formation by autotrophic nitrifiers. The more important implication of our findings was the potential utilization of biochar as a nitrification inhibitor analogous to the use of calcium carbide (Kashif et al., Citation2007; Spokas et al., Citation2010), which reduces AOB and NOB. However, the use of biochar as a nitrification inhibitor still requires further investigations (Spokas et al., Citation2010). We are not suggesting that reduction of amoA and nirS copy numbers and the application rate of biochar in soil are the sole mechanisms for alleviating N2O emission. However, this may explain some of the contrasting effects that have been observed in microbial responses to biochar amendments, particularly to activities in the soil nitrogen cycle.
Conclusion
Biochar can alter the rates of N cycling in soil systems by influencing nitrification and denitrification, which are both potential sources of the greenhouse gas nitrous oxide (N2O) in soil. However, limited information is available on the mechanisms behind the change in N2O dynamics. Biochar can potentially reduce N2O emission in soil by affecting ammonia- and nitrite-oxidizing bacteria and these effects depended on the biochar application rate in soil. A quadratic effect of biochar levels was observed on the N2O emissions. Reduced N2O emissions coincided with decreased amoA and nirS copy numbers. The more underlying mechanisms need further studies.
Acknowledgment
The authors thank the Instrumental Analysis Center of Shanghai Jiao Tong University for material characterization and qPCR.
Funding
This study was supported by National Science & Technology pillar program (2012BAD15B03), Science and Technology Commission of Shanghai Municipality Shanghai (13dz1913500), the special fund for Science and Technology Innovation of Shanghai Jiao Tong University, Project 2010, and General Administration of Quality Supervision, Inspection and Quarantine (GAQSIQ) Public Benefit Research Foundation (no. 201310269).
Additional information
Notes on contributors
Liang Liu
Liang Liu and Ping Chen are doctoral students in the School of Agriculture and Biology, Shanghai Jiao Tong University, Shanghai, P.R. China.
Guoqing Shen
Guoqing Shen is a professor in the Department of Environment and Resource, School of Agriculture and Biology, Shanghai Jiao Tong University, Shanghai, P. R. China.
Mingxing Sun
Mingxing Sun is a professor of Shanghai Entry-Exit Inspection and Quarantine Bureau, Shanghai, P.R. China.
Xinde Cao
Xinde Cao is a professor and Guofeng Shang is a doctoral student in the School of Environmental Science and Engineering, Shanghai Jiao Tong University, Shanghai, P.R. China.
Related Research Data
References
- Adman, E.T., J.W. Godden, and S. Turley. 1995. The structure of copper nitrite reductase from Achromobacter cycloclastes at five pH values, with NO2– bound and with type II copper depleted. J. Biol. Chem. 270:27458–27474. doi:10.1074/jbc.270.46.27458
- American Society for Testing and Materials. 2000. Annual Book of ASTM Standards, Soil and Rock. West Conshohocken, PA: American Society for Testing and Materials.
- Bailey, V.L., S.J. Fansler, J.L. Smith, and J.H. Bolton. 2010. Reconciling apparent variability in effects of biochar amendment on soil enzyme activities by assay optimization. Soil Biol. Biochem. 43:296−301. doi:10.1016/j.soilbio.2010.10.014
- Bartell, S.M. 2000. Are ecosystems hormetic? Hum. Ecol. Risk Assess. 6: 237–243. doi:10.1080/10807030009380059
- Braker, G., A. Fesefeldt, and K.P. Witzel. 1998. Development of PCR primer systems for amplification of nitrite reductase genes (nirK and nirS) to detect denitrifying bacteria in environmental samples. Appl. Environ. Microbiol. 64:3769−3775.
- Chapman, P.M. 2001. The implications of hormesis to ecotoxicology and ecological risk assessment. Hum. Exp. Toxicol. 20:499−505. doi:10.1191/096032701718120337
- Cheng, C.H., L. Lehmann, J.E. Thies, S.D. Burton, and M.H. Engelhard. 2006. Oxidation of black carbon through biotic and abiotic processes. Org. Geochem. 37:1477−1488. doi:10.1016/j.orggeochem.2006.06.022
- Clough, T.J., and L.M. Condron. 2010. Biochar and the nitrogen cycle: Introduction. J. Environ. Qual. 39:1218. doi:10.2134/jeq2010.0204
- Dai, Y., H.J. Di, K.C. Cameron, and J.Z. He. 2013. Effects of nitrogen application rate and a nitrification inhibitor dicyandiamide on ammonia oxidizers and N2O emissions in a grazed pasture soil. Sci. Total Environ. 465:125–135. doi:10.1016/j.scitotenv.2012.08.091
- Davidson, E.A., W.T. Swank, and T.O. Perry. 1986. Distinguishing between nitrification and denitrification as sources of gaseous nitrogen production in soil. Appl. Environ. Microbiol. 52:1280–1286.
- Di, H.J., K.C. Cameron, R.R. Sherlock, J.P. Shen, J.Z. He, and C.S. Winefield. 2010. Nitrous oxide emissions from grazed grassland as affected by a nitrification inhibitor, dicyandiamide, and relationships with ammonia-oxidizing bacteria and archaea. J. Soils Sediments 10:943–954. doi:10.1007/s11368-009-0174-x
- Egert, M., and M.W. Friedrich. 2003. Formation of pseudo-terminal restriction fragments, a PCR-related bias affecting terminal restriction fragment length polymorphism analysis of microbial community structure. Appl. Environ. Microbiol. 69:2555–2562. doi:10.1128/AEM.69.5.2555-2562.2003
- Francis, C.A., K.J. Roberts, J.M. Beman, A.E. Santoro, and B.B. Oakley. 2005. Ubiquity and diversity of ammonia-oxidizing archaea in water columns and sediments of the ocean. Proc. Natl. Acad. Sci. U. S. A. 102:14683–14688. doi:10.1073/pnas.0506625102
- Gani, S.A., D.C. Mukherjee, and D.K. Chattoraj. 1999. Adsorption of biopolymer at solid liquid interfaces. 1. Affinities of DNA to hydrophobic and hydrophilic solid surfaces. Langmuir 15:7130–7138. doi:10.1021/la970686h
- Hammer, O., D. Harper, and P. Ryan. 2001. PAST: Paleontological statistics software package for education and data analysis. Paleontol. Electron. 4:9.
- Heid, C.A., J. Stevens, K.J. Livak, and P.M. Williams. 1996. Real time quantitative PCR. Genome Res. 6:986–994. doi:10.1101/gr.6.10.986
- Hutchinson, G.L., and A.R. Mosier. 1981. Improved soil cover method for field measurement of nitrous oxide fluxes. Soil Sci. Soc. Am. J. 45:311–316. doi:10.2136/sssaj1981.03615995004500020017x
- Jaiswal, A.K., Y. Elad, E.R. Graber, and O. Frenkel. 2014. Rhizoctonia solani suppression and plant growth promotion in cucumber as affected by biochar pyrolysis temperature, feedstock and concentration. Soil Biol. Biochem. 69:110−118. doi:10.1016/j.soilbio.2013.10.051
- Jin, H. 2010. Characterization of microbial life colonizing biochar and biochar amended soils. Ph.D. dissertation, Cornell University, Ithaca, New York.
- Kashif, S.R., M. Yaseen, M. Arshad, and M. Abbas. 2007. Evaluation of calcium carbide as a soil amendment to improve nitrogen economy of soil and yield of okra. Soil Environ. 26:69–74.
- Klemedtsson, L., B.H. Svensson, and T. Rosswall. 1988. A method of selective inhibition to distinguish between nitrification and denitrification as sources of nitrous oxide in soil. Biol. Fertil. Soils 6:112–119. doi:10.1007/BF00257659
- Klotz, M.G., J. Alzerreca, and J.M. Norton. 1997. A gene encoding a membrane protein exists upstream of the amoA/amoB genes in ammonia-oxidizing bacteria; a third member of the amo operon? FEMS Microbiol. Lett. 150:65–73. doi:10.1111/j.1574-6968.1997.tb10351.x
- Lehmann, J., and S. Joseph. 2009. Biochar for environmental management: An introduction. In Biochar for Environmental Management: Science and Technology, ed. J. Lehman and S. Joseph, 1–10. London: Earthscan.
- Liu, W.T., T.L. Marsh, H. Cheng, and L.J. Forney. 1997. Characterization of microbial diversity by determining terminal restriction fragment length polymorphisms of genes encoding16S rRNA. Appl. Environ. Microbiol. 63:4516–4522.
- Manyà, J.J. 2012. Pyrolysis for biochar purposes: A review to establish current knowledge gaps and research needs. Environ. Sci. Technol. 46:7939–7954. doi:10.1021/es301029g
- Max, K., M.K. Yael, P. Zohar, R.G. Ellen, E. Yigal, and C. Eddie. 2011. Impact of biochar application to soil on the root-associated bacterial community structure of fully developed greenhouse pepper plants. Appl. Environ. Microbiol. 77:4924–4930.
- Miller, R.H., and D.R. Keeney ( eds.). 1982. Methods of Soil Analysis, Part 2: Chemical and Microbiological Properties, Vol. 9, 539–577. Madison, WI: American Society of Agronomy.
- Mukome, F.N.D., J. Six, and S.J. Parikh. 2013. The effects of walnut shell and wood feedstock biochar amendments on greenhouse gas emissions from a fertile soil. Geoderma 200–201:90–98. doi:10.1016/j.geoderma.2013.02.004
- Nicol, G.W., S. Leininger, C. Schleper, and J.I. Prosser. 2008. The influence of soil pH on the diversity, abundance and transcriptional activity of ammonia oxidizing archaea and bacteria. Environ. Microbiol. 10:2966–2978. doi:10.1111/j.1462-2920.2008.01701.x
- Okano, Y., K.R. Hristova, C.M. Leutenegger, L.E. Jackson, R.F. Denison, B. Gebreyesus, D. Lebauer, and K.M. Scow. 2004. Application of real-time PCR to study effects of ammoniumon population size of ammoniaoxidizing bacteria in soil. Appl. Environ. Microbiol. 70:1008–1016. doi:10.1128/AEM.70.2.1008-1016.2004
- Park, H.D., G.F. Wells. H. Bae, C.S. Criddle, and C.A. Francis. 2006. Occurrence of ammonia-oxidizing Archaea in wastewater treatment plant bioreactors. Appl. Environ. Microbiol. 72:5643–5647. doi:10.1128/AEM.00402-06
- Quilliam, R.S., K. Marsden, C. Gertler, J. Rousk, T.H. DeLuca, and D.L. Jones. 2012. Nutrient dynamics, microbial growth and weed emergence in biochar amended soil are influenced by time since application and reapplication rate. Agric. Ecosys. Environ. 158:192–199. doi:10.1016/j.agee.2012.06.011
- Rotthauwe, J.H., K.P. Witzel, and W. Liesack. 1997. The ammonia monooxygenase structural gene amoA as a functional marker: Molecular fine-scale analysis of natural ammonia-oxidizing populations. Appl. Environ. Microbiol. 63:4704–4712.
- Sarkhot, D.V., A.A. Berhe, and T.A. Ghezzehei. 2012. Impact of biochar enriched with dairy manure effluent on carbon and nitrogen dynamics. J. Environ. Qual. 41:1107−1114. doi:10.2134/jeq2011.0123
- Singh, B.K., and A. Walker. 2006. Microbial degradation of organophosphorus compounds. FEMS Microbiol. Ecol. 30:428–471. doi:10.1111/j.1574-6976.2006.00018.x
- Spokas, K.A., J.M. Baker, and D.C. Reicosky. 2010. Ethylene: Potential key for biochar amendment impacts. Plant Soil 333:443−452. doi:10.1007/s11104-010-0359-5
- Spokas, K.A., and D.C. Reicosky. 2009. Impacts of sixteen different biochars on soil greenhouse gas production. Ann. Environ. Sci. 3:179–3193.
- U.S. Environmental Protection Agency. 1986. Test Methods for Evaluating Solid Waste. Laboratory Manual Physical/Chemical Methods. Washington, DC: U.S. Government Printing Office.
- Wang, Z.Y., H. Zheng, Y. Luo, X. Deng, S. Herbert, and B.S. Xing. 2013. Characterization and influence of biochars on nitrous oxide emission from agricultural soil. Environ. Pollut. 174:289–296. doi:10.1016/j.envpol.2012.12.003
- Williams, P.A., V. Fulop. E.F. Garman, N.F.W. Saunders, S.J. Ferguson, and J. Hajdu. 1997. Haem-ligand switching during catalysis in crystals of a nitrogen-cycle enzyme. Nature 389:406–412. doi:10.1038/38775
- Wrage, N., G.L. Velthof, and M.L. Van Beusichem. 2001. Role of nitrifier denitrification in the production of nitrous oxide. Soil Biol. Biochem. 33:1723–1732. doi:10.1016/S0038-0717(01)00096-7
- Yanai, Y., K. Toyota, and M. Okazaki. 2007. Effects of charcoal addition on N2O emissions from soil resulting from rewetting air-dried soil in short term laboratory experiments. Soil Sci. Plant Nutr. 53:181–188. doi:10.1111/j.1747-0765.2007.00123.x
- Ye, R.W., B.A. Averill, and J.M. Tiedje. 1994. Denitrification: Production and consumption of nitric oxide. Appl. Environ. Microbiol. 60:1053–1058.
- Yu, C., R. Ahuja. G. Sayler, and K.H. Chu. 2005. Quantitative molecular assay for fingerprinting microbial communities of wastewater and estrogen degrading consortia. Appl. Environ. Microbiol. 71:1433–1444. doi:10.1128/AEM.71.3.1433-1444.2005
- Zhang, A., L. Cui, G. Pan, L. Li, Q. Hussain, X. Zhang, J. Zheng, and D. Crowley. 2010. Effect of biochar amendment on yield and methane and nitrous oxide emissions from a rice paddy from Tai Lake plain, China. Agric. Ecosyst. Environ. 139:469–475. doi:10.1016/j.agee.2010.09.003