
Abstract
Under the National Ambient Air Quality Standards (NAAQS), put in place as a result of the Clean Air Amendments of 1990, three regions in the state of Utah are in violation of the NAAQS for PM10 and PM2.5 (Salt Lake County, Ogden City, and Utah County). These regions are susceptible to strong inversions that can persist for days to weeks. This meteorology, coupled with the metropolitan nature of these regions, contributes to its violation of the NAAQS for PM during the winter. During January–February 2009, 1-hr averaged concentrations of PM10-2.5, PM2.5, NOx, NO2, NO, O3, CO, and NH3 were measured. Particulate-phase nitrate, nitrite, and sulfate and gas-phase HONO, HNO3, and SO2 were also measured on a 1-hr average basis. The results indicate that ammonium nitrate averages 40% of the total PM2.5 mass in the absence of inversions and up to 69% during strong inversions. Also, the formation of ammonium nitrate is nitric acid limited. Overall, the lower boundary layer in the Salt Lake Valley appears to be oxidant and volatile organic carbon (VOC) limited with respect to ozone formation. The most effective way to reduce ammonium nitrate secondary particle formation during the inversions period is to reduce NOx emissions. However, a decrease in NOx will increase ozone concentrations. A better definition of the complete ozone isopleths would better inform this decision.
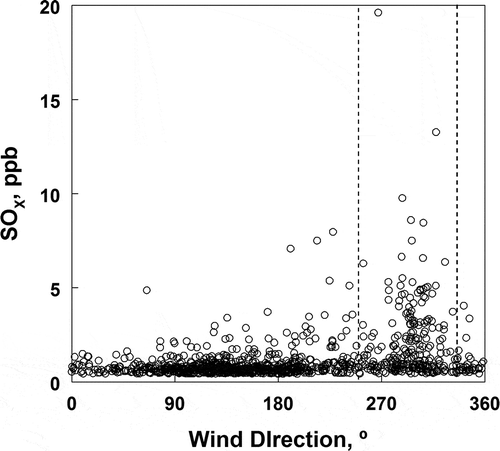
Implications: Monitoring of air pollution constituents in Salt Lake City, UT, during periods in which PM2.5 concentrations exceeded the NAAQS, reveals that secondary aerosol formation for this region is NOx limited. Therefore, NOx emissions should be targeted in order to reduce secondary particle formation and PM2.5. Data also indicate that the highest concentrations of sulfur dioxide are associated with winds from the north-northwest, the location of several small refineries.
Introduction
Under the National Ambient Air Quality Standards put in place as a result of the Clean Air Amendments of 1990, three regions in the state of Utah, Salt Lake County, Ogden City, and Utah County, are in violation of the 24-hr National Ambient Air Quality Standard (NAAQS) for PM10 and PM2.5. The valleys in which these regions are located are susceptible to strong winter inversions that can persist for days to weeks. The strong inversions coupled with the metropolitan nature of this region (Salt Lake Valley population 1.2 million) contribute to its violation of the NAAQS for PM during the winter. These meteorological conditions and the metropolitan nature of these regions have existed for decades. However, the maximum concentrations seen during inversions has decreased in response to air pollution control measures of the past, but the improvements have not been sufficient to put these regions into attainment. High concentrations of fine particulate matter are generally associated with inversions. In general, fine particulate matter and anthropogenic pollutant gases are dominated by local emissions and not by transport from other regions. High concentrations of coarse particulate matter are sometimes observed due to transport of crustal material associated with high winds; however, these conditions were not important during the current study.
The Hawthorne Elementary School sampling site (AQS Station Code 490353006) located in Salt Lake City, UT, has been designated as one of 55 urban, long-term, nationwide multipollutant NCore sites (U.S. Environmental Protection Agency [EPA], Citation2010). The NCore network is designed to enhance existing monitoring capabilities in an effort to produce an integrated multi-pollutant approach to air quality monitoring. In addition to collecting information on criteria pollutants, NOX, O3, CO, and PM, emphasis has been placed on measuring noncriteria pollutants, specifically NH3 and HNO3 because of their importance in secondary PM formation. These species are measured in an effort to improve emission control strategies as well as to obtain more complete information for scientific, public health, and ecosystem assessments.
Characterization of the PM2.5 mass on a semicontinuous basis and the 3-hr average determination of PM2.5 mass and components have been previously studied at the Hawthorne site (Long et al., Citation2003, Long, Modey, et al., Citation2005). These studies were directed toward the understanding of fine particulate health effects and source characterization (Long, Modey, et al., Citation2005; Pope et al., Citation2004). These previous air sampling campaigns have shown that a major component of PM in the Salt Lake Valley during the winter is ammonium nitrate (NH4NO3). Ammonium nitrate is primarily formed from gas-phase ammonia and nitric acid via reaction (1):
Materials and Methods
Samples were collected at the Hawthorne Elementary School air quality monitoring site from January 3 through February 25, 2009. One-hour averaged concentrations of PM10-2.5, PM2.5, NOx (NO and NO2), O3, CO, and NH3 were measured. Particulate-phase nitrate, nitrite, and sulfate and gas-phase HONO, HNO3, and SO2 were also measured on a 1-hr average basis. Speciation data was collected for PM2.5, as it is the focus of this paper. PM10-2.5 is given for completeness; however, no speciation data are available on the coarse particle fraction.
One-hour averaged PM10-2.5 and PM2.5 masses were measured using a Thermo Environmental model 1405DF tapered element oscillating microbalance (TEOM) with a Filter Dynamics Measurement System (FDMS). The sampler used firmware version 1.22. The 1405DF sampler incorporates a virtual impactor to separate the sampled air into two fractions, PM2.5 and PM10-2.5. Manual methods collected daily samples for PM10 and PM2.5 using Thermo Environmental model 2025 samplers. Particulate samples were collected every third day for the National Speciation Trends Network using MetOne SASS and URG 3000N samplers. An intensive sampling program was initiated during inversions to collect samples for speciation every other day.
A URG-9000C ambient ion monitor (AIM) provided 1-hr averaged measurements of particulate nitrate, nitrite, and sulfate in PM2.5 and of gas-phase HONO, HNO3, and SO2; this model does not measure cations. We have previously demonstrated the equivalence of hourly ion chromatography data with appropriate integrated data using valid diffusion denuder techniques (Grover et al., Citation2008). The instrument draws in air at a rate of 3 lpm through a PM2.5 sharp-cut cyclone filter. The air is passed through a liquid diffusion denuder, where gases are removed by reaction with a dilute aqueous solution of H2O2 (0.3% in water). The oxidant solution in the denuder is used to convert SO2 to sulfate. Particles are subsequently collected. The air stream after the denuder enters an aerosol supersaturation chamber. Both the gas phase and particles phase are collected for 1 hr and then analyzed with ion chromatography (IC; Dionex ICS-1000). An inertial particle separator collects and dissolves these particles in deionized water and injects them into the ion chromatograph for analysis. The lower limit of detection for both particle- and gas-phase ions is species dependent and approximately 0.05 μg/m3. The AIM instrument was calibrated according to the user manual instructions every 2 weeks with a seven-anion standard purchased from Dionex (P/N 56933). The denuder membrane was changed every 4 weeks.
To avoid sampling artifacts as well as weather interferences, sampling with the AIM was done through a manifold. The manifold was constructed from a 2.44-m-long polyvinyl chloride (PVC) pipe with 15.2 cm diameter. A high-volume air blower was connected to the air pipe and was set so that the air velocity inside the pipe was no more than 5 mph (8 km/hr). A weather cap was attached to the top of the manifold to avoid collection of precipitation and large objects. The sampling manifold was raised about 2 m over the roof of the sampling trailer and at least 0.5 m above the closest sampling intake of other instruments. The sampling line from the manifold to the AIM inlet was a 75-cm-long, Teflon-coated 2.5-cm OD aluminum diameter pipe. This setup is to minimize nitric acid loss in the inlet.
Hourly averaged NOX (NO and NO2), CO, NH3, and O3 concentrations were monitored using U.S. EPA reference designated method analyzers. NOX (NO and NO2) was monitored using a Thermo Environmental model 42C analyzer operated on 0 to 1 ppm range for NO and NOX and 0 to 0.5 ppm range for NO2. This instrument measured NOX and NO and calculated NO2 as the difference. CO was monitored using a Thermo Environmental model 48C operated on 0 to 50 ppm range. NH3 was monitored using a Thermo Environmental model 17C operated on 0 to 100 ppb range. O3 was monitored using a Teledyne API model 400E operated on 0 to 500 ppb range. All instruments were operated following the U.S. EPA Quality Assurance Handbook for Air Pollution Measurement Systems (U.S. EPA, Citation2008).
Meteorology
The Salt Lake Valley sits in the heart of the Intermountain Region and is bordered on the east and west by high mountain ranges (rising to 1850 m above the valley floor) and to the north by the Great Salt Lake. During winter, and under stable high-pressure systems, long nights and occasional snow cover trap cold air at the surface and produce stable valley temperature inversions. Several times each winter, strong ridges of high pressure are situated over northern Utah, producing clear skies, light winds, and weak mixing. Over time, the diurnal valley heat deficit increases and a cold pool forms within the confines of the valley (Whiteman et al., Citation1999). In these cases, the atmosphere is stable through at least 700 mb, but the core of the cold pool, where most pollutants are trapped, ranges from 200 m to 600 m above the valley floor. Cold pools can persist for 1 to 3 weeks and require a strong synoptic-scale weather event to fully disperse pollutants from the valley floor.
Weather during the January and February 2009 sampling period was typical of most winters in the Salt Lake Valley. Occasional storm systems from the southwest and northwest brought heavy mountain snow and moderate amounts of snow to the valley floor. Two significant cold pools formed during the sampling period of January 14–24, 2009, and of January 29 to February 6, 2009, resulting in stable inversions and clear skies on these days.
January 14–24 cold pool
A deep trough over the central United States allowed a strong ridge of high pressure to build west over the Intermountain Region. Between January 16 and 23 the ridge was centered over Utah and produced light winds and cloudless skies. During this time, daily high temperatures on the valley floor (1288 m) at the Salt Lake City International Airport (KSLC) ranged from 2 to 6ºC. Daily low temperatures ranged from –4 to –7ºC. Wind speeds in the cold pool were light and averaged between 3 and 6 km/hr. The last significant snowfall on the valley floor occurred on January 8, but the snow cover melted completely by January 12 and no additional snow fell during the cold pool event. The Salt Lake Valley has significant gradients of elevation and precipitation, so on the eastern bench areas, snow cover likely persisted throughout the cold pool event. The stability of the cold pool was significant. Using the morning and afternoon radiosonde data from KSLC, vertical lapse rates of –12 to –23ºC per 1000 m were measured. The vertical lapse rate gradient of a fully mixed, dry, stable atmosphere is 10ºC per 1000 m. The negative lapse rate is indicative of a strong inversion.
January 29–February 6 cold pool
On January 26 a cold front moved through northern Utah, dropping 8 cm of snow at KSLC. Following the cold front, a ridge of high pressure moved from the west and was centered over Utah on January 30. Temperatures during this cold pool were warmer and ranged from 3 to 12ºC. At KSLC, snow cover melted on February 1, but likely persisted in the eastern Salt Lake Valley. Wind speeds during the core of the cold pool averaged 8 km/hr. Stability, as assessed from KSLC vertical temperature gradients, was weaker than during the first cold pool, but a negative lapse rate of –17ºC per 1000 m was recorded during the morning of February 5.
Results and Discussion
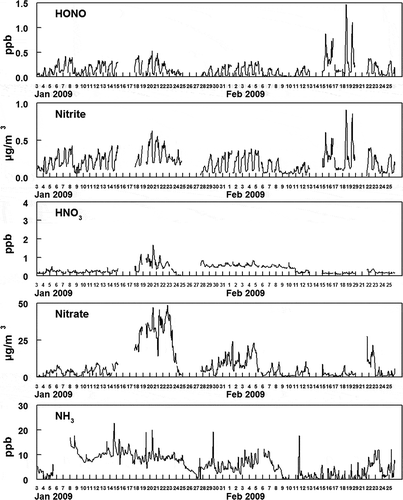
shows the hourly averaged concentrations of PM2.5 and PM10-2.5 and the measured fine particulate anions. The data sets for the PM and gas measurements have four gaps in the URG particle composition data (a total of 10 % of the data is missing) because of instrument malfunction. For PM composition analysis, the assumptions were made (1) that nitrite was present as the sodium salt, (2) that ammonium nitrite was volatile enough that it would not exist in PM, and (3) that the remainder of the anions were present as the ammonium salts. The mass not accounted for by the measured anions is presented as “Missing PM2.5 Mass” in , and consisted mostly of the fine particulate carbonaceous material including elemental carbon (EC) and organic material (OM). EC and OM was measured by the Improve method on 24-hr averaged filters. Measured organic carbon (OC/ was converted to OM using a factor of 1.6. The hourly averaged concentrations of the criteria gas-phase pollutants CO, NOx (NO and NO2), O3, and SO2 are shown in . The hourly averaged concentrations of gas and fine particulate nitrite, nitrate, and gas-phase ammonia are shown in .
Figure 1. Hourly averaged concentrations of PM2.5, PM10-2.5, and fine particulate species at Hawthorne during the study. Missing PM2.5 is calculated as the difference between measured fine particulate mass and the other measured species, assuming sulfate and nitrate are present as ammonium compounds and nitrite is present as the sodium salt. Missing mass is dominantly carbonaceous material.
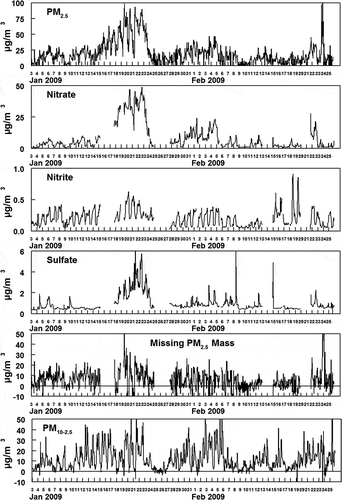
Figure 2. Hourly averaged concentrations of criteria pollutant gas-phase species measured at Hawthorne during the study.
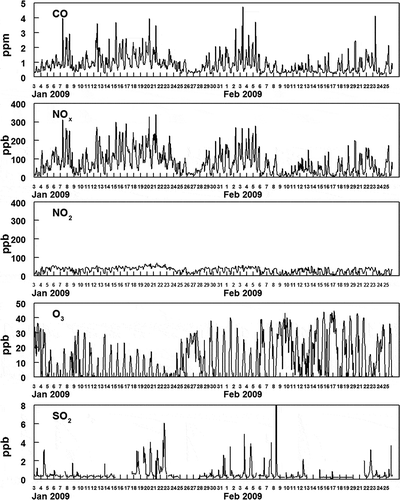
Figure 3. Hourly averaged concentrations of gas- and particulate-phase nitrite and nitrate species and gas-phase ammonia at Hawthorne. The particulate-phase species given in Figure 1 are repeated here to allow comparison with the gas-phase species.
Comparisons of gas-phase species and particulate phase mass and components
Two distinct, persistent inversions occurred during the study. The first inversion began on January 14 and continued through January 24. The second inversion period occurred from January 29 to February 6 (indicated in –). Both inversions were broken by a low-pressure air mass followed by snowfall. On January 24, the frontal passage brought 7 cm of snow along with approximately 0.5 cm of water. A sharp temperature increase (˜4ºC) was observed on February 6. Both episodes were broken by an increase in wind speed (from ˜5 to above 11 km/hr) and change of wind direction from north during the inversion to south at the end. Several other inversions lasting between 2 and 3 days were observed during the study, but none were as intense and persistent as the two already mentioned. Elevated concentrations of PM2.5, nitrate, sulfate (see ), CO, NOx, and SO2 (see ) were observed during the two major inversion events relative to noninversion periods. The concentrations of other species were less affected during the inversion (see –).
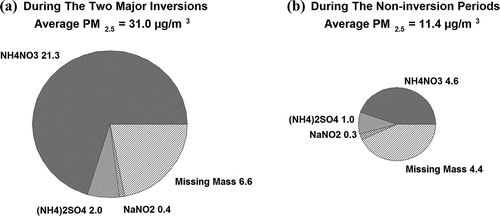
The composition of PM2.5 for (a) the major inversion periods and (b) the remainder of the study are shown in . A high concentration of NH3 prevailed during the sampling campaign (), and therefore it was assumed that nitrate and sulfate were predominately in the form of their ammonium salts. Other inorganic species (e.g., chloride, fluoride, phosphate, etc.) were measured by IC, but these concentrations were usually below the detection limits and none of these species contributed significantly to the fine particulate mass. illustrates that the dominant fine particulate component was ammonium nitrate, averaging 69% of the fine particulate mass during the inversion periods and 40% during the remainder of the study. The next largest contributor to fine particulate matter was the missing mass, averaging 21% during the inversion periods and 39% for the remainder of the study. All fine particulate components have been accounted for (ammonium ion is inferred) except crustal and carbonaceous material. Water is excluded by the FDMS TEOM, which specifically excludes particle-bound water from the measurement (Grimm and Eatough, Citation2009; Hansen et al., Citation2010; Grover et al., Citation2005). The fraction of crustal material in fine particulate matter during the study was small, from 0.1 to 0.5 μg/m3. This was based on 24-hr average measurements of Al and Si in fine particles from the NCore program. Therefore, the missing mass is predominately EC and OM. Furthermore, the calculated missing mass is consistent with the average of 22% EC and OM obtained from four 24-hr quartz filter NCore samples. Since the ratio of EC and OM in the carbonaceous material is unknown, no discussion is included on the diurnal variation in these species.
Figure 4. Average concentrations, μg/m3, of fine particulate species at Hawthorne (a) during the two major inversions and (b) during the remainder of the 2009 winter study.
shows total PM2.5 (nonvolatile plus semivolatile mass) plotted against particulate nitrate and sulfate (both expressed as their ammonium salts) and CO (as a measure of primary emissions). Linear regression analyses for the data shown in are presented in . This analysis indicates that both ammonium nitrate and, to a lesser degree, ammonium sulfate account for much of the increase in fine particulate matter during the inversions. This is further supported by the lack of association between increasing concentrations of CO and fine particulate mass (see ). While CO, a primary pollutant, is higher during the inversion (see ), increases in CO are not correlated with increases in secondary pollutants.
Figure 5. Comparison of PM2.5 vs. fine particulate ammonium nitrate, and ammonium sulfate and gas-phase CO during the Hawthorne 2009 winter study. The dashed line is the 1:1 line for PM2.5 mass. Linear regression results for the data are given in . The fine particulate species are correlated with PM2.5 mass, but CO is not.
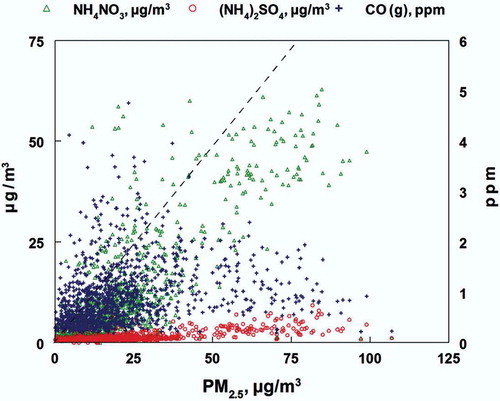
Table 1. Conventional linear regression analysis comparison of PM2.5 mass (μg/m3), or NOX (ppb), and other measured species
The mass fraction of ammonium nitrate in PM2.5 differed between the inversion periods and the less polluted days (). PM during the major inversions averaged 66% ammonium nitrate, whereas on days outside the major inversion periods ammonium nitrate averaged 40% of the PM2.5 mass. Interestingly, the mass fraction of ammonium sulfate slightly decreased during the two major inversion periods when compared to the non-inversion days. The average mass percent ammonium sulfate of total PM2.5, 6.5%, was only one-tenth the mass percent of ammonium nitrate. Even though most of the sulfur oxides were in the particulate phase, the primary source appears not to be associated with a major PM source. Total sulfur oxides (ammonium sulfate plus SO2, on a mole basis) were also not correlated with CO, a marker for primary emission sources (predominantly mobile sources). Factors that may contribute to the formation of nitrate and sulfate are discussed later.
shows the diurnal variations for many of the measured species for January 7 through 23 (a period preceding and during the first major inversion). First, PM2.5 mass had a strong diurnal pattern during the January 14–24 inversion period, with daily maxima occurring in the noon to late evening time periods (). In contrast, the primary emission species CO and NOx have a different pattern (). A strong linear relationship between these two species is illustrated in and . Furthermore, illustrates that CO and NOx both peak in daily concentrations during morning commute hours and evening hours, when smoke from home combustion of wood is significant for this study area (Long, Eatough, et al., Citation2005). Morning NOx and CO peaks decreased during weekends and holidays (e.g., January 19, Martin Luther King Day), and evening peaks showed slight decreases during weekends (). CO and NOX are frequently present in highest concentrations when PM2.5 is at a minimum (). These diurnal trends suggest that PM2.5 is strongly influenced by secondary fine particle formation. This conclusion is also consistent with the data shown in and .
Figure 6. Hourly averaged time sequence of measured species just before and during the January 16–23 inversion. (a) Fine particulate mass and measured components. (b) Measured gas-phase species. (c) Comparison of the secondary species NO2 and O3 with solar radiation. O3 formation is correlated with solar radiation but NO2 formation is not.
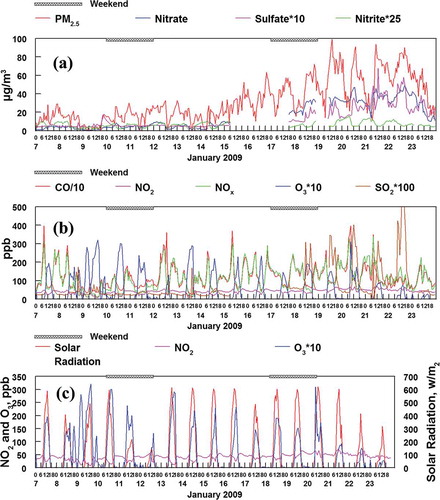
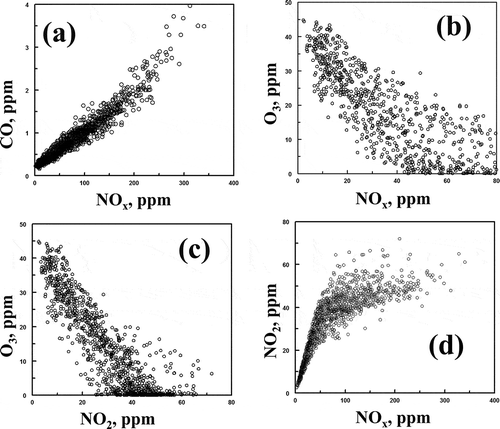
Figure 7. (a) Comparison of hourly averaged concentrations of NOx and CO during the Hawthorne study. See for linear regression comparison of this data. (b) Comparison of hourly averaged concentrations of NOx and O3 during the Hawthorne study. The negative correlation between these two species suggests the formation of ozone is limited by the concentrations of VOCs during the study. (c) Comparison of hourly averaged concentrations of NO2 and O3 during the Hawthorne study. The negative correlation between these two species suggests the formation of ozone is limited by the concentrations of VOCs during the study. (d) Comparison of hourly averaged concentrations of NOx and NO2 during the Hawthorne study. The tailing off of NO2 concentrations at high NOx concentrations suggests the atmosphere is oxidant limited during the study. The dashed line has a slope of 1.
shows that particulate nitrite had a very strong diurnal variation with highest concentrations during the night and lower concentrations during the day (). This pattern can be attributed to the nighttime formation of nitrite from primary NOX emissions and absence of solar radiation-initiated oxidative chemistry (Finlayson-Pitts, Citation2000). Finally, ozone also showed a marked diurnal pattern with midday maxima, and was highly correlated with solar radiation (). However, another gas which is primarily secondary, NO2, was not correlated with solar radiation. This chemistry is further explored in the next section.
Nitrogen oxide chemistry
The majority of primary nitrogen oxides are emitted from combustion sources in the form of NO(g) (Finlayson-Pitts, Citation2000). In the presence of ozone, HO2. or RO2., NO is oxidized to NO2 via the following:
Ozone is formed by the photolysis of NO2; OH is formed by the photolysis of O3 followed by the reaction of O1D with H2O; and HO2 and RO2 are formed from the reaction(s) of OH (and at night NO3) radical(s) with gas=phase volatile organic compounds (VOCs). Thus, the relative concentrations of NOX and VOCs control the concentration of ozone in a complex manner described by an ozone isopleth (Finlayson-Pitts, Citation2000). In general, at low NOX concentrations the concentrations of ozone is not significantly influenced by the concentration of VOCs and the system is NOX limited. However, at low VOC concentrations, O3 concentrations can decrease with increasing NOX, as NO reacts with O3, and NO2 competes with VOC for the OH radical by the irreversible formation of nitric acid:
Nitric acid may also be formed at night through the NO3 radical. However, since O3 and NO2 do not coexist at night (), this pathway will not be important. An analysis of the NOx and O3 data was carried out using the method described by Clapp and Jenkin (Citation2001). shows the oxidant concentration, [NO2] + [O3] (defined as OX), plotted against the NOx mixing ratio (NOx = NO + NO2) for daylight hours.
Figure 8. Variation of OX mixing ratios (OX = NO2 + O3) as a function of NOx (NOx = NO + NO2) during daylight hours.
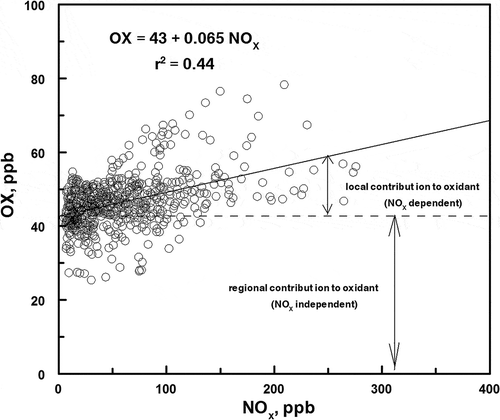
The intercept of the best fit line through the data represents the regional contribution to the oxidant concentration. The difference between the intercept and the measured OX concentration represents the local contribution to the oxidant concentration. The regional contribution to the oxidant concentration is calculated to be 43 ppb. Comparison of the best fit line through the data to the analysis of Clapp and Jenkin (Citation2001) of airmass in the United Kingdom shows a large amount of scatter in this data. The relatively large amount of scatter in may be due to scavenging of NO2 by OH radical to produce HNO3 instead of O3. As shown in and , production of ammonium nitrate was particularly significant during inversions.
It is worthwhile to note the assumption that all nitrogen oxides are of local origin and that ozone production above the background is due to local chemistry and not advection of either nitrogen oxides or ozone from transported sources. This is true due to the stable nature of the inversions studied that result in little ventilation between layers.
During the study, hourly ozone concentrations peaked at 45 ppb (well within U.S. EPA regulations, as expected for a winter study). The highest ozone concentrations did not occur during the two major inversions, but peaked between inversions. The diurnal variation of ozone was generally characterized by a sharp increase in ozone concentration beginning at 7 a.m., peaking at 2 p.m., followed by a sharp decline below the limit of detection of the instrument in the next 4 to 5 hr, with a very strong correlation, as expected, between O3 and solar radiation (). The relationships of NOX to O3 and NO2 to O3 are shown in and , respectively. The inverse relationships shown in and suggests ozone scavenging by NO and competition of the NO2 molecule for the OH radical, thus limiting the formation of ozone. The sharp downward trend in the O3/NOX and O3/NO2 relationships indicates an oxidant limited air mass with VOC concentrations low, relative to NOx (Finlayson-Pitts, Citation2000). This conclusion is further strengthened by , showing NO2 plotted against NOx. Upward of 90% of NOx is NO2 at concentrations below 40 ppb. The linearity of the data deteriorates at concentrations of NOx above 40 ppb. At 100 ppb of NOX and higher, the relative NO2 concentrations seldom exceeded 40–60 ppb, indicative of the lack of oxidant species necessary to convert NO to NO2. This deficiency can also be explained by low VOC concentrations. Although VOCs were not measured directly, it can be assumed that they were relatively low due to the decrease of the ozone concentration with the increase of NOX, signifying the lack of RO2 radicals and the use of ozone to convert NO to NO2. Obtaining VOC data to supplement the data given here would be valuable.
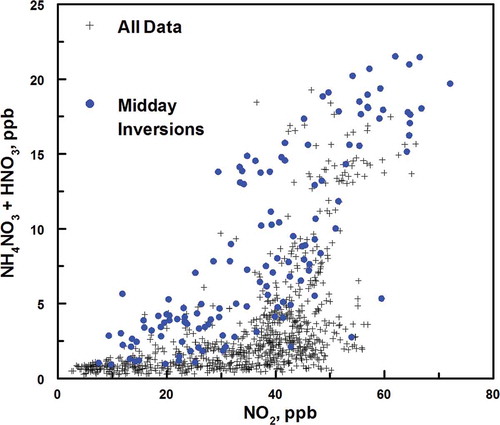
Another contributing factor to low ozone concentrations with higher NOX and NO2 concentrations is the reaction of NO2 with OH to produce nitric acid, which can then be converted to particulate nitrate and reduce the effectiveness of the peroxy radicals in the formation of ozone. The coexistence of nitrate formation and reduced ozone formation with high solar radiation is seen during the January 16–23 cold pool, as shown in . The peak concentrations of ozone during the inversion occurred when nitrate concentrations ranged from 20 to 50 μg/m3, but when solar radiation peaked at greater than 400 W/m2 ozone averaged only 50% of the ozone concentrations seen before and after the cold pool when solar radiation peaked at over 500 W/m3 but nitrate concentrations were lower than 10 μg/m3. The effect of nitrate formation on the reduction in ozone formation is apparent. A relationship can also be seen between the concentrations of NO2(g) and total nitrate, as shown in . Concentrations of the two species are correlated, particularly for the 9 a.m. to 5 p.m. time periods (noted as midday data points in ) during inversions when the formation of the OH radical occurs. The linear regression results for the concentration of NO2 and total nitrate (HNO3 and PM ammonium nitrate) during inversions for the 9:00 a.m. to 5:00 p.m. time periods are given in . During these time periods total nitrate is equal to about one-third the NO2.
Figure 9. Correlation of the hourly averaged concentrations of nitrate and O3 with solar radiation during the time period, which included the two major inversions during the study. Ozone concentrations are closely linked to solar radiation during the inversions but nitrate concentrations are not.
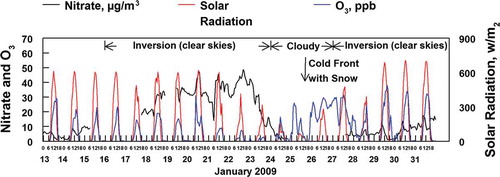
Figure 10. Correlation of the hourly averaged concentrations of NO2 and the sum of NH4NO3 plus HNO3. The time periods of maximum solar radiation (high OH radical formation) from 9 a.m. to 5 p.m. during the two inversion episodes are indicated as filled (blue) circles. Linear regression analysis for the circle data points is given in .
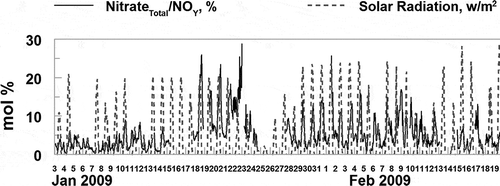
shows the fractions of total nitrogen oxides, NOY, present as either HNO3(g) or fine particulate nitrate and as either HONO(g) or fine particulate nitrite. The highest fractions of NOY present as a nitrate species are found during the two strongest inversion periods when the concentrations of fine particulate nitrate are also highest. During the inversion periods, as much as 25% of the NOY can be present as HNO3(g) or fine particulate nitrate (see and ). During both of the inversion periods (and usually outside these inversion periods) there is a dominant diurnal pattern in the fraction of NOY present as a nitrate species, with a midday maximum (see ). There is also a strong temporal relationship between the maxima in the nitrate(Total)/NOY and solar radiation values (see ), although the maximum value in these two quantities is not strongly related. This reflects the dominant role of the OH radical on nitric acid formation (see eq 4), and the expected complex relationships among NO2, VOC, RH, solar radiation and other factors, and the formation of OH . In contrast, the diurnal pattern in the fraction of NOY present as a nitrite species shows little variation over the study, with a nighttime maximum generally less that 5% of the total NOY. The nighttime maximum reflects the decay of HONO(g) during the day due to solar radiation. Nitrite is observed to peak during daytime hours, during February 15 to 20. This is inconsistent with the observed diurnal pattern for nitrite and the photochemically labile nature of HONO. The meteorology over this timeframe was not unusual and consequently cannot explain this unusual data pattern. The origin of this unique pattern is unknown.
Figure 11. Time sequence of hourly averaged PM2.5, fine particulate nitrate, and the ratio of total nitrate and nitrite to NOY and sulfate to SOX during the study. The time period of the two major inversions during the study is indicated. Nitrate formation is enhanced during the inversions but the formation of nitrite and sulfate is not.
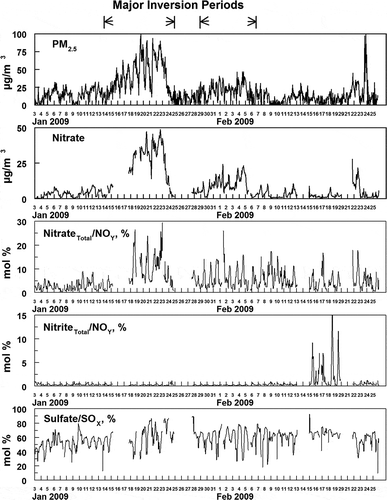
Figure 12. While the formation of fine particulate ammonium nitrate is enhanced during high solar radiation, the fraction of NOY present as nitrate is not correlated with solar radiation across the study.
The data also provide insight concerning equilibrium between ammonium nitrate and gas phase nitric acid and ammonia:
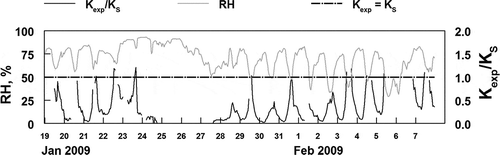
The theoretical KS values are compared to calculated KS values in . Theoretical values were calculated by assuming pure ammonium nitrate has no effect due to the presence of water in the aerosol. The calculated Kexp value is based on the measured concentrations of HNO3(g) and NH3(g) for the time period from January 10 through February 7 (Mozurkewich, Citation1993). This time is chosen because it includes the two major inversion events when the concentrations of particulate nitrate were high () and the gas-phase species were also elevated (). As expected, the ratio of Kexp/KS was very dependent on the relative humidity. The ratio approached or equaled unity only when the RH was below the ammonium nitrate deliquescence point of 62%. As the RH increased, the ratio decreased and approached 0.1 when the RH was above 75%. These results are consistent with the expectations described above. More detailed analysis of this gas/particle partitioning would be possible if PM ammonium and PM water data were available.
Figure 13. Comparison of hourly averaged RH and the ratio of the experimental product of HNO3(g) and NH3(g) (Kexp) and the equilibrium constant for the dissociation of pure ammonium nitrate at low humidity (KS).
Sulfur oxide chemistry
The chemistry involving sulfur oxides is not as complex as the nitrogen oxide chemistry. The sources are also expected to be simpler. Nitrogen oxides are emitted from mobile sources, home fuel burning, and major industrial sources. Industrial sources are the most significant emitters of sulfur dioxide, though small amounts of sulfur oxides are emitted from mobile sources. Industrial sources in the Salt Lake Valley include a copper smelter to the west and several small oil refineries to the north-northeast of the sampling site. The impact of the smelter is likely low because sulfur dioxide is emitted from a 366-m stack, usually above inversion heights. suggests that the refineries may be important contributors to sulfur dioxide at the Hawthorne site, where it is shown that the highest concentrations of sulfur dioxide are associated with winds at the Hawthorne site from the north-northwest, and to a lesser extent from the west.
Figure 14. Relationship between wind direction and hourly averaged concentration of SOX at the Hawthorne site. The complex of oil refineries in the Salk Lake Valley are located about 20 km north-northwest of the site. The expected ranges of directions for direct flow from the refineries are included in the dashed lines given in the figure.
Conversion of SO2 to sulfate can occur due to the OH radical homogeneous oxidation, or via aqueous phase chemistry (Eatough et al., Citation1994). The current data give little information on which may be the dominant mechanism during this study. The ratio of sulfate to total sulfur oxides (sulfate plus SO2) during the study is given in . Typically, sulfate accounts for about 50 to 60 mol% of the total sulfur oxides with no clear effects due to time of day or presence of an inversion. While the fraction of total sulfur oxides present as particulate ammonium sulfate is high, the concentrations relative to total PM2.5 mass are low, averaging only 7% of the PM2.5 mass ( and ).
Conclusion
During this study ammonium nitrate averaged 40% of the total PM2.5 in the absence of inversions and 69% during strong inversions in this Salt Lake Valley 2009 study. Ammonium nitrate formation was nitric acid limited, with a large excess of ammonia present. Sulfates and nitrites together constitute 7% during inversion and 11% outside of inversion periods of the total PM2.5 and are not as significant as ammonium nitrate. Ozone levels throughout the study remained well below U.S. EPA limits. Overall, the lower boundary layer in the Salt Lake Valley was found to be oxidant and VOC deficient with respect to ozone formation. Because ozone levels during the study remained well within U.S. EPA standards, the most effective way of reducing contributions of ammonium nitrate to secondary particle formation during the inversion periods is to decrease NOx emissions. However, a decrease in NOx will increase ozone concentrations. A complete ozone isopleth would further inform this decision.
Additional information
Notes on contributors
Roman Kuprov
Roman Kuprov was an MS candidate at Brigham Young University during this study and is currently an environmental scientist with the Utah Division of Air. Tyler Cruickshank and Neal Olson (recently retired) are environmental scientists with the Utah Division of Air, Salt Lake City, UT.
Delbert J. Eatough
Delbert J. Eatough is an emeritus professor, Paul M. Cropper is a Ph.D. candidate, and Jaron C. Hansen is an associate professor at Brigham Young University, Provo, UT.
Related Research Data
References
- Clapp, L.J., and M.E. Jenkin. 2001. Analysis of the relationship between ambient levels Of O-3, NO2 and NO as a function of NO chi in the UK. Atmos. Environ. 35(36): 6391–405. doi:10.1016/S1352-2310(01)00378-8
- Cropper, P.M., J.C. Hansen, and D.J. Eatough. 2013. Measurement of light scattering in an urban area with a nephelometer and PM2.5 FDMS TEOM monitor: Accounting for the effect of water. J. Air Waste Manage. Assoc. 63(9):1004–11. doi:10.1080/10962247.2013.770421
- Eatough, D.J., F.M. Caka, and R.J. Farber. 1994. The conversion of SO2 to sulfate in the atmosphere. Isr. J. Chem. 34(3–4): 301–14. doi:10.1002/ijch.199400034
- Finlayson-Pitts, B.J. 2000. Chemistry of the upper and lower atmosphere: Theory, experiments, and applications. San Diego, CA: Academic Press.
- Finlayson-Pitts, B.J., and J.N.J. Pitts. 2000. Chemistry of the upper and lower atmosphere: theory, experiments, and applications. San Diego: Academic Press.
- Grimm, H., and D.J. Eatough. 2009. Aerosol measurement: The use of optical light scattering for the determination of particulate size distribution, and particulate mass, including the semi-volatile fraction. J. Air Waste Manage. Assoc. 59(1). doi:10.3155/1047-3289.59.1.101
- Grover, B.D., N.L. Eatough, W.R. Woolwine, J.P. Cannon, D.J. Eatough, and R.W. Long. 2008. Semi-continuous mass closure of the major components of fine particulate matter in Riverside, CA. Atmos. Environ. 42(2):250–60. doi:10.1016/j.atmosenv.2007.09.037
- Grover, B.D., M. Kleinman, N.L. Eatough, D.J. Eatough, P.K. Hopke, R.W. Long, W.E. Wilson, M.B. Meyer, and J.L. Ambs. 2005. Measurement of total PM(2.)5 mass (nonvolatile plus semivolatile) with the Filter Dynamic Measurement System tapered element oscillating microbalance monitor. J. Geophys. Res. Atmos. 110(D7). doi:10.1029/2004jd004995
- Hansen, J.C., W.R. Woolwine, III, B.L. Bates, J.M. Clark, R.Y. Kuprov, P. Mukherjee, J.A. Murray, M.A. Simmons, M.F. Waite, N.L. Eatough, D.J. Eatough, R. Long, and B.D. Grover. 2010. Semicontinuous PM2.5 and PM10 mass and composition measurements in Lindon, Utah, during winter 2007. J. Air Waste Manage. Assoc. 60(3). doi:10.3155/1047-3289.60.3.346
- Long, R.W., N.L. Eatough, D.J. Eatough, M.B. Meyer, and W.E. Wilson. 2005. Continuous determination of fine particulate matter mass in the Salt Lake City Environmental Monitoring Project: A comparison of real-time and conventional TEOM monitor results. J. Air Waste Manage. Assoc. 55(12):1839–46. doi:10.1080/10473289.2005.10464776
- Long, R.W., N.L. Eatough, N.F. Mangelson, W. Thompson, K. Fiet, S. Smith, R. Smith, D.J. Eatough, C.A. Pope, and W.E. Wilson. 2003. The measurement of PM2.5, including semi-volatile components, in the EMPACT program: Results from the Salt Lake City Study. Atmos. Environ. 37(31):4407–17. doi:10.1016/S1352-2310(03)00585-5
- Long, R.W., W.K. Modey, P.S. Smith, R. Smith, C. Merrill, J. Pratt, A. Stubbs, N.L. Eatough, D.J. Eatough, W.C. Malm, and W.E. Wilson. 2005. One- and three-hour PM2.5 characterization, speciation, and source apportionment using continuous and integrated samplers. Aerosol Sci. Technol. 39(3): 238–48. doi:10.1080/027868290925633
- Mozurkewich, M. 1993. The dissociation-constant of ammonium-nitrate and its dependence on temperature, relative-humidity and particle-size. Atmos. Environ. Part A Gen. Topics 27(2):261–70. doi:10.1016/0960-1686(93)90356-4
- Pio, C.A., and R.M. Harrison. 1987. The equilibrium of ammonium-chloride aerosol with gaseous hydrochloric-acid and ammonia under tropospheric conditions. Atmos. Environ. 21(5):1243–46. doi:10.1016/0004-6981(87)90253-8
- Pope, C.A., M.L. Hansen, R.W. Long, K.R. Nielsen, N.L. Eatough, W.E. Wilson, and D.J. Eatough. 2004. Ambient particulate air pollution, heart rate variability, and blood markers of inflammation in a panel of elderly subjects. Environ. Health Perspect. 112(3):339–45. doi:10.1289/Ehp.6588
- U.S. Environmental Protection Agency. 2008. Quality Assurance Handbook for Air Pollution Measurement Systems Volume II. http://www.epa.gov/ttnamti1/files/ambient/pm25/qa/QA-Handbook-Vol-II.pdf.
- U.S. Environmental Protection Agency. 2010. NCore 2010. http://www.epa.gov/ttnamti1/ncore (accessed August 18, 2010).
- Whiteman, C.D., X.D. Bian, and S.Y. Zhong. 1999. Wintertime evolution of the temperature inversion in the Colorado Plateau basin. J. Appl. Meteorol. 38(8):1103–17. doi:10.1175/1520-0450(1999)038<1103:Weotti>2.0.Co;2