
Abstract
States rely upon photochemical models to predict the impacts of air quality attainment strategies, but the performance of those predictions is rarely evaluated retrospectively. State implementation plans (SIPs) developed to attain the 1997 U.S. standard for fine particulate matter (PM2.5; denoting particles smaller than 2.5 microns in diameter) by 2009 provide the first opportunity to assess modeled predictions of PM2.5 reductions at the state level. The SIPs were the first to rely upon a speciated modeled attainment test methodology recommended by the U.S. Environmental Protection Agency to predict PM2.5 concentrations and attainment status. Of the 23 eastern U.S. regions considered here, all but one achieved the 15 μg/m3 standard by 2009, and the other achieved it the following year, with downward trends sustained in subsequent years. The attainment tests predicted 2009 PM2.5 design values at individual monitors with a mean bias of 0.38 μg/m3 and mean error of 0.68 μg/m3, and were 95% accurate in predicting whether a monitor would achieve the standard. All of the errors were false alarms, in which the monitor observed attainment after a modeled prediction of an exceedance; in these cases, the states used weight-of-evidence determinations to argue that attainment was likely. Overall, PM2.5 concentrations at monitors in the SIP regions declined by 2.6 μg/m3 from 2000–2004 to 2007–2009, compared with 1.6 μg/m3 in eastern U.S. regions originally designated as attainment. Air quality improvements tended to be largest at monitors that were initially the most polluted.
Implications
As states prepare to develop plans for attaining a more stringent standard for fine particulate matter, this retrospective analysis documents substantial and sustained air quality improvements achieved under the previous standard. Significantly larger air quality improvements in regions initially designated nonattainment of the 1997 standard indicate that this status prompted heightened control efforts. The speciated modeled attainment test is found to be accurate and slightly conservative in predicting particulate concentrations for the cases considered here, providing confidence for its use in upcoming attainment plans.
Introduction
The Clean Air Act authorizes the U.S. Environmental Protection Agency (EPA) to set National Ambient Air Quality Standards (NAAQS) for six criteria pollutants, yet it is the states’ responsibility to attain those standards. Attainment demonstrations, submitted by states to EPA as revisions to state implementation plans (SIPs), set forth control measures for reducing emissions as well as modeling to demonstrate that the measures will be sufficient to attain the NAAQS by the targeted attainment date. The effectiveness of state-level attainment efforts is a key consideration in overall assessments of air quality management in the United States (Anderson, Citation2006; Fine and Owen, Citation2005; National Research Council [NRC], Citation2004).
Particulate matter (PM) was historically regulated based on total suspended particulate or other broad measures of particle mass. Epidemiological evidence showing particles smaller than 2.5 microns in diameter (PM2.5) to be especially damaging to human health (Dockery et al., Citation1993; Pope and Dockery, Citation2006) prompted EPA to develop standards specifically limiting mass concentrations in this size range. Although promulgated in 1997, the standards were not implemented until 2002 following lengthy litigation (Bachmann, Citation2007). The 1997 standards limited PM2.5 to 15 μg/m3 on an annual basis (subsequently lowered to 12 μg/m3 in 2012) and 65 μg/m3 on a 98th percentile daily basis (lowered to 35 μg/m3 in 2006). Each standard is evaluated based on 3-yr averages known as design values (DVs). EPA designated areas as nonattainment for the annual and/or 24-hr PM2.5 NAAQS based on air quality monitoring data from 2001 to 2003. Most nonattainment areas were required to achieve attainment based on their 2009 DV (i.e., 2007–2009 data), and thus their attainment demonstrations can now be evaluated by ambient observations.
The attainment demonstrations that aimed to attain the PM2.5 standard by 2009 were the first to use EPA’s recommended speciated modeled attainment test (EPA, 2007) to predict whether PM2.5 attainment would be achieved. Like the modeled attainment test for ozone, this approach simulates the ratio between pollution under target year and base year emission inventories for identical historical meteorological conditions. That ratio, known as a response factor (RRF), is then multiplied by observed base period pollution levels to predict target year DVs. However, since PM2.5 is composed of multiple chemical compounds, its test requires that PM2.5 first be speciated into seven components, with separate RRFs computed and applied to each. Since the majority of regulatory PM2.5 monitors do not speciate composition, speciation is typically inferred from nearby monitors that provide those measurements.
Very few studies have reviewed the content of attainment demonstrations or evaluated their performance in improving air quality and achieving ambient standards. Several studies have documented substantial reductions in PM observed in various portions of the United States over the past decade (Blanchard et al., Citation2013; Coen et al., Citation2013; Hand et al., Citation2013) but did not link those improvements to state-level efforts. Fine and Owen (Citation2005) reviewed the SIP process and the roles of modeling and public participation. A comprehensive review of air quality management in the United States (NRC, Citation2004) assessed the role of attainment demonstrations and the relative contributions of state and federal measures.
Two studies have assessed the modeling approach to predicting attainment of ozone standards (Jones et al., Citation2005; Sistla et al., Citation2004). Pegues et al. (Citation2012) evaluated the performance of SIPs in achieving attainment of the 1997 ozone standard, and compared rates of air quality improvement in regions that were and were not required to develop an attainment demonstration. However, the methodology of the speciated modeled attainment test for PM2.5 and its performance in predictions of pollutant levels have not been evaluated previously in the peer-reviewed literature.
Here, we build from the approach of Pegues et al. to assess attainment demonstrations developed to meet EPA’s 1997 annual PM2.5 standard by 2009. Regulatory model predictions of future air quality are compared with observations to assess their performance in predicting future attainment and air quality improvements. Trends in reducing PM2.5 are compared for regions that did and did not submit an attainment demonstration. This provides circumstantial evidence of whether nonattainment designation and the development of an attainment plan prompted accelerated efforts to improve air quality.
Methods
Attainment demonstrations considered
Online searches and inquiries to state air quality agencies and regional EPA offices were conducted to obtain all available attainment demonstrations that sought attainment of the 1997 annual PM2.5 standard by 2009 (). The analysis covers 23 nonattainment regions, some of which span multiple states that each developed attainment demonstrations. When a nonattainment region is under the jurisdiction of more than one state, attainment demonstrations from all of these states are used, with modeling results for each monitor taken from the corresponding state to the extent possible. In some cases (e.g., the New Jersey SIP for Philadelphia), a multistate region necessitates submittal of a document even by a state whose monitors within that region meet the standard. Although separates results by state in multistate regions, it is the highest DV across each region that ultimately determines attainment status.
Table 1. Attainment demonstrations for PM2.5 considered in this study
Some regions were excluded in this study, as they achieved the standard early and thus did not submit full attainment demonstrations. We were unable to obtain attainment demonstrations from Illinois, and thus use the Missouri attainment demonstration for all St. Louis monitors. Given our focus on the 2009 attainment year, regions that requested an extension to 2014 (Liberty-Clairton, Pennsylvania, and Los Angeles–South Coast and San Joaquin Valley, California) were also excluded. However, the attainment demonstration for Birmingham, Alabama, is included, since it initially sought attainment by 2009 but requested a 2012 target after modeling showed more time was needed; the region was subsequently redesignated to attainment status after its 2010 observed DV attained the standard.
The attainment demonstrations considered here were submitted between 2008 and 2010 (), due to the delays in implementing the PM2.5 NAAQS following litigation. Thus, observations counting toward the targeted 2009 DV were already underway when the attainment demonstrations were submitted. Nevertheless, the modeling and emission inventory development reported in the attainment demonstrations were undertaken years earlier and thus can still be viewed as predictions of year 2009 conditions.
The EPA guidance document for attainment demonstrations recommends the speciated modeled attainment test as the primary predictor of whether an attainment plan is sufficient to attain the PM2.5 NAAQS by the targeted date (EPA, 2007). The test is based on the application of a photochemical model to predict trends in pollutant levels between the base and targeted time periods. All of the attainment demonstrations considered here adopted the recommended test and used either the Community Multiscale Air Quality (CMAQ) model (Byun and Schere, Citation2006) or the Comprehensive Air Quality Model with Extension (CAMx) (ENVIRON, Citation2010) (). CAMx was used primarily in Midwest states, which shared modeling development through the Lake Michigan Air Directors Consortium, whereas CMAQ was used in most other states.
The attainment demonstrations used future year (i.e., 2009) and base year (i.e., 2002) emission inventories as inputs to simulations with identical historical meteorology (typically from 2002) to compute the ratios (RRFs) between future and base year concentrations for each speciated component of PM2.5 at each monitor. The RRFs were then multiplied by the observed base design value (DVB) concentrations on a speciated basis to predict the future design value (DVF) of PM2.5 at each monitor. To demonstrate attainment for a region, all monitors must be projected to meet the NAAQS limit by the targeted year (in this case, 15 μg/m3 by 2009). The guidance document recommends that DVBs be calculated by averaging three successive 3-yr averages of PM2.5 observations; thus, the 2002, 2003, and 2004 DVs (i.e., 2000–2004 data) were used to establish DVBs in the attainment demonstrations.
Predictions of 2009 DVs were taken from the modeled attainment demonstrations, and compared with observations at the monitor with the corresponding EPA Air Quality System (AQS) ID number. Modeling results were considered only for monitors within the state issuing the attainment demonstration, with the exceptions that the Missouri demonstration was used for monitors in the Illinois portion of St. Louis, and a joint Washington, DC, region demonstration was used for monitors in the Maryland and Virginia portions of the Washington region.
Beyond the modeled attainment demonstrations, we also qualitatively considered supplemental weight-of-evidence determinations provided in the documents where applicable. The EPA guidance document encourages states to use supplemental analyses such as additional modeling and emission and air quality trend analyses to complement the primary modeled attainment test, especially if the primary modeled results are near the NAAQS threshold (a maximum DVF between 14.5 and 15.5 μg/m3).
Observational data
Observational data were obtained from a July 26, 2012, data query of the AQS database. A subsequent data query on July 10, 2013, was used to extend the data to 2012 DVs. PM2.5 annual DVs represent the 3-yr average of the annual mean PM concentrations at each monitor. Following the protocol of the SIP attainment demonstrations, baseline conditions were defined based on the average of three DVs ending in 2002, 2003, and 2004. This results in a weighted average of observational data from 2000 to 2004, with greatest weight on the year 2002.
Performance of each attainment demonstration was assessed based on the 2009 DV (i.e., observational data from 2007 to 2009), corresponding to the targeted attainment year. AQS defines data completeness based on a monitor recording valid measurements for at least 75% of days in each quarter, or a minimum of 11 days for monitors exceeding 12.0 μg/m3. Monitors with incomplete data for any year during 2007–2009 or identified in AQS as nonrepresentative microscale sites are excluded from the analysis. Monitors with complete data for 2007–2009, but with incomplete data for the 2000–2004 base period, were included in the assessment of model predictions of 2009 DVs, but excluded from assessments of PM2.5 reductions across these periods.
Results
Predicted versus observed attainment status
We first compare SIP model predictions of PM2.5 with data observed at monitors to evaluate their accuracy in predicting 2009 DVs and attainment (). The model predictions are taken from the 2009 DVFs reported by modeled attainment tests. Observed 2009 DVs in are based on observations of PM2.5 from 2007 to 2009 at each monitor. The vertical line across 15 μg/m3 in divides monitors that detect attainment from those that did not, whereas the horizontal line divides predicted attainment from predicted nonattainment.
Figure 1. Annual PM2.5 design values predicted by attainment demonstrations and observed at monitors in 2007–2009.
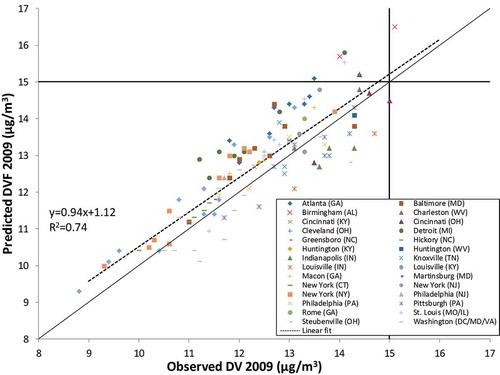
All but one of the 117 monitors considered in did in fact observe a 2009 DV of 15 μg/m3 or less, with a single Birmingham monitor observing 15.1 μg/m3 and one Cincinnati monitor exactly meeting the limit. Subsequent AQS data obtained after our initial analysis (new data query July 10, 2013) show that 2012 DVs (based on 2010–2012 observations) at all of the monitors, including the highest monitors in Birmingham (13.0) and Cincinnati (13.4), were below 15 μg/m3. The standard modeled attainment tests correctly predicted attainment for 110 monitors, and nonattainment at a Birmingham monitor, representing a 94.8% success rate for predictions. “False alarms,” in which the modeled attainment test predicted an exceedance but attainment was observed, occurred at monitors in Atlanta, Birmingham, Cleveland, Detroit (two monitors), and St. Louis. No false negatives were observed. Thus, overall, the standard modeled attainment test was highly accurate in predicting attainment status, and tended to be conservative rather than optimistic when predictions were errant.
In cases where nonattainment was predicted by the modeled attainment test, states adopted alternate approaches to complying with the regulation. The predictions of exceedances at the Birmingham monitors led Alabama to seek attainment by 2012. However, actual PM2.5 levels in 2009 were lower than predicted, and attainment was subsequently achieved in 2010.
In the other states that modeled nonattainment, the attainment demonstrations made weight-of-evidence arguments to claim that attainment would be achieved by 2009 despite the results of the test. For example, the Michigan attainment demonstration for Detroit noted downward trends in observations and additional control measures near the most polluted monitors that it expected would lead to attainment. Similarly, the Ohio attainment demonstration argued that localized controls not fully captured by the air quality model would lead to attainment. The weight-of-evidence arguments were subsequently borne out by observations, as attainment was achieved in each of these regions by 2009.
PM2.5 continued to decline after the 2009 target year, with DVs for the attainment demonstration regions (defined by the single monitor with highest DV, even for interstate regions) falling from an average 13.7 μg/m3 in 2009 to 12.2 μg/m3 in 2012 (). The number of regions exceeding the new 12 μg/m3 standard fell from 21 to 13. Thus, the air quality improvements achieved by 2009 were not merely short-term or meteorology-induced occurrences, but instead part of a sustained trend of declining PM2.5 that is bringing most of the eastern United States in or near attainment of the new standard.
Predicted versus observed design values
The modeled attainment test was also slightly conservative on a numerical basis in predicting design values. The models overpredicted actual 2009 DVs by an average of 0.38 μg/m3, with mean error of 0.68 μg/m3. Overpredictions occurred at more than twice as many monitors (81; points above the solid diagonal line in ) as underpredictions (32) or exact matches (4). At only 4 monitors was the underprediction larger than 1 μg/m3, whereas overpredictions of 1 μg/m3 or more occurred at 25 monitors. Correlation between predicted and observed 2009 DVs was high, with an R2 of 0.74. Mean bias was slightly higher for predictions made by CMAQ (0.42 μg/m3) than for those made by CAMx (0.22 μg/m3). However, the difference is not statistically significant (P = 0.38 for two-tailed t test) and may reflect the fact that CAMx was primarily used in Midwest states and CMAQ elsewhere ().
shows improvements in PM2.5 from the base (2000–2004) to the target (2007–2009) period on a modeled and observed basis. This evaluation considers a more limited subset of 78 monitors for which complete data were available for both periods and for which the attainment demonstrations provided predicted DVs. All of the monitors in the regions that developed attainment demonstrations observed improvements of at least 1 μg/m3, and 20 monitors observed improvements of at least 3 μg/m3. The models underpredicted observed improvements by an average of 0.37 μg/m3, with greatest underpredictions in Detroit, Birmingham, and Atlanta.
Figure 2. Predicted and observed reductions in PM2.5 design values from 2000–2004 to 2007–2009.
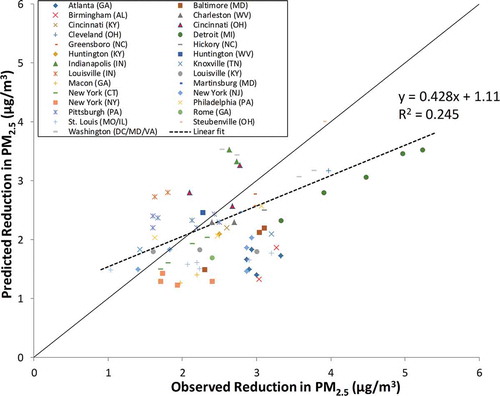
An important aspect of model performance is its prediction of the highest DV in a region for the target year, since it is the monitor with the highest value that determines attainment. Excluding regions in which the monitor with the highest base and predicted DV was shut or had incomplete data for the 2009 DV period (Atlanta, Chattanooga, and New York) and considering only the single highest DV in interstate regions, the modeled attainment test overpredicted the highest observed DV within that region by an average of 0.47 μg/m3, with a mean error of 0.72 μg/m3. All predictions were within 1.7 μg/m3 of the actual value. As noted earlier, the modeled attainment test predicted nonattainment in four regions where attainment was in fact observed, and correctly predicted the status of the remaining regions. One of the false-alarm regions, Atlanta, may have been influenced by the decommissioning of the monitor with the highest base and predicted DV.
Improvements in nonattainment and attainment regions
An important question in assessing the value of the SIP process is whether nonattainment designation and the subsequent development of state and local control measures for attainment plans spur accelerated improvements in air quality. During the period of interest, substantial emission reductions were achieved through national and interstate efforts to control nitrogen oxides (NOx) and sulfur dioxide (SO2) from point sources, and tighter emission standards for vehicles and fuels (EPA, 2003, 2005, 2012). State-level legislation approved prior to PM attainment planning, such as the North Carolina Clean Smokestacks Act (Schwarz, Citation2005), also contributed to improvements. All of these measures, together with SIP-motivated state and local emission controls, contributed to substantial reductions in all of the primary and secondary sources of PM except for ammonia (Xing et al., Citation2013). The relative contribution of state and local measures prompted by attainment planning can be investigated by comparing the air quality improvements in the regions that developed attainment demonstrations with those that occurred elsewhere.
We expand our consideration of EPA AQS data beyond the regions identified in to include all monitors with complete data for the base (2000–2004) and target (2007–2009) periods, excluding any sites designated as nonrepresentative. Monitors are classified based on whether they were originally designated as attainment or nonattainment of the 1997 PM2.5 standard. Nonattainment region monitors are further divided into (1) regions that developed an attainment plan seeking attainment by 2009 (), (2) regions that attained the standard prior to submitting an attainment demonstration, and (3) regions that are seeking to develop an attainment plan for a later attainment date. Results for these categories are summarized in and displayed in .
Table 2. Reduction in PM2.5 at monitors in regions originally designated as nonattainment or attainment of the annual standard
Figure 3. Observed reductions in PM2.5 design values from 2000–2004 to 2007–2009, grouped by the nonattainment and SIP status of the region.
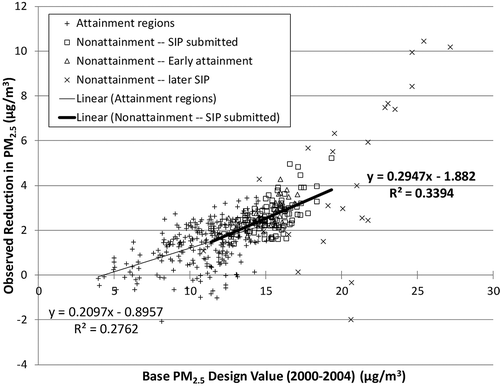
Monitors in nonattainment regions achieved greater improvements in PM2.5 from 2000–2004 to 2007–2009 than monitors in regions that originally attained the 15 μg/m3 standard (). For monitors in the nonattainment regions that submitted attainment demonstrations (), improvements averaged 2.6 μg/m3 (17%), compared with 1.5 μg/m3 (13%) in regions that attained the standard from the beginning, or 1.6 μg/m3 (13%) if only eastern U.S. attainment monitors are considered (defined as Missouri and eastward, since Missouri is the westernmost state in , and excluding Puerto Rico). The greater improvement in attainment demonstration regions than at other eastern U.S. monitors that had never been designated nonattainment was highly statistically significant (P < 10−18 for improvements expressed on a μg/m3 basis, and P ˜ 1.5 × 10⁻⁸ for improvements expressed on a percentage basis). Air quality improvements in the regions were widespread, as all monitors achieved at least 1 μg/m3 of reduction. By contrast, 10% of monitors in the originally attaining regions (though only 6% of those within the eastern United States) experienced no change or increases in PM.
Some of the larger improvement in nonattainment regions than in attainment regions reflects a general trend of greater improvements at monitors that were more polluted in earlier years. The correlation between initial air quality and the magnitude of improvements parallels the findings of Pegues et al. (Citation2012), who showed that ozone and nitrogen dioxide (NO2) reductions were greatest in regions where pollution levels were initially highest. The effect of nonattainment status can be isolated by considering monitors with similar initial DVs. Among monitors with 2000–2004 PM2.5 DVs of 12–15 μg/m3, average improvements were larger in the nonattainment regions that submitted attainment demonstrations (2.3 μg/m3) than in the attainment regions within the eastern United States (1.9 μg/m3). The difference was statistically significant (P = 2.9 × 10⁻⁵ for two-tailed t test).
Nonattainment regions that did not write an attainment demonstration due to observing clean data prior to submission achieved slightly larger average improvements than the regions that submitted attainment demonstrations (). This is to be expected, since to achieve redesignation these regions inherently had observed improvements in air quality, which may or may not have resulted from control measures developed when an attainment demonstration was anticipated. Even faster air quality improvements were observed in regions that had not yet written an attainment demonstration as of 2009 due to a later attainment date. All but one of these monitors is in California, which has taken aggressive actions to reduce emissions of PM2.5 and its precursors (California Air Resources Board [CARB], Citation2007).
One hypothesis to be tested is whether PM reductions in each nonattainment region occurred fastest at the most polluted monitor, as localized control measures near that monitor may have been prioritized to achieve attainment. The PM2.5 standard assigns attainment status and an overall design value to each region based on the monitor with the highest design value, which creates added impetus to achieve reductions at that monitor. Many of the attainment demonstrations noted specific control measures targeting controls near the monitor modeled to have the highest 2009 DV. For example, the Michigan attainment demonstration for Detroit noted controls at steel producers, an oil refinery, and a rail yard adjacent to the Dearborn monitor, which had the highest PM2.5 in that region. Similarly, the Alabama attainment demonstration for Birmingham targeted controls at steel producers and pipe companies near the two monitors with the highest DVs.
Considering only the monitor with the highest predicted 2009 DV in each region (selecting only one in multistate regions) and excluding monitors with incomplete data in the base or target period, 18 monitors were available for analysis. At these monitors, the average improvement in PM2.5 from 2000–2004 to 2007–2009 was 3.1 μg/m3, compared with 2.5 μg/m3 at other monitors in the regions (). This could reflect the success of localized controls in achieving additional improvements at the most problematic monitors. However, the stronger reduction at peak monitors is also part of the general trend of greatest air quality improvements where the initial concentrations were the highest, even among monitors in attainment regions that did not prepare an attainment demonstration ().
Discussion
All of the attainment demonstrations considered here used the EPA-recommended speciated modeled attainment test as the primary predictor of PM2.5 levels in the target year. These attainment demonstrations represent the first opportunity to evaluate the performance of the speciated PM2.5 test in regulatory practice, since the test was set forth in an EPA guidance document in 2007. The modeled attainment test for PM2.5 faces greater challenges than the similar one for ozone evaluated by Pegues et al. (Citation2012), since it must consider PM on a speciated basis in predicting future concentrations. As noted earlier, the test for PM faces the added complication that speciation is not directly measured at most monitors and must be inferred from nearby speciation monitors.
Despite these challenges, the attainment test achieved accurate to somewhat conservative performance in predicting 2009 PM2.5 DVs, with low mean bias and error both for individual monitors and for the highest value in each region. The test also achieved a 94.8% success rate in predicting whether monitors would exceed the standard. At monitors where the test predicted false alarms, weight-of-evidence determinations subsequently proved correct in predicting that attainment would in fact be achieved.
The meaningfulness of these results in evaluating the speciated modeled attainment test and associated models may be questioned given that the attainment demonstrations were issued around the same time (2008–2010; ) as the observations were being observed that determined the target DVs (2007–2009). However, most of the emission inventory development and modeling were conducted years before the attainment demonstrations were submitted to EPA, and the modeling computed reduction factors relative to a 2002 base emissions period. The modeled tests also relied upon base rather than target period meteorology, and did not account for the financial recession that may have affected emissions during the final years. Although observations within the target period were considered in some of the weight-of-evidence determinations, they did not factor directly into the speciated modeled attainment tests. In sum, the modeled tests achieved strong performance in spite of considerable challenges, even if the time horizon of predictions was short.
Regions issuing attainment demonstrations to attain the 15 μg/m3 PM2.5 air quality standard by 2009 were remarkably successful in achieving that goal. All of these regions attained the standard by 2009, and Birmingham attained a year later after originally requesting a 3-yr extension. Average air quality improvements at monitors in these regions was substantial, 2.6 μg/m3, given the short time between the base (2000–2004) and target (2007–2009) years. Although PM2.5 reductions were slightly greater at peak monitors that drive attainment status, improvements were widespread across the regions that submitted attainment demonstrations. Given the correlations between incremental changes in PM2.5 and mortality rates (Pope and Dockery, Citation2006), these improvements likely yielded substantial public health benefits.
The role of nonattainment status and the SIP process relative to national trends in driving these air quality improvements is difficult to quantify, since PM2.5 levels also declined in most regions that did not develop attainment demonstrations. The fastest air quality improvements occurred in nonattainment regions with later attainment dates than the regions considered in , indicating an aggressive pursuit of control measures before those attainment demonstrations are submitted. Monitors in nonattainment regions that submitted attainment demonstrations achieved nearly twice as much PM2.5 reduction as monitors in attainment regions. Some of this difference reflects more polluted conditions in earlier years at monitors in regions that submitted attainment demonstrations. However, even on a percentage basis, monitors in the regions observed PM reductions at significantly faster rates than those in attainment regions. Among monitors with similar initial DVs, moderately faster improvements occurred in the nonattainment regions than in attainment regions. Overall, the results are consistent with a hypothesis that national controls drove the majority of PM2.5 reductions, but that the SIP process yielded substantial improvements as well. Additional insight could be gained in future research by considering relative trends in PM2.5 on a speciated basis, utilizing data from the minority of monitors that reports speciated data.
The results presented here provide a retrospective evaluation of the performance of modeling and control measures for attaining the 1997 15 μg/m3 standard, as attention now turns to attaining the more stringent 12 μg/m3 standard issued in 2012. EPA plans to designate nonattainment regions in 2014, and allow states until 2020–2025 to attain the standard. The results presented here provide confidence in the continued use of the speciated modeled attainment test to predict future PM2.5 levels. The weight-of-evidence determinations proved to be a helpful supplement to the attainment test in the attainment demonstrations considered here, as they allowed states to document localized controls and other considerations that counteracted false-alarm predictions of nonattainment. Caution is still needed in reviewing weight-of-evidence determinations, since for both ozone and PM2.5 they have almost uniformly been used to suggest pollution levels will be lower than modeled; as documented by Pegues et al. (Citation2012), this led to false predictions of attainment in some ozone attainment demonstrations. Nevertheless, the cases considered here paint an overall picture of success in achieving the previous PM2.5 standard, and substantial progress toward achieving the new one.
Funding
The work was funded by National Science Foundation CAREER Award grant 087386 and the NASA Air Quality Applied Sciences Team.
Acknowledgment
The authors appreciate the assistance of numerous state agencies in providing state implementation plans.
Additional information
Notes on contributors
Daniel S. Cohan
Daniel S. Cohan is an associate professor in the Department of Civil and Environmental Engineering at Rice University, Houston, TX.
Ran Chen
Ran Chen completed a B.S. in Civil Engineering and a B.A. in Policy Studies at Rice University, Houston, TX in 2013.
References
- Anderson, J. 2006. Revisiting the SIP process: Finding a better approach to cleaner air. State Bar Texas Environ. Law J. 36:213–222.
- Bachmann, J. 2007. Will the circle be unbroken: A history of the US national ambient air quality standards. J. Air Waste Manage. Assoc. 57: 652–697. doi:10.3155/1047-3289.57.6.652
- Blanchard, C.L., G.M. Hidy, S. Tanenbaum, E.S. Edgerton, and B.E. Hartsell. 2013. The Southeastern Aerosol Research and Characterization (SEARCH) study: Temporal trends in gas and PM concentrations and composition, 1999–2010. J. Air Waste Manage. Assoc. 63:247–259. doi:10.1080/10962247.2012.748523
- Byun, D.W., and K.L. Schere. 2006. Review of the governing equations, computational algorithms, and other components of the Models-3 Community Multiscale Air Quality (CMAQ) modeling system. Appl. Mech. Rev. 59: 51–77. doi:10.1115/1.2128636
- California Air Resources Board. 2007. 2007 State Strategy for California’s State Implementation Plan (SIP) for Federal PM2.5 and 8-Hour Ozone Standards. Sacramento, CA: California Air Resources Board.
- Coen, M.C., E. Andrews, A. Asmi, U. Baltensperger, N. Bukowiecki, D. Day, M. Fiebig, A. M. Fjaeraa, H. Flentje, A. Hyvärinen, et al. 2013. Aerosol decadal trends—Part 1: In-situ optical measurements at GAW and IMPROVE stations. Atmos. Chem. Phys. 13:869–894. doi:10.5194/acp-13-869-2013.
- Dockery, D.W., C.A. Pope, X.P. Xu, J.D. Spengler, J.H. Ware, M.E. Fay, B.G. Ferris, and F.E. Speizer. 1993. An association between air pollution and mortality in 6 United States cities. N. Engl. J. Med. 329:1753–1759. doi:10.1056/nejm199312093292401
- ENVIRON. 2010. User’s Guide—Comprehensive Air Quality Model with Extensions Version 5.30. Novato, CA: ENVIRON International Corp.
- Fine, J.D., and D. Owen. 2005. Technocracy and democracy: Conflicts between models and participation in environmental law and planning. Hastings Law J. 56:901–981.
- Hand, J.L., B.A. Schichtel, W.C. Malm, and N.H. Frank. 2013. Spatial and temporal trends in PM2.5 organic and elemental carbon across the United States. Adv. Meteorol. 2013. doi:36767410.1155/2013/367674.
- Jones, J.M., C. Hogrefe, R.F. Henry, J.Y. Ku, and G. Sistla. 2005. An assessment of the sensitivity and reliability of the relative reduction factor approach in the development of 8-hr ozone attainment plans. J. Air Waste Manage. Assoc. 55:13–19. doi:10.1080/10473289.2005.10464601
- National Research Council. 2004. Air Quality Management in the United States. Washington, DC: The National Academies Press.
- Pegues, A.H., D.S. Cohan, A. Digar, C. Douglass, and R.S. Wilson. 2012. Efficacy of recent state implementation plans for 8-hour ozone. J. Air Waste Manage. Assoc. 62:252–261. doi:10.1080/10473289.2011.646049
- Pope, C.A., and D.W. Dockery. 2006. Health effects of fine particulate air pollution: Lines that connect. J. Air Waste Manage. Assoc. 56:709–742. doi:10.1080/10473289.2006.10464485
- Schwarz, P.M. 2005. Multipollutant efficiency standards for electricity production. Contemp. Econ. Policy 23: 341–356. doi:10.1093/cep/byi026
- Sistla, G., C. Hogrefe, W. Hao, J.Y. Ku, E. Zalewsky, R.F. Henry, and K. Civerolo. 2004. An operational assessment of the application of the relative reduction factors in the demonstration of attainment of the 8-hr ozone national ambient air quality standard. J. Air Waste Manage. Assoc. 54:950–959. doi:10.1080/10473289.2004.10470964
- U.S. Environmental Protection Agency. 2003. NOx budget trading programs for state implementation plans. 63 FR 57514, October 27, 1998. U.S. Code of Federal Regulations: 665–707.
- U.S. Environmental Protection Agency. 2005. Rule to reduce interstate transport of fine particulate matter and ozone (Clean Air Interstate Rule). Fed. Regist. 70:25162–25404. 70 FR 25162. https://federalregister.gov/a/05-5723
- U.S. Environmental Protection Agency. 2007. Guidance on the use of models and other analyses for demonstrating attainment of air quality goals for ozone, PM2.5, and regional haze. EPA -454/B-07-002. http://www.epa.gov/ttn/scram/guidance/guide/final-03-pm-rh-guidance.pdf.
- U.S. Environmental Protection Agency. 2012. Our Nation’s Air—Status and Trends Through 2010. EPA-454/R-12-001. http://www.epa.gov/airtrends/2011/.
- Xing, J., J. Pleim, R. Mathur, G. Pouliot, C. Hogrefe, C.M. Gan, and C. Wei. 2013. Historical gaseous and primary aerosol emissions in the United States from 1990 to 2010. Atmos. Chem. Phys. 13:7531–7549. doi:10.5194/acp-13-7531-2013