
Abstract
Near-roadway ambient black carbon (BC) and carbon monoxide (CO) concentrations were measured at two schools adjacent to a freeway and at an urban background school 2 km from the freeway to determine the change in concentrations attributable to vehicle emissions after the three-lane expansion of U.S. Highway 95 (US 95) in Las Vegas, Nevada. Between summer 2007 and summer 2008, average weekday small-vehicle volume increased by 40% ± 2% (standard error). Average weekday large-vehicle volume decreased by 17% ± 5%, due to a downturn in the economy and an associated decline in goods movement. Average vehicle speed increased from 58 to 69 mph, a 16% ± 1% increase. The authors compared BC and CO concentrations in summer 2007 with those in summer 2008 to understand what effect the expansion of the freeway may have had on ambient concentrations: BC and CO were measured 17 m north of the freeway sound wall, CO was measured 20 m south of the sound wall, and BC was measured at an urban background site 2 km south of the freeway. Between summer 2007 and summer 2008, median BC decreased at the near-road site by 40% ± 2% and also decreased at the urban background site by 24% ± 4%, suggesting that much of the change was due to decreases in emissions throughout Las Vegas, rather than only on US 95. CO concentrations decreased by 14% ± 2% and 10% ± 3% at the two near-road sites. The decrease in BC concentrations after the expansion is likely due to the decrease in medium- and heavy-duty-vehicle traffic resulting from the economic recession. The decrease in CO concentrations may be a result of improved traffic flow, despite the increase in light-duty-vehicle traffic.
Implications
Monitoring of BC and CO at near-road locations in Las Vegas demonstrated the impacts of changes in traffic volume and vehicle speed on near-road concentrations. However, urban-scale declines in concentrations were larger than near-road changes due to the impacts of the economic recession that occurred contemporaneously with the freeway expansion.
Introduction
In November 2007, to accommodate larger volumes of traffic, U.S. Highway 95 (US 95) in Las Vegas, Nevada, was expanded from three to six lanes in each direction. Three schools are located along the sound wall of US 95, with playgrounds, sports fields, and classrooms as close as 10–15 m to the nearest lane of the expanded freeway. The Federal Highway Administration, Nevada Department of Transportation, and the Sierra Club reached an agreement to settle a lawsuit regarding the US 95 freeway expansion. As part of the settlement agreement, a monitoring study was conducted to characterize the ambient and indoor concentrations of mobile source pollutants, including black carbon (BC) and carbon monoxide (CO) and some mobile source air toxics. The three objectives of the study were to (1) characterize the indoor and outdoor concentrations of mobile source air toxics (MSATs) to which students are exposed at the three schools near US 95; (2) determine the influence of US 95 vehicle traffic on MSAT concentrations at the three schools, both before and after the November 2007 freeway expansion; and (3) determine the effectiveness and MSAT removal efficiencies of heating, ventilation, and air conditioning (HVAC)/filtration systems before and after modified air filtration systems were installed at each school. This study focuses on the influence of vehicle traffic on near-road MSAT concentrations; results for other objectives are published elsewhere (e.g., McCarthy et al., Citation2013; Brown et al., Citation2013).
Recent literature has demonstrated that adverse health effects are evident in subjects exposed to ambient air near major roadways (Wu and Batterman, Citation2006; Gauderman et al., Citation2007; Health Effects Institute, Citation2010; Laumbach and Kipen, Citation2012). Emissions such as diesel particulate matter (DPM) and carbon monoxide (CO) are possible causal agents for some of these health effects (Health Effects Institute, Citation2010). Truck traffic has also been specifically associated with adverse health outcomes (Brunekreef et al., Citation1997; Ciccone et al., Citation1998; Janssen et al., Citation2003; Medina-Ramon et al., Citation2008), although few studies have used direct measurements near a roadway to associate DPM with traffic or health outcomes. DPM was identified as the largest contributor to ambient inhalation-based cancer risk in the Multiple Air Toxics Exposure Studies (MATES) II and III in Los Angeles, California (South Coast Air Quality Management District, Citation2000, 2008). DPM has also been linked to respiratory disease (Jansen et al., Citation2005) and decreases in heart rate variability (Schwartz et al., Citation2005; Adar et al., Citation2007). The U.S. Environmental Protection Agency (EPA) has listed DPM as “likely to be carcinogenic” (EPA, 2002). CO, a common tracer for gasoline combustion emissions, has been associated with increased asthma rates for children living next to roadways (Hwang et al., Citation2005). Despite an increase in motor vehicle use, CO concentrations and emissions have been steadily decreasing (Eisinger et al., Citation2002); nonetheless, gasoline combustion emissions remain the predominant source of CO in urban areas (http://www.epa.gov/region9/air/vegasco/ and http://www.epa.gov/region9/air/vegasco/LvCoMp Final-factSheet.pdf).
In the near-roadway environment, the key factors controlling pollutant concentrations are the rate of dispersion/transport (by winds and by vehicle-induced turbulence) and emissions (dependent on traffic volume, speed, and vehicle fleet mix); atmospheric reactions, deposition, and production also affect concentrations but occur on much longer time scales (Zhu et al., Citation2002; Baldauf et al., Citation2008; Hagler et al., Citation2010). The type of vehicle, particularly the number of trucks, has been shown to better predict on-freeway concentrations of black carbon (BC) than total traffic volume (Fruin et al., Citation2008), with BC concentrations increasing as truck traffic increases (Grieshop et al., Citation2006; Fruin et al., Citation2008). At very slow speeds, emission rates are higher than at cruising speeds in the range of 30–60 miles per hour (mph); changes in speed within this 30–60 mph range cause little change in emissions (Timoshek et al., Citation2010).
Here, we describe the change in traffic patterns in Las Vegas on US 95 before and after its expansion from three to six lanes each way on November 19, 2007, and the corresponding changes in pollutant concentrations. Here, the expansion of US 95 provides a way to examine how a change in traffic volume and vehicle speed, and likely a change in background conditions, impacts near-road pollution. Although air quality and meteorological data were collected during a longer time period, nominally June 2007 through August 2008, traffic data are available only for June–August 2007 and January–August 2008. Thus, here the focus is on data collected from June through August in both 2007 and 2008, so that traffic and air quality data are comparable. To our knowledge, no other study in recent years has examined changes in measured concentrations before and after a freeway expansion. BC data from an urban background site, not next to a freeway, are used for comparison. Additionally, the EMFAC (EMissions FACtors) emission model was used to estimate roadway emissions in an attempt to explain the changes in observed BC and CO concentrations. This study illustrates the complicated interplay of urban background concentrations and the effects of a freeway expansion on near-road pollutant concentrations. Additional work is needed to understand how changes in the volume and speed of vehicles impact near-road concentration gradients next to major roadways.
Methods
Ambient air was monitored at multiple schools, shown in , from June 2007 to September 2008. Fyfe Elementary and Adcock Elementary are located along the edge of US 95, with playgrounds, sports fields, and classrooms near the edge of the freeway. Hancock Elementary is 2.1 km from US 95 and Interstate 15, near side streets, and is used in this study to represent urban background concentrations. The ambient monitoring site at Fyfe was 18 m from the sound wall and 60 m from the freeway median; these distances remained constant before and after expansion. The ambient monitoring site at Adcock was 20 m from the sound wall and 63 m from the freeway median; in addition, hourly traffic volume and speed data on US 95 were collected near Adcock at the Torrey Pines overcrossing.
Figure 1. School monitoring locations and wind roses during June–August 2007 and June–August 2008. Rose petals indicate the direction from which the winds originate.
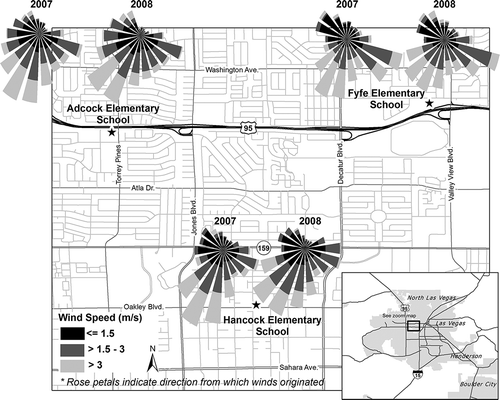
At all sites, winds of 1.5 m/sec or less were classified as stagnant or calm; for wind speeds greater than 1.5 m/sec, upwind and downwind definitions were created for each site. At Fyfe, which is north of the freeway, upwind was defined as wind direction between 260 and 50 degrees, and downwind as wind direction between 100 and 250 degrees. There is a stoplight for the off-ramp and on-ramp at 85 degrees, so we tried to exclude that area from the “downwind” definition. Also, because the freeway curves near Fyfe, the upwind and downwind directions are not exactly north/south. At Adcock, which is south of the freeway, upwind was defined as wind directions between 90 and 220 degrees, and downwind as those between 290 and 60 degrees.
At each school, an ambient monitoring location was equipped with instruments to measure BC, CO, and meteorology, as summarized in . A two-channel Magee Scientific Aethalometer (Berkeley, CA) was used to measure 5-min BC concentrations, with a manufacturer-specified precision of 0.1 μg/m3 BC. Raw data were post-processed with the Washington University Air Quality Lab AethDataMasher version 6.0e (St. Louis, MO) to format date-time stamps, correct for filter tape advances, and perform basic data validation. For the hourly averages used here, at least 75% of the 5-min data were needed to create a valid hourly average. In addition, elemental carbon (EC) data were acquired from EPA’s Air Quality System (AQS) for 2007 and 2008 at site 32-003-0020 (4701 Mitchell Street, 11 km from Fyfe) in order to compare the concentration trends with the BC data. Wind speed and direction were collected with an RM Young AQ 5305-L wind direction and speed monitor (Traverse City, MI).
Table 1. Summary of BC and CO measurements site locations and durations at each school
CO data were collected using a Thermo Scientific 48i analyzer, yielding 1-min data with a manufacturer-specified lower quantifiable limit of 0.04 ppb and precision of 2%. The 1-min data were aggregated into 5-min data for validation. For hourly averages, 75% completeness of the 5-min averages was required. Automatic zero and span checks were performed each day for CO at 3:00 a.m., with a span value of 8 ppm. Data were collected in accordance with the Quality Assurance Handbook for Air Pollution Measurement Systems, Volume II: Ambient Air Quality Monitoring Program (EPA, 2008). Because there was some zero drift with the CO monitor, we reviewed the CO zero drift weekly and manually adjusted the zero when necessary during the field operations. An automatic correction was calculated and applied for each day on the basis of zero calibration values. After operations were completed, the 5-min CO data were validated for baseline drift; baseline drift was corrected if the baseline changed by more than 5% during the day. CO data were also available from AQS at five sites in the Las Vegas area, and these data were examined for 2007 and 2008.
Detailed traffic data were collected in June and August 2007 and January through August 2008 near Adcock Elementary School at the Torrey Pines overcrossing along US 95, using a Wavetronix SmartSensor HD model 125. The Wavetronix detectors use microwave radar to detect vehicles entering and exiting a detection zone with a 1-min resolution of vehicle speed and volume counts in three vehicle-size groups. More information and comparison with other methods are available at http://www.wavetronix.com/en/products/smartsensor/hd/performance. Vehicles were classified as small, medium, and large: small vehicles are those below 21 feet in length, medium between 21 and 40 feet, and large greater than 40 feet. Whereas small vehicles were assumed to be mostly gasoline-powered and large vehicles were assumed to be mostly heavy-duty diesel vehicles, medium-sized vehicles could be gasoline or diesel vehicles. One-minute data were aggregated to hourly values of total traffic across all lanes by direction for diurnal pattern analysis. Then, hourly data were aggregated to 24-hr daily averages to calculate daily average traffic values. Data from June and August 2007 and June through August 2008 were compared to assess pre- and postexpansion traffic patterns. Data are available for a full 24 hr on 40 weekdays (i.e., Mondays through Fridays) and 17 weekend days (i.e., Saturdays and Sundays) during the 2007 period, and 65 weekdays and 13 weekend days in the 2008 period. These data do not include multiple holidays and are far enough before and after the freeway expansion opening to be representative of the pre- and postexpansion traffic. In addition, the Nevada Department of Transportation’s (NDOT) reports of annual traffic levels (Nevada Department of Transportation, Citation2007, Citation2008) were also assessed.
Results
Changes in traffic before and after expansion
On November 19, 2007, US 95 was expanded from three to six lanes each way. The expansion led to increases in total daily average traffic volume and speed. Between summer 2007 and summer 2008, where summer is June through August, average daily traffic increased by 35%, from 150,000 to 203,000. Average small-vehicle weekday volume increased by 62% ± 2%, from 110,000 ± 900 vehicles/day to 178,000 ± 900 vehicles/day ( and ); uncertainty values here are the standard error, equal to the standard deviation divided by the square root of N. However, average weekday large-vehicle traffic volume decreased by 418 ± 30 vehicles/day, i.e., a decrease of 15% ± 5%. The volume of medium-sized vehicles, which are a mix of gasoline and diesel vehicles, decreased from 37,000 ± 400 to 23,000 ± 200 vehicles/day, i.e., a decrease of 38% ± 4%.
Figure 2. Average hourly and daily weekday traffic volume for June and August 2007 and June–August 2008 for (top) small vehicles (less than 21 feet in length), (middle) medium vehicles (21–40 feet in length), and (bottom) large vehicles (greater than 40 feet in length).
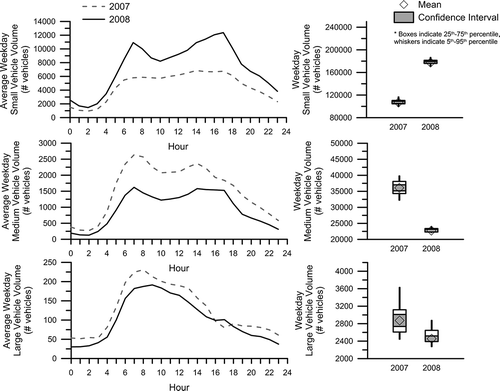
Table 2. Summary of changes in the average speed and daily vehicle count on weekdays along US 95 at the Torrey Pines overcrossing during June–August 2007 and June–August 2008 for all small, medium, and large vehicles†
In contrast to the data collected at the Torrey Pines overcrossing, NDOT annual average daily traffic (AADT) figures (Nevada Department of Transportation, Citation2007, Citation2008) show an average daily increase between 2007 and 2008 of only 12%, from 180,000 to 200,000. The reason for the discrepancy between the two data sets is unknown. Both sets have essentially the same average number of vehicles for 2008 (˜200,000), but our counts are lower than the NDOT AADT counts in 2007. Our study used traffic data from summer 2007, and it is unclear from the AADT reports when the NDOT counts were taken. If they were taken later in the year, additional lanes of traffic may have been open, even though the freeway was not fully open until November 2007. Both data sets agree that there was a significant 1-yr increase between 2007 and 2008, although the magnitude of the increase is significantly different between the two data sets. In addition, NDOT staff report via personal communication that at three other locations in the area, there were decreases in large-vehicle traffic between 2007 and 2008: at US 93 in Boulder City (13.5% decrease); at I-15 at Blue Diamond (18% decrease); and at US 95 near Searchlight (14% decrease).
As an indicator of diesel traffic, we examined diesel fuel sales in the area. Ultra-low-sulfur-content diesel fuel sales to end users in Nevada decreased between 2007 and 2008 by 41%, from 96,000 to 56,400 gallons/day, indicating a decrease in diesel truck activity (U.S. Energy Information Administration, Citation2011). Although we are using large vehicles as an indicator for diesel vehicles, a large fraction of the medium vehicles are also diesel. Because medium-vehicle volume is an order of magnitude larger than large-vehicle volume, as shown in , any change in emissions is partially due to the large drop in medium-vehicle volume.
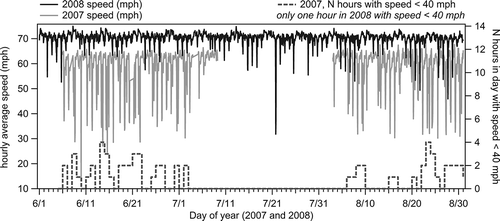
shows the hourly average speed in summer 2007 and summer 2008 along US 95, as well as the number of hours each day when speeds averaged less than 40 mph. Average daily speed for all vehicles increased from 58 ± 1 mph before the expansion (median = 59 mph) to 69 ± 1 mph afterward (median = 70 mph), a 16% ± 1% increase. In addition, the number of hours of congested traffic, here defined as hours with average speeds of less than 40 mph, decreased sharply: from 42 out of 1426 hourly observations (3%) in summer 2007 to 1 out of 2208 hourly observations (less than 0.05%) in summer 2008.
Figure 3. Hourly average vehicle speed on US 95 in June and August 2007 and June–August 2008 (left axis), and the number of hours per day with average speed less than 40 mph in June and August 2007 (right axis). Only 1 hr in 2008 had an average speed of less than 40 mph.
Changes in BC after freeway expansion
To characterize the change in BC after the freeway expansion, we compared BC concentrations at Fyfe and Hancock during summer 2007 and summer 2008. The change in BC was examined with multiple data subsets. In addition to using all data, we segregated the data set by calm (wind speed less than 1.5 m/sec) and moderate (wind speed greater than 1.5 m/sec) conditions, because a change in the frequency of calm and stagnant periods would influence the ambient concentrations. However, low wind speeds (less than 1.5 m/sec) occurred with similar frequency at Fyfe, 46% and 44% of the time in June–August 2007 and June–August 2008, respectively. Additionally, changes in the number of hours the monitoring sites were downwind of the freeway would also be expected to affect the results. There were more hours in 2008 than in 2007 when sustained winds were greater than 1.5 m/sec and Fyfe was not downwind (201 to 160, or from 13% to 10% of the hourly observations). This change in frequency of downwind conditions may have impacted the average concentration at the site, so we also segregated the data for downwind conditions with moderate winds and downwind conditions during daytime (9:00 a.m. to 5:00 p.m.). Supplemental figures show the cumulative distribution of wind speeds at Fyfe and Adcock; there was little difference in the distribution of wind speeds between 2007 and 2008 for June–August. The median wind speed at Fyfe during 2007 was 1.90 m/sec and during 2008 was 1.96 m/sec, whereas at Adcock the median wind speed in 2007 was 1.82 m/sec and in 2008 was 1.85 m/sec. At Hancock, the median wind speed was 1.76 m/sec in each year.
BC concentrations were significantly lower at Fyfe after the freeway expansion ( and ). This was evident in all data, data collected under calm conditions, data collected with moderate winds, and data collected under downwind conditions only. Median ambient BC concentrations at the two near-road school sites decreased significantly from summer 2007 to summer 2008 by 40% ± 2%; mean concentrations changed by 44%. This translated to a change of 0.61 μg/m3 at Fyfe, from a median of 1.54 μg/m3 to 0.93 μg/m3, and a change of 0.83 μg/m3 in the average (from 1.91 μg/m3 to 1.08 μg/m3). Similar results were found at both sites for hours during calm winds: a decrease of 37% ± 3% in the median, equaling a change of 1.78 μg/m3 to 1.12 μg/m3. The large change in BC at Fyfe is likely due to Fyfe’s close proximity to the freeway. Data under sustained winds showed median BC concentrations decreasing at Fyfe from 1.30 μg/m3 to 0.82 μg/m3 (−37% ± 2%). Results using downwind conditions only were similar; downwind median concentrations at Fyfe changed from 1.41 μg/m3 to 0.88 μg/m3 (−38% ± 3%). When we restricted the downwind data to only daytime observations (9:00 a.m. to 5:00 p.m.), median BC decreased at Fyfe from 1.57 μg/m3 to 0.95 μg/m3 (−39% ± 4%). We note that concentrations were also lower by a similar percentage when the site was upwind of the freeway (37%), but the absolute magnitude of the change was much smaller (from 0.40 μg/m3 to 0.24 μg/m3, a difference of 0.16 μg/m3).
Figure 4. Distributions of BC concentrations (μg/m3) during June–August 2007 and June–August 2008 for (left) Hancock, all data and data during sustained winds (wind speed greater than 1.5 m/sec); and (right) Fyfe, all data, data during sustained winds when Fyfe was downwind of the freeway, and data during sustained winds when Fyfe was upwind of the freeway.
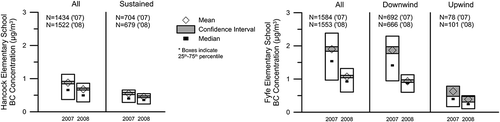
Table 3. Hourly averaged weekday BC (μg/m3) and CO (ppm) concentrations during June–August 2007 and June–August 2008 for each site and wind conditions: all data, during noncalm and downwind conditions, during noncalm and upwind conditions, and during calm wind conditions
Median BC concentrations at Hancock, the urban background site, also decreased significantly, by 24% ± 4%, from 0.66 μg/m3 to 0.50 μg/m3; mean concentrations decreased by 22%, from 0.88 μg/m3 to 0.69 μg/m3. The relative changes were similar under calm and sustained wind conditions as well, with changes in median concentrations of 0.96 μg/m3 to 0.76 μg/m3 (−21% ± 4%) and from 0.40 μg/m3 to 0.36 μg/m3 (−10% ± 5%), respectively.
For comparison, we also examined EC concentrations at the Chemical Speciation Network (CSN) site in Las Vegas, using data available in AQS. From June–August 2007 to June–August 2008, average EC concentrations decreased by 16%, from 1.0 μg/m3 to 0.84 μg/m3. The decrease in concentrations at both the near-roadway and urban background sites indicates that emissions of BC decreased throughout the Las Vegas area, not only on US 95. The decrease in heavy-duty diesel traffic on all Las Vegas roads as a result of the U.S. recession that began in December 2007 (National Bureau of Economic Research, Citation2008) is the likely cause. We note that the unemployment rate in Las Vegas jumped from 4.9% in June–August 2007 to 7.3% in June–August 2008; a nearly 50% increase (http://data.bls.gov/timeseries/LAUMT32298206?data_tool=XGtable). This was especially important for the home-building sector, as foreclosure rates in Nevada were the highest in the United States at a rate of 1 per 91 households; this rate increased 89% between August 2007 and 2008 (http://www.realtytrac.com/content/news-and-opinion/foreclosure-activity-increases-12-percent-in-august-4272).
Changes in CO after freeway expansion
and summarize CO results. Data at Fyfe and Adcock are from June–August 2007 and 2008. Median CO decreased from 2007 to 2008 by 14% ± 2% at Fyfe and by 10% ± 3% at Adcock. Median concentrations changed from 0.428 ppm to 0.369 ppm at Fyfe, and from 0.333 to 0.300 ppm at Adcock. Average concentration changes were similar; for example, at Fyfe, average CO went from 0.470 ppm to 0.383 ppm (19%).
Figure 5. Distribution of CO concentrations (ppm) during June–August 2007 and June–August 2008 for (top) Fyfe, all data, data during sustained winds when Fyfe was downwind of the freeway, and data during sustained winds when Fyfe was upwind of the freeway; and (bottom) Adcock for the same three wind conditions.
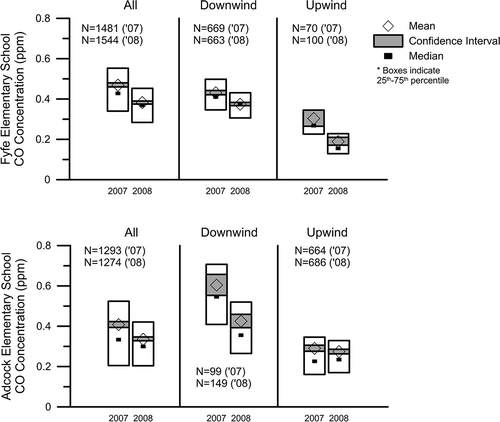
Results were similar when the data were stratified by wind speed and direction. Under calm conditions with wind speeds less than 1.5 m/sec, CO at Fyfe decreased by 19% ± 3%, from a median of 0.492 ppm to 0.397 ppm. When Fyfe was downwind of the freeway, CO was 9% ± 1% lower (from 0.410 ppm to 0.374 ppm) overall and 11% ± 1% lower (from 0.400 ppm to 0.355 ppm) during the daytime. Results were similar at Adcock.
We also examined CO data at five sites in Las Vegas, available from AQS. However, the data may have resolution issues, as the median concentration at four of the sites in June–August 2007 was 0. In addition, between 2007 and 2008 the frequency of concentrations equal to zero changed dramatically, e.g., from 1814 hourly averages in June–August 2007 at one site to none in June–August 2008. At the one site where the 2007 median was not zero, site 0539 (4180 E Sahara Avenue), median concentrations decreased from 0.54 ppm to 0.20 ppm, with mean values decreasing from 0.556 ppm to 0.351 ppm. At the other four sites, because the 2007 median was zero, higher median and average concentrations are reported in 2008, ranging between 0.450 and 0.506 ppm. We surmise that there was a significant change in instrument, operation, and/or data handling between 2007 and 2008, which makes comparison between these two years difficult.
Discussion
We ran the California EMFAC 2007 model in an attempt to partially explain observed declines in BC and CO concentrations at the near-road sites in Las Vegas. EMFAC yields emissions only, but will be a useful guide to understand how emissions may have changed; a full dispersion modeling effort would be required to quantify impacts of emissions downwind of the freeway. Fleets representative of Southern California vehicles, with vehicles segregated by length class, were used to assign emissions for summer 2007 and 2008. Because the EMFAC 2007 model does not directly assign particulate mass values into component categories, we assigned fractions from heavy-duty diesel vehicles at 80% of PM2.5 (particulate matter with an aerodynamic diameter <2.5 μm) mass and fractions from light-duty gasoline vehicles at between 10% and 30% (Fujita et al., Citation2005; Lawson et al., Citation2005). EMFAC model runs included the effects of changes in average speed, fleet mix, and traffic volume.
EMFAC model runs could not reproduce observed declines in BC or CO concentrations. The largest modeled decreases in BC emissions were 4%, and modeled CO emissions did not decrease at all, regardless of model assumptions. Three factors had the most influence on the model’s inability to match the observed declines in concentrations. First, model speed curve emission factors increased dramatically between 59 and 69 mph; this resulted in emissions that did not decline as much as observed emissions from medium and large vehicles. Only flat or declining speed curves over this speed range would produce results that match observed declines in CO and BC. Second, only the vehicle counts for medium-sized vehicles declined sufficiently to match the observed declines in BC concentrations. However, the model’s emission factors for PM2.5 were very low for both gasoline and diesel medium-sized vehicles (i.e., less than a factor of three greater than PM2.5 emissions from light-duty vehicles and a factor of 30 lower than heavy-duty vehicles). For modeled emissions from medium-sized vehicles to match observed declines in BC, larger emission factors would be needed, especially for the diesel fraction. Finally, it is possible that EMFAC overestimates emissions of BC from light-duty vehicles. The light-duty vehicles emission factor is a mix of cold start and hot running exhaust, and the fraction of BC is much higher for cold start emissions than for hot running emissions. If only hot running emissions were considered, then it is likely that the BC fraction would be much lower. The BC fraction of PM from light-duty vehicles should be near zero for hot running exhaust, with >99% of PM emissions in the form of organic carbon (OC) from light-duty gas vehicles. Either a substantial reduction in hot running emissions of both BC and CO or utilizing a model run that only included hot running emissions instead of a mix of this factor with cold starts would help to reconcile differences in observed and modeled emissions.
The decreases in medium- and large-vehicle traffic and in ambient BC at both the near-roadway and at two urban background sites (both our site at Hancock and the CSN site) suggest a fairly direct link between vehicle traffic and BC in Las Vegas. First, we assume that Hancock concentrations are representative of background BC sources in the Las Vegas area, and that the downwind concentrations at Fyfe represent a combination of these urban background levels with emissions from traffic on US 95; this assumption is likely valid because both schools are located well within the urban boundaries in land dominated by residential and commercial use, and are only 3.2 km apart. We can estimate the change in concentrations likely attributable to US 95 traffic by subtracting the background Hancock concentrations under sustained winds from the Fyfe downwind BC concentrations for both 2007 and 2008, then calculating the difference between years. BC concentrations at Fyfe downwind minus Hancock during sustained winds is 1.41 − 0.40 μg/m3, or 1.01 μg/m3 for 2007, whereas the values for 2008 were 0.88 − 0.36 μg/m3, or 0.52 μg/m3. Thus, the freeway contribution decreased from 1.01 μg/m3 in 2007 to 0.52 μg/m3 for a difference of 0.49 μg/m3 or 48%. Alternatively, we can compare changes in the difference between upwind and downwind conditions at Fyfe, although data for upwind cases are limited (i.e., 100 hourly values or less in both years) compared with the data available from Hancock. This alternative method indicates that the freeway contribution decreased by 0.38 μg/m3, or 37%. Both methods indicate a substantial decrease in the freeway’s contribution to BC between 2007 and 2008.
Two potential changes in roadway traffic volume are consistent with the decrease in BC contributions from US 95. First, it is possible that the decrease in large-vehicle traffic during peak BC hours is driving the observed changes. Large-vehicle traffic decreased by 15%; however, the decease during morning rush hour was somewhat larger, at 18%. Because BC peaks in the morning, the overall average decrease in BC may be dominated by the change in morning rush-hour traffic and associated emissions. A second possible explanation is the decrease in medium-sized-vehicle traffic after expansion. The average daily volume of medium-sized vehicles decreased by 38%, significantly more than the average daily large-vehicle volume. The magnitude of the decrease is consistent with the observed decline in BC concentrations. Unfortunately, the split between gas and diesel vehicles in the medium size range is unknown. If a substantial fraction of medium vehicles are diesel (e.g., delivery trucks), then it is likely that the decline in medium-vehicle traffic included a concomitant decline in the medium-sized diesel vehicles. We speculate that both the decline in large-vehicle traffic during morning rush hour and the decline in medium-vehicle traffic throughout the day contributed to the observed decline in BC concentrations.
Because CO emissions along the roadway come predominantly from gasoline vehicles (Eisinger et al., Citation2002; California Air Resources Board, 2009), and because small-vehicle volume between 2007 and 2008 increased by 62%, it is counterintuitive that CO concentrations would decrease. However, CO emissions from small vehicles are also affected by vehicle operating condition (i.e., whether a vehicle is accelerating/decelerating or cruising) and by average speed, with higher emissions at low and high speeds and lower emissions at cruising speeds (i.e., around 45 mph). Average vehicle speed increased from 58 ± 1 mph before the expansion to 69 ± 1 mph after the expansion, but the CO emissions for a given model year vehicle are very similar for these two average speeds (Federal Highway Administration, Citation2006), so it seems unlikely that the change in average speed caused any large change in emissions. The higher frequency of hours with average speed of less than 40 mph during 2007 indicates more congested conditions. Average fleet-wide CO emissions at 25 mph or less are much higher than average emissions at 60 mph (California Air Resources Board, Citation2011). Thus, an emission decrease due to improvement of traffic flow may have outweighed the increase in emissions due to increased small-vehicle volume.
However, it is also possible that the urban-scale effects of the economic downturn that impacted BC levels may also have played a role in the lower CO concentrations, with an overall decrease in city-wide traffic or other emissions. CO was not measured at the urban background site, so changes in the urban-scale CO levels are unquantified. The urban-scale CO levels and near-road contribution can be estimated, however, by examining the changes in concentrations at each of the sites under different wind speeds and directions. Between 2007 and 2008, CO concentrations at Fyfe declined by 19% when winds were calm and by 42% when Fyfe was upwind of the roadway; when Fyfe was downwind of the roadway, CO concentrations declined by only 9%. Assuming that upwind conditions represent urban-scale influence, calm conditions are a mix of near-road and urban-scale influence, and downwind conditions are most representative of roadway emissions, the difference in the percent change among these wind conditions provides strong evidence that the near-road contribution is masked by the urban-scale decline of at least 18–19% at Fyfe. At Adcock, CO concentrations under calm conditions showed a decline of 18%, which is very similar to the changes observed at Fyfe during that period and similarly lower than the overall decline in concentrations at the site (10%). However, the median upwind and downwind changes at Adcock are not consistent with this hypothesis. Overall, the differences between the CO decline under calm conditions and under downwind conditions suggest that most of the observed decline in near-roadway concentrations of CO is due to urban background changes.
Conclusion
At two near-roadway schools and at an urban background site, BC and CO concentrations decreased between 2007 and 2008, after a freeway expansion of US 95; during this time, medium- and heavy-duty-vehicle traffic decreased, but small-vehicle traffic volume and vehicle speed increased. Because the decrease in BC was seen at both the near-road and urban background site, it seems likely that the change in traffic on US 95 was due to the economic downturn and an overall decrease in goods movement, rather than a decrease in goods movement on US 95 alone. The change in BC is likely due to the decrease in medium and large vehicles, because diesel exhaust is one of the main sources of BC in the urban area. CO also decreased despite a 35% increase in overall traffic volume; we attribute this to improved traffic flow and possibly to an urban-wide decrease in emissions related to the economic downturn. With no trace-level CO data available at an urban site, we cannot quantitatively determine how much of the change in near-road concentrations is a result of changes in urban-scale concentrations versus the local change. Once economic activity and associated transportation exceeds 2007 levels, emissions along US 95 and the urban area may increase and return to 2007 levels or higher.
Funding
Nevada Department of Transportation (NDOT) funded the measurements reported here.
Supplemental Material
Supplemental data for this paper can be accessed on the publisher’s website.
Supplemental_Material.docx
Download MS Word (67.6 KB)Additional information
Notes on contributors
Steven G. Brown
Steven G. Brown, Michael C. McCarthy and Jennifer L. DeWinter are atmospheric scientists, David L. Vaughn is a senior air quality field technician, and Paul T. Roberts is Executive Vice President and Chief Scientific Officer at Sonoma Technology, Inc., an air quality consulting firm in Petaluma, CA.
Michael C. McCarthy
Steven G. Brown, Michael C. McCarthy and Jennifer L. DeWinter are atmospheric scientists, David L. Vaughn is a senior air quality field technician, and Paul T. Roberts is Executive Vice President and Chief Scientific Officer at Sonoma Technology, Inc., an air quality consulting firm in Petaluma, CA.
Jennifer L. DeWinter
Steven G. Brown, Michael C. McCarthy and Jennifer L. DeWinter are atmospheric scientists, David L. Vaughn is a senior air quality field technician, and Paul T. Roberts is Executive Vice President and Chief Scientific Officer at Sonoma Technology, Inc., an air quality consulting firm in Petaluma, CA.
David L. Vaughn
Steven G. Brown, Michael C. McCarthy and Jennifer L. DeWinter are atmospheric scientists, David L. Vaughn is a senior air quality field technician, and Paul T. Roberts is Executive Vice President and Chief Scientific Officer at Sonoma Technology, Inc., an air quality consulting firm in Petaluma, CA.
Paul T. Roberts
Steven G. Brown, Michael C. McCarthy and Jennifer L. DeWinter are atmospheric scientists, David L. Vaughn is a senior air quality field technician, and Paul T. Roberts is Executive Vice President and Chief Scientific Officer at Sonoma Technology, Inc., an air quality consulting firm in Petaluma, CA.
Related Research Data
References
- Adar, S.D., D.R. Gold, B.A. Coull, J. Schwartz, P. Stone, and H. Suh. 2007. Focused exposures to airborne traffic particles and heart rate variability in the elderly. Epidemiology 18:95–103. doi:10.1097/01.ede.0000249409.81050.46
- Baldauf, R., E. Thoma, M. Hays, R. Shores, J.S. Kinsey, B. Gullet, S. Kimbrough, V. Isakov, T. Long, R. Snow, A. Khlystov, J. Weinstein, F.-L. Chen, R. Seila, D. Olson, I. Gilmour, S.-H. Cho, N. Watkins, P. Rowley, and J. Bang. 2008. Traffic and meteorological impacts on near-road air quality: Summary of methods and trends from the Raleigh near-road study. J. Air Waste Manage. Assoc. 58:865–878. doi:10.3155/1047-3289.58.7.865
- Brown, S.G., T.L. Lee, P.T. Roberts, and J.L. Collett Jr. 2013. Variations in the OM/OC ratio of urban organic aerosol next to a major roadway. J. Air Waste Manage. Assoc. 63:1422–1433. doi:10.1080/10962247.2013.826602
- Brunekreef, B., N.A. Janssen, J. de Hartog, H. Harssema, M. Knape, and P. van Vliet. 1997. Air pollution from truck traffic and lung function in children living near motorways. Epidemiology 8:298–303. doi:10.1097/00001648-199705000-00012
- California Air Resources Board. 2009. 2008 estimated annual average emissions. http://www.arb.ca.gov/app/emsinv/emssumcat_query.php?F_YR=2008&F_DIV=-4&F_SEASON=A&SP=2009&F_AREA=CA#8 (accessed April 28, 2014).
- California Air Resources Board. 2011. Mobile source emission inventory: Current methods and data. http://www.arb.ca.gov/msei/modeling.htm (accessed April 28, 2014).
- Ciccone, G., F. Forastiere, N. Agabiti, A. Biggeri, L. Bisanti, E. Chellini, G. Corbo, V. Dell’Orco, P. Dalmasso, T.F. Volante, C. Galassi, S. Piffer, E. Renzoni, F. Rusconi, P. Sestini, and G. Viegi. 1998. Road traffic and adverse respiratory effects in children. Occup. Environ. Med. 55:771–778. doi:10.1136/oem.55.11.771
- Eisinger, D.S., K. Dougherty, D.P.Y. Chang, T. Kear, and P.F. Morgan. 2002. A reevaluation of carbon monoxide: Past trends, future concentrations, and implications for conformity “hot spot” policies. J. Air Waste Manage. Assoc. 52:1012–1025. doi:10.1080/10473289.2002.10470839
- Federal Highway Administration. 2006. Transportation air quality facts and figures. http://www.fhwa.dot.gov/environment/air_quality/publications/fact_book/page15.cfm (accessed April 28, 2014).
- Fruin, S., D. Westerdahl, T. Sax, C. Sioutas, and P.M. Fine. 2008. Measurements and predictors of on-road ultrafine particle concentrations and associated pollutants in Los Angeles. Atmos. Environ. 42:207–219. doi:10.1016/j.atmosenv.2007.09.057
- Fujita, E.M., B. Zielinska, D.E. Campbell, W.P. Arnott, and J.C. Chow. 2005. DOE’s Gasoline/Diesel PM Split Study. Paper presented at the California Air Resources Board Chairman’s Pollution Seminar , Sacramento, CA, September 7.
- Gauderman, W.J., H. Vora, R. McConnell, K. Berhane, F. Gilliland, D. Thomas, F. Lurmann, E. Avol, N. Kunzli, M. Jerrett, and J. Peters. 2007. Effect of exposure to traffic on lung development from 10 to 18 years of age: A cohort study. Lancet 369:571–577. doi:10.1016/S0140-6736(07)60037-3
- Grieshop, A.P., E.M. Lipsky, N.J. Pekney, S. Takahama, and A.L. Robinson. 2006. Fine particle emission factors from vehicles in a highway tunnel: Effects of fleet composition and season. Atmos. Environ. 40:287–298. doi:10.1016/j.atmosenv.2006.03.064
- Hagler, G.S.W., E.D. Thoma, and R.W. Baldauf. 2010. High-resolution mobile monitoring of carbon monoxide and ultrafine particle concentrations in a near-road environment. J. Air Waste Manage. Assoc. 60:328–336. doi:10.3155/1047-3289.60.3.328
- Health Effects Institute. 2010. Traffic-Related Air Pollution: A Critical Review of the Literature On Emissions, Exposure, and Health Effects. Boston: Health Effects Institute. Special Report 17, January. http://pubs.healtheffects.org/view.php?id=334 (accessed April 28, 2014).
- Hwang, B.F., Y.L. Lee, Y.C. Lin, J.J. Jaakkola, and Y.L. Guo. 2005. Traffic related air pollution as a determinant of asthma among Taiwanese school children. Thorax 60:467–473. doi:10.1136/thx.2004.033977
- Jansen, K.L., T.V. Larson, J.Q. Koenig, T.F. Mar, C. Fields, J. Stewart, and M. Lippmann. 2005. Associations between health effects and particulate matter and black carbon in subjects with respiratory disease. Environ. Health Perspect. 113:1741–1746. doi:10.1289/ehp.8153
- Janssen, N.A.H., B. Brunekreef, P. van Vliet, F. Aarts, K. Meliefste, H. Harssema, and P. Fischer. 2003. The relationship between air pollution from heavy traffic and allergic sensitization, bronchial hyperresponsiveness, and respiratory symptoms in Dutch schoolchildren. Environ. Health Perspect. 111: 1512–1518. doi:10.1289/ehp.6243
- Laumbach, R.J., and H.M. Kipen. 2012. Respiratory health effects of air pollution: Update on biomass smoke and traffic pollution. J. Allergy Clin. Immunol. 129:3–11. doi:10.1016/j.jaci.2011.11.021
- Lawson, D.R., E.M. Fujita, D.E. Campbell, B. Zielinska, W.P. Arnott, J. Sagebiel, L. Reinhart, J.C. Chow, J. Schauer, C. Christensen, G. Lough, and P.A. Gabele. 2005. Results from DOE’s Gasoline/Diesel PM Split Study—Overview and LD vehicle emissions data. Paper presented at the California Air Resources Board Chairman’s Pollution Seminar, Sacramento, CA, September 7.
- McCarthy, M.C., J.F. Ludwig, S.G. Brown, D.L. Vaughn, and P.T. Roberts. 2013. Filtration effectiveness of HVAC systems at near-roadway schools. Indoor Air 23:196–207. doi:10.1111/ina.12015
- Medina-Ramon, M., R. Goldberg, S. Melly, M.A. Mittleman, and J. Schwartz. 2008. Residential exposure to traffic-related air pollution and survival after heart failure. Environ. Health Perspect. 116:481–485. doi:10.1289/ehp.10918
- National Bureau of Economic Research. 2008. Determination of the December 2007 peak in economic activity. http://www.nber.org/cycles/dec2008.html (accessed April 28, 2014).
- Nevada Department of Transportation. 2007. 2007 annual traffic report. Nevada: Traffic Information Division, Nevada Department of Transportation. http://www.nevadadot.com/About_NDOT/NDOT_Divisions/Planning/Traffic/2007_ Annual_Traffic_Report.aspx (accessed April 28, 2014).
- Nevada Department of Transportation. 2008. 2008 annual traffic report. Nevada: Traffic Information Division, Nevada Department of Transportation. http://www.nevadadot.com/About_NDOT/NDOT_Divisions/Planning/Traffic/2008_ Annual_Traffic_Report.aspx (accessed April 28, 2014).
- Schwartz, J., A. Litonjua, H. Suh, M. Verrier, A. Zanobetti, M. Syring, B. Nearing, R. Verrier, P. Stone, G. MacCallum, F.E. Speizer, and D.R. Gold. 2005. Traffic related pollution and heart rate variability in a panel of elderly subjects. Thorax 60:455–461. doi:10.1136/thx.2004.024836
- South Coast Air Quality Management District. 2000. MATES-II: Multiple Air Toxics Exposure Study in the South Coast Air Basin. Diamond Bar, CA: South Coast Air Quality Management District, March. http://www.aqmd.gov/matesiidf/matestoc.htm (accessed April 28, 2014).
- South Coast Air Quality Management District. 2008. MATES-III: Multiple Air Toxics Exposure Study in the South Coast Air Basin. Diamond Bar, CA: South Coast Air Quality Management District, September. http://www.aqmd.gov/prdas/matesIII/MATESIIIFinalReportSept2008.html (accessed April 28, 2014).
- Timoshek, A., D.S. Eisinger, S. Bai, and D. Niemeier. 2010. Mobile source air toxic emissions: Sensitivity to traffic volume, fleet composition, and average speed. Transport. Res. Rec. 2158:77–85. doi:10.3141/2158-10
- U.S. Energy Information Administration. 2011. Petroleum and other liquids. http://www.eia.gov/dnav/pet/hist/LeafHandler.ashx?n=pet&s=a723650321&f=a (accessed April 28, 2014).
- U.S. Environmental Protection Agency. 2002. Health assessment document for diesel engine exhaust. Washington, DC: National Center for Environmental Assessment, EPA/600/8-90/057F, May. http://www.epa.gov/airtoxics/dieselfinal.pdf (accessed April 28, 2014).
- U.S. Environmental Protection Agency. 2008. Quality assurance handbook for air pollution measurement systems, Volume II: Ambient air quality monitoring program. Research Triangle Park: U.S. Environmental Protection Agency, EPA-454/B-08-003, December. http://www.epa.gov/ttn/amtic/files/ambient/pm25/qa/QA-Handbook-Vol-II.pdf (accessed April 28, 2014).
- Wu, Y.-C., and S.A. Batterman. 2006. Proximity of schools in Detroit, Michigan to automobile and truck traffic. J. Expos. Sci. Environ. Epidemiol. 16: 457–470. doi:10.1038/sj.jes.7500484
- Zhu, Y.F., W.C. Hinds, S. Kim, and C. Sioutas. 2002. Concentration and size distribution of ultrafine particles near a major highway. J. Air Waste Manage. Assoc. 52:1032–1042. doi:10.1080/10473289.2002.10470842