
Abstract
Suspended particulate matter (SPM) and fine particulate matter (less than or equal to 2.5 μm: PM2.5) have generally been decreasing for the last decade in Tokyo, Japan. To elucidate the major cause of this decrease, the authors investigated the different trends of airborne particulates (both SPM and PM2.5 concentrations) by evaluating comparisons based on the location of the monitoring stations (roadside vs. ambient), days of the week (weekdays vs. Sundays), and daily fluctuation patterns (2002 vs. 2010). Hourly mean SPM and PM2.5 concentrations were obtained at four monitoring stations (two roadside stations, two ambient stations) in Tokyo, Japan. Annual mean concentrations of each day of the week and of each hour of the day from 2002 to 2010 were calculated. The results showed that (1) the daily differences in annual mean concentration decreased only at the two roadside monitoring stations; (2) the high hourly mean concentrations observed on weekdays during the daily rush hour at the two roadside monitoring stations observed in 2002 diminished in 2010; (3) the SPM concentration that decreased the most since 2002 was the PM2.5 concentration; and (4) the fluctuation of hourly concentrations during weekdays at the two roadside monitoring stations decreased. A decreasing trend of airborne particulates during the daily rush hour in Tokyo, Japan, was observed at the roadside monitoring stations on weekdays since 2002. The decreasing PM2.5 concentration resulted in this decreasing trend of airborne particulate concentrations during the daily rush hours on weekdays, which indicates fewer emissions were produced by diesel vehicles.
Implications
The authors compared the trends of SPM and PM2.5 in Tokyo by location (roadside vs. ambient), days of the week (weekdays vs. Sundays), and daily fluctuation patterns (2002 vs. 2010). The high hourly mean concentrations observed at the roadside location during rush hour on weekdays in 2002 diminished in 2010. The SPM concentration that decreased during rush hour the most was the PM2.5 concentration. This significant decrease in the PM2.5 concentration resulted in the general decreasing trend of SPM concentrations during the rush hours on weekdays, which indicates fewer emissions were produced from diesel vehicles.
Introduction
Airborne particulate matter concentrations are still high in developing countries, whereas those in developed countries have been decreasing (Holgate et al., Citation1999; World Health Organization [WHO], Citation2006). However, research regarding airborne particulate matter and its impact on public health has shown adverse health effects that are currently experienced by urban populations even in developed countries (WHO, Citation2006). The guideline levels set by the WHO for fine airborne particulate matter with an aerodynamic diameter of less than 2.5 μm (PM2.5) are 10 μg/m3 for the annual mean and 25 μg/m3 for a 24-hr mean. The same guideline levels for PM10 are 20 and 50 μg/m3, respectively (WHO, Citation2006).
Air quality in Japan has improved following the implementation of several air pollution control measures (Ministry of the Environment, Citation2010). Regulations to treat the exhaust gas from vehicles and industrial plants have been effective in controlling atmospheric emissions. However, air pollution problems regarding airborne particulate matter, such as suspended particulate matter (SPM) and PM2.5, still persist. In 2009, new guidelines for PM2.5 concentrations were established as 15 μg/m3 for the annual mean and 35 μg/m3 for the daily mean. This was in addition to the existing guidelines that were introduced in 1973 for SPM, which is defined as airborne particulate matter with an aerodynamic diameter of less than approximately 7 μm (100% cutoff at 10 μm, approximately 50% cutoff at 7 μm) and is slightly different from PM10 (i.e., fine particulate matter with an aerodynamic diameter of less than 10 μm, 50% cutoff at 10 μm). Annual mean SPM concentrations at almost all monitoring stations in the central area of metropolitan Tokyo, Japan, in 2000 were lower than 100 μg/m3, which has been the regulatory guideline level for daily mean SPM concentrations in Japan since 1973 (hourly guideline value: 200 μg/m3). However, some stations still recorded concentrations higher than 50 μg/m3.
In Tokyo, annual mean SPM and PM2.5 concentrations (airborne particulates) have generally been decreasing since monitoring began for both pollutants in 1990 and 2001, respectively. The Tokyo Metropolitan Government and some researchers have already reported decreasing trends in airborne particulate concentrations (Ito and Mizohata, Citation2006; Mizuno and Meguro, Citation2010; Ministry of the Environment, Citation2011a; Tokyo Metropolitan Government, Citation2011a, Citation2011b, Citation2011c) and have attributed these trends to acts or ordinances (Ministry of the Environment, Citation2011a; Tokyo Metropolitan Government, Citation2011b), regulations (Minoura et al., Citation2006; Sasaki and Sakamoto, Citation2006; Pai et al., Citation2007; Mizuno et al., Citation2010; Hara et al., Citation2013), and technological improvements to remove SPM and PM2.5 from exhaust gas (Ministry of the Environment, Citation2011a; Hara et al., Citation2013), and decreasing traffic volume (Hara et al., Citation2013). However, little attention has been paid to the different decreasing trends during each day of the week. To elucidate the major cause of such decreasing trends, we investigated different SPM and PM2.5 concentrations by comparing such values based on the location of monitoring stations (roadside vs. ambient), days of the week (weekdays vs. Sundays), and daily fluctuation patterns (2002 vs. 2010).
Materials and Methods
Source data
Since the 1960s, the Tokyo Metropolitan Government has monitored 16 variables related to air quality, including SPM (PM2.5: since 2001), and five meteorological parameters at numerous monitoring stations since 1999 (Ministry of the Environment, Citation2011b). SPM has been measured by the beta-ray attenuation method (Ministry of the Environment, Citation2011c), which measures beta-ray absorption of SPM collected on glass-fiber filters reinforced with an acrylic resin binder, and PM2.5 has been measured by the tapered element oscillating microbalance (TEOM) method (Ministry of the Environment, Citation2011d). Both monitoring instruments were used at the stations included in the study. Although the two methods proved to be comparable to the reference method (mass measurements via filter sample collections), there are more than likely some uncertainties in the values of the SPM and PM2.5 concentrations (Ministry of the Environment, Citation2011c; Hauck et al., Citation2004; Zhu et al., Citation2007; Li et al., Citation2012). The monitoring data have been made freely available through the Internet (Tokyo Metropolitan Government, 2012a) since 2001.
To confirm the decreasing trends of SPM concentrations in Tokyo, we used annual mean SPM concentrations observed at all the monitoring stations in Tokyo. There are currently 83 air quality monitoring stations in Tokyo, where various pollutants are continuously measured (Ministry of the Environment, Citation2011c; Hara et al., Citation2013). Of these, 35 are classified as roadside monitoring stations, which are adjacent to major roads with heavy traffic. Forty-seven stations are classified as ambient monitoring stations, and are located away from the immediate influence of major roads. One monitoring station is located in a mountainous area for background measurements.
Locations of the four targeted stations
For this study, two areas each with two different types of stations were selected. These four stations began monitoring air pollution earlier than any other station and have monitored PM2.5 since 2001 (Hara et al., Citation2013). The hourly mean concentrations of airborne particulate matter at the four monitoring stations were obtained. Two of the stations are roadside monitoring stations that are located in Umeshima (RS_E), which is in the eastern part of Tokyo, and Kunitachi (RS_W), which is in the western part of Tokyo, and both are in the vicinity of a major national road. The other two stations are ambient monitoring stations that are located in Ayase (AS_E), which is in the eastern part of Tokyo, and Machida (AS_W), which is in the western part of Tokyo, and both are not in the vicinity of a major national road. The annual mean concentrations from 2002 to 2010 were calculated for each day of the week. The distance between areas E and W is approximately 40 km and the distance between RS_E and AS_E is approximately 2 km, whereas the distance between RS_W and AS_W is approximately 15 km. RS_E is adjacent to the major national road Nikko Kaido, and RS_W is adjacent to the major national road Koshyu Kaido. Since the area around RS_E is where many products are carried through to the center of Tokyo, diesel vehicles start moving early in the morning.
The data of the weeks with holidays during the weekdays (Mondays to Fridays) were excluded.
Statistical analysis
Associations between SPM and PM2.5 concentrations at the four stations and among annual mean SPM concentrations of the four stations and other stations from 2002 to 2010 were calculated by the Spearman’s rank correlation coefficient since the distributions of the hourly and daily mean concentrations were log-normal. Annual concentration trends for weekdays and Sundays and annual trends of the maximum and minimum concentration values for weekdays and Sundays at the four stations from 2002 to 2010 were evaluated via the Spearman’s rank correlation coefficient. Fluctuation of the hourly concentrations in 2002 and those in 2010 were examined using the F test.
Statistical analysis was conducted using Excel 2007 (Microsoft, USA) and Statistical Package for the Biosciences (SPBS) version 9.5 (Murata and Yano, 2002). All P values less than 0.05 were considered statistically significant.
Results
Annual trends of SPM concentrations in Tokyo
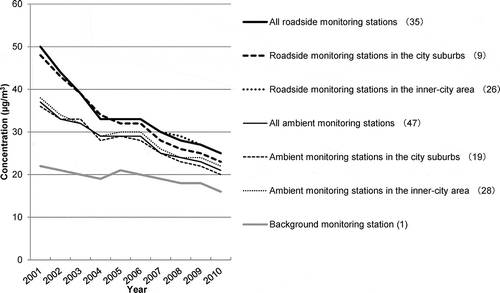
shows the trends of annual mean SPM concentrations from 2001 to 2010 at 35 roadside monitoring stations, 47 ambient monitoring stations, and 1 background monitoring station. Each of these trends shows a decrease (Hara et al., Citation2013). The annual mean SPM concentrations at the roadside monitoring stations decreased greater than those at the ambient monitoring stations. There were statistically positive correlations among the annual mean SPM concentrations at the four monitoring stations and the other monitoring stations (r > 0.95).
Figure 1. Trends of annual mean SPM concentrations at 35 roadside monitoring stations, 47 ambient monitoring stations, and 1 background monitoring station from 2001 to 2010.
Annual mean concentration trends for weekdays and Sundays
The data for Saturdays were excluded to make a clear distinction between each day of the week, since the daily fluctuations of the annual mean concentrations for each hour on Saturdays were similar to those of the other weekdays rather than that on Sundays. There were few differences among the daily fluctuations of the annual mean concentrations for each hour on Mondays to Fridays in each year at each of the four monitoring stations from 2002 to 2010 (data not shown).
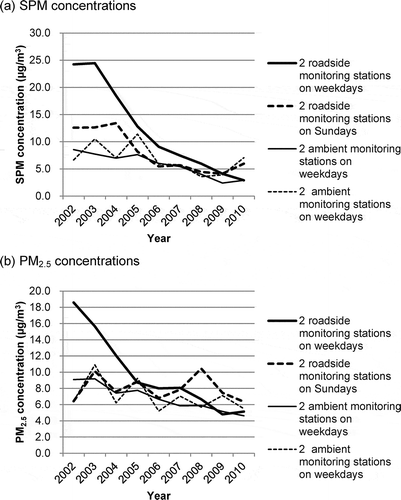
shows the trends of the annual mean SPM and PM2.5 concentrations at two types of monitoring stations on weekdays and on Sundays from 2002 to 2010.
Figure 2. Trends of the annual mean SPM and PM2.5 concentrations at each of the two monitoring stations on weekdays and on Sundays from 2002 to 2010.
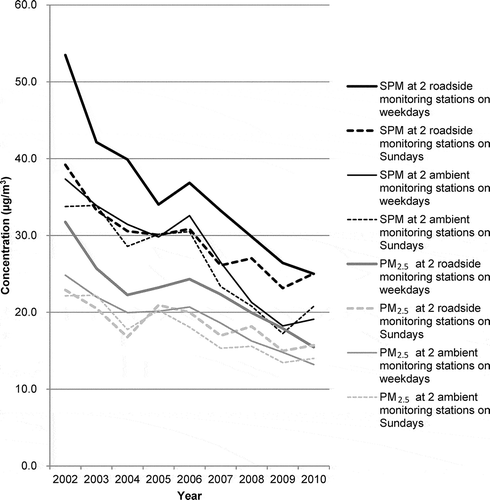
From 2002 to 2010, the annual mean concentrations of SPM (μg/m3) at two roadside and two ambient stations decreased on weekdays from 53.5 to 25.0 and from 37.3 to 19.1, respectively. On Sundays, there was a decrease from 39.2 to 25.0 and from 33.8 to 20.8, respectively.
From 2002 to 2010, the annual mean concentrations of PM2.5 (μg/m3) at two roadside and two ambient stations decreased on weekdays from 31.7 to 15.5 and from 24.8 to 13.2, respectively. On Sundays, there was a decrease from 22.9 to 15.7 and from 22.1 to 14.0, respectively.
The annual mean SPM and PM2.5 concentrations at each of the two types of monitoring stations on weekdays and Sundays have decreased, and the concentrations at the two roadside monitoring stations on weekdays and Sundays decreased by a proportionately greater amount than those at the two ambient stations.
Between weekdays and Sundays there were only statistically significant decreasing trends for the differences in annual mean concentrations at the two roadside monitoring stations from 2002 to 2010. For each of the four monitoring stations, the Spearman’s rank correlation coefficients between the years and the values of the annual mean concentrations on weekdays minus those on Sundays from 2002 to 2010 were −0.917 (SPM, RS_W), −0.795 (PM2.5, RS_W), −0.733 (SPM, RS_E), and −0.733 (PM2.5, RS_E).
Daily fluctuation trends for the two roadside stations
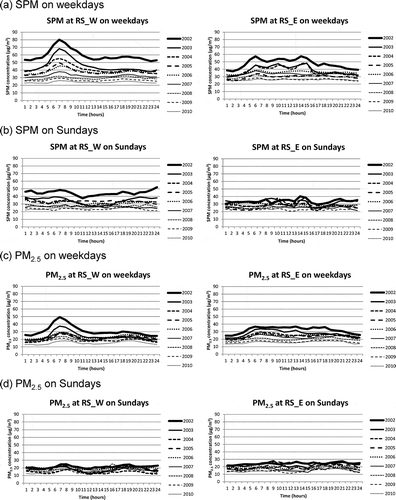
shows the trends of the daily fluctuations of the annual mean SPM and PM2.5 concentrations for each hour at the two roadside monitoring stations on weekdays and Sundays from 2002 to 2010. The range (maximum minus minimum) of the annual mean concentrations at the two roadside monitoring stations decreased from 2002 to 2010. The high annual mean concentrations on weekdays during the daily rush hours at the RS_W roadside monitoring station and during the daily rush hours and business hours (from 4:00 a.m. to 6:00 p.m. at RS_E) in 2002 decreased by the year 2010. The difference between the highest and lowest hourly mean SPM concentrations on weekdays in 2002 at RS_W was approximately 28 μg/m3 and that at RS_E was approximately 20 μg/m3. However, these trends were not found for the two ambient monitoring stations.
Figure 3. Trends of the daily fluctuations of annual mean SPM and PM2.5 concentrations for each hour at the two roadside monitoring stations from 2002 to 2010. SPM concentrations on (a) weekdays and (b) Sundays for (left) RS_W and (right) RS_E. PM2.5 concentrations on (c) weekdays and (d) Sundays for (left) RS_W and (right) RS_E.
Statistical evaluation of the two roadside stations
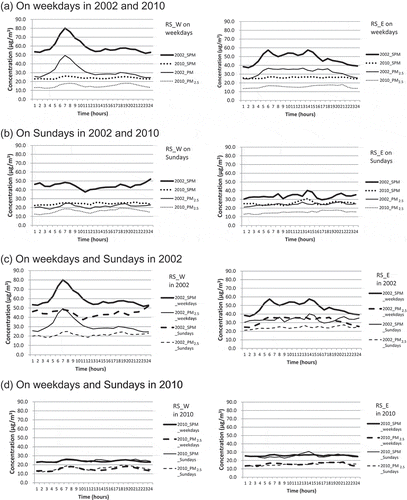
shows that the hourly annual mean concentrations for 2002 and 2010 on (a) weekdays and (b) Sundays, and for weekdays and Sundays (c) in 2002 and (d) 2010 at the two roadside monitoring stations (RS_W and RS_E).
Figure 4. Annual mean SPM and PM2.5 concentrations of each hour in 2002 and 2010 on (a) weekdays and (b) Sundays, and on weekdays and Sundays in (c) 2002 and (d) 2010 at the two roadside monitoring stations (RS_W and RS_E).
To clarify the effects of PM2.5 decrease on SPM decrease from 2002 to 2010, we first calculated average annual PM2.5 concentrations and average annual SPM concentrations using hourly values from 2002 and 2010. Next, the ratio of “decrease in PM2.5 concentration” from 2002 to 2010 was calculated by subtracting average annual 2010 PM2.5 concentrations from average annual 2002 PM2.5 concentrations. We then calculated the ratio of “decrease in SPM concentration” using the same method. Finally, we calculated the ratio of “decrease in PM2.5 concentrations” to “decrease in SPM concentrations.” The ratio of “decrease in PM2.5 concentrations” to “decrease in SPM concentrations” from 2002 to 2010 at RS_W was 0.45 (16.0 [μg/m3]/35.2 [μg/m3]); at RS_E, this was 0.76 (16.6 [μg/m3]/21.7 [μg/m3]).
Subsequently, “average hourly PM2.5 concentrations during the period of high values” and “average hourly SPM concentrations during the period of high values” were calculated during 2002 weekday rush and business hours. At RS_W, “average hourly PM2.5 concentrations during the period of high values” and “average hourly SPM concentrations during the period of high values” were calculated by averaging the difference between each 2002 average hourly value and the average hourly value at 1:00 a.m. (assuming that the concentration at 1:00 a.m. represents baseline conditions) from 1:00 a.m. to 12:00 a.m. At RS_E, “average hourly PM2.5 concentrations during the period of high values” and “average hourly SPM concentrations during the period of high values” were calculated by averaging the difference between each 2002 average hourly value and the average hourly value at 4:00 a.m. (assuming that the concentration at 4:00 a.m. represents baseline conditions) from 4:00 a.m. to 6:00 p.m. Then, the ratio of “average hourly PM2.5 concentrations during the period of high values” to “average hourly SPM concentrations during the period of high values” during 2002 rush and business hours was calculated. The 2002 ratio of “average hourly PM2.5 concentrations during the period of high values” to “average hourly SPM concentrations during the period of high values” (assuming that the concentration at 1:00 a.m. represents the baseline concentration) at RS_W from 1:00 a.m. to 12:00 a.m. was 0.92 (9.0 [μg/m3]/9.8 [μg/m3]), and that (assuming that the concentration at 4:00 a.m. represents baseline conditions) at RS_E from 4:00 a.m. to 6:00 p.m. was 0.86 (6.1 [μg/m3]/7.1 [μg/m3]).
shows annual means and standard deviations (SDs) of hourly concentrations at the four monitoring stations and the P values of the F test. In the F test, fluctuations of hourly concentrations were defined as deviations, and these were compared under each condition mentioned in the table to obtain P values. There were statistically significant differences between the these deviations of the hourly SPM and PM2.5 concentrations for each hour in 2002 and 2010 on weekdays at the four monitoring stations and that of hourly SPM concentrations for each hour on Sundays at one roadside monitoring station (F test, P < 0.001). There were statistically significant differences between the these deviations of the (1) hourly concentrations for each hour on weekdays and Sundays at the four monitoring stations in 2002; (2) the hourly SPM concentrations for each hour at the two roadside monitoring stations and one ambient monitoring station (AS_E) in 2010; and (3) the hourly PM2.5 concentrations for each hour at one roadside monitoring station (RS_E) and one ambient monitoring station (AS_E) in 2010 (F test, P < 0.05).
Table 1. Annual means and standard deviations (SDs) of hourly SPM and PM2.5 concentrations for each hour at the four monitoring stations and P values of the F test
shows the range (maximum minus minimum) of the annual mean concentrations for each hour on weekdays and Sundays at the four monitoring stations from 2002 to 2010. These values decreased on weekdays at the two roadside stations throughout this time period. However, the trends at the two roadside monitoring stations on Sundays and especially those at the two ambient monitoring stations, for both weekdays and Sundays, were unclear.
Figure 5. Trends of the range (maximum minus minimum) of annual mean (a) SPM and (b) PM2.5 concentrations for each hour on weekdays and Sundays at the four monitoring stations from 2002 to 2010.
shows the Spearman’s rank correlation coefficients between the years and the range of the annual mean SPM and PM2.5 concentrations on weekdays and Sundays at the four monitoring stations from 2002 to 2010. For the two roadside monitoring stations, there were statistically significant negative correlations between the years and the range of the annual mean SPM and PM2.5 concentrations on weekdays and between the years and the range of the annual mean SPM concentrations on Sundays from 2002 to 2010, suggesting a decreasing trend of variance of the annual mean concentrations. For the two ambient monitoring stations, there were also statistically significant negative correlations between the years and the range of the annual mean SPM concentrations on weekdays and between the years and the range of the annual mean PM2.5 concentrations at one ambient monitoring station on weekdays, again, suggesting a decreasing trend of variance of the annual mean concentrations.
Table 2. Correlation between the years and range (maximum minus minimum) of hourly mean SPM and PM2.5 concentrations at the four monitoring stations from 2002 to 2010
Discussion
The annual mean concentrations have decreased from 2002 to 2010. The decrease in the SPM concentration during this 9-yr period was greater than that of the PM2.5 concentration. The annual mean SPM and PM2.5 concentrations at the roadside monitoring stations had a greater decrease than those at the ambient monitoring stations. The daily fluctuations of the annual mean concentrations for each hour at the two roadside monitoring stations on weekdays decreased from 2002 to 2010. The high concentrations during the daily rush hours and business hours observed in 2002 diminished in 2010. The ratios of the decrease in PM2.5 concentration to the decrease in SPM concentration for 2002 and 2010 were 45% and 76%, respectively, suggesting that there are other large causes of such decreasing trends other than the diminishing peak during the daily rush hours and business hours. However, the ratios of the “average hourly PM2.5 concentrations during the period of high values” to the “average hourly SPM concentrations during the period of high values” on weekdays in 2002 at the two roadside monitoring stations were 92% and 86%, suggesting there were similarities between the shapes of the “average hourly SPM concentrations during the period of high values” and the “average hourly PM2.5 concentrations during the period of high values” during the daily rush hours at RS_W and during the daily rush hours and business hours at RS_E on weekdays in 2002. On the other hand, for the two ambient monitoring stations, such trends at the two roadside monitoring stations were unclear. These results suggest that the main cause of the decreasing high concentrations during the daily rush hours and business hours observed at the roadside monitoring stations on weekdays since 2002 was the lowered PM2.5 emissions during the daily rush hours and business hours in Tokyo.
Several researchers have previously reported that diesel vehicles are the main source of PM2.5 along the roadsides of Japan by analyzing and comparing various components, such as organic carbon, elemental carbon, and/or polycyclic aromatic carbons, with the components of the exhaust gas of the diesel vehicles (Karasawa, Citation2003; Kume et al., 2003; Sasaki and Sakamoto, Citation2005, Citation2006; Minoura et al., Citation2006; Naser et al., Citation2008; Takahashi et al., Citation2008; Fujitani et al., Citation2012). Our results suggest that the decreasing PM2.5 concentration mainly induced this decreasing trend of airborne particulate matter concentrations during the daily rush hours and business hours on weekdays, which indicates that fewer emissions were produced by diesel vehicles.
Overall SPM and PM2.5 concentrations have decreased from 2002 to 2010. Although the daily fluctuations of the annual concentrations for each hour at RS_W on Sundays in 2003 were different from those on Sundays in other years, the reason was not identified. There were no available data for the volume of traffic at Kunitachi (roadside: RS_W) and Umeshima (roadside: RS_E) from 2002 to 2010. Hara et al. (Citation2013) suggested that decreasing traffic volumes, particularly those of diesel trucks, in Tokyo have contributed considerably to the reduction in SPM and PM2.5 concentrations, in addition to the effects of stricter governmental regulations and technological improvements to the design of engines. Even though the reason for this discrepancy was unclear, since the main sources of SPM and PM2.5 at the roadside areas were cars, especially diesel engine cars, these results also suggest that a decrease in the amount of traffic volume, improvements to vehicle engine performance including the fitting of devices for exhaust emission reduction, and the improved traffic system in Tokyo can all be factors that lead to the reduction of the differences between airborne particulate matter on weekdays and Sundays. However, to elucidate the most effective factors, further studies are needed.
The data for Saturdays were excluded, since the daily fluctuations of the annual mean concentrations for each hour on Saturdays were similar to those of other weekdays rather than that on Sundays. This may be due to the volume of traffic, since many companies are in operation on Saturdays as well.
There have been only a few studies dealing with the differences of airborne particulate matter between weekdays and Sundays. Motallebi et al. (Citation2003) showed that PM concentrations exhibit a weekly pattern, with the maximum occurring late in the workweek and the minimum occurring on weekends (especially on Sundays); however, this pattern did not prevail at all of the study’s sites and areas in California, USA. Gietl and Klemm (Citation2009) showed that the highest mean PM10 mass concentration was on Friday and the lowest was on Sunday. Lioy et al. (Citation2011) showed that a highly polluted city area had higher PM2.5 concentrations on weekdays than on weekends in New Jersey, USA. Harley et al. (2005) showed that diesel truck emissions decreased by 60–80% on weekdays and that element carbon concentrations decreased on weekends, as expected. By examining aerosol concentrations at remote and rural sites in the USA, Murphy et al. (Citation2008) showed that elemental carbon concentrations decreased on Sundays. Lin et al. (Citation2010) showed that during weekdays and weekends in Taiwan, the roadside PM2.5 concentrations correlated well with traffic flow, but the roadside PM2.5-10 concentrations did not. Kulshrestha et al. (Citation2009) found that lower particulate pollutant levels were observed during weekends in the northern part of India. Blanchard et al. (Citation2008) showed statistically significant decreases in PM nitrate on Sundays at one site and significant increases at seven sites in the USA. These results were comparable with our results for 2002, but were not so similar with our results for 2010.
Although the results of the present study are mainly based on the data from only 4 of the 83 monitoring stations in Tokyo, the results obtained in this study are considered to be representative of the entire Tokyo metropolitan area, since correlations were identified between the SPM concentrations of the 83 monitoring stations and the 4 monitoring stations used in this study. Furthermore, although there are some uncertainties in the values of the SPM and PM2.5 concentrations, the results suggest that the concentrations of airborne particulate matter have decreased since 2002. However, despite the improvements in general air quality, the PM2.5 concentrations in some parts of Tokyo still exceed the guideline values implemented by the WHO.
Conclusion
In Tokyo, the annual mean concentrations of airborne particulate matter have decreased between 2002 and 2010. The annual mean concentrations have especially declined at the roadside stations since 2002. The trends of the annual mean concentrations differed between weekdays and Sundays. The main reason for the decreasing airborne particulate concentrations during the daily rush hours at the roadside monitoring stations on weekdays since 2002 was the lowered PM2.5 concentrations, indicating that fewer emissions are produced from diesel vehicles.
Additional information
Notes on contributors
Kunio Hara
Kunio Hara is a professor, Junichi Homma is a research scholar, Mariko Inoue is an associate professor (lecturer), and Eiji Yano is a professor at Teikyo University, Graduate School of Public Health, Tokyo, Japan.
Junichi Homma
Kunio Hara is a professor, Junichi Homma is a research scholar, Mariko Inoue is an associate professor (lecturer), and Eiji Yano is a professor at Teikyo University, Graduate School of Public Health, Tokyo, Japan.
Kenji Tamura
Kenji Tamura and Yoshinori Kondo are head researchers at National Institute for Environmental Studies, Tsukuba, Japan.
Mariko Inoue
Kunio Hara is a professor, Junichi Homma is a research scholar, Mariko Inoue is an associate professor (lecturer), and Eiji Yano is a professor at Teikyo University, Graduate School of Public Health, Tokyo, Japan.
Kanae Karita
Kanae Karita is an associate professor at Kyorin University, School of Medicine, Tokyo, Japan.
Yoshinori Kondo
Kunio Hara is a professor, Junichi Homma is a research scholar, Mariko Inoue is an associate professor (lecturer), and Eiji Yano is a professor at Teikyo University, Graduate School of Public Health, Tokyo, Japan.
Eiji Yano
Kunio Hara is a professor, Junichi Homma is a research scholar, Mariko Inoue is an associate professor (lecturer), and Eiji Yano is a professor at Teikyo University, Graduate School of Public Health, Tokyo, Japan.
References
- Blanchard, C.L., S. Tanenbaum, and D.R. Lawson. 2008. Differences between weekday and weekend air pollutant levels in Atlanta; Baltimore; Chicago; Dallas-Fort Worth; Denver; Houston; New York; Phoenix; Washington, DC; and surrounding areas. J. Air Waste Manage. Assoc. 58:1598–1615. doi:10.3155/1047-3289.58.12.1598
- Fujitani, Y., T. Sakamoto, and K. Misawa. 2012. Quantitative determination of composition of particle type by morphology of nanoparticles in diesel exhaust and roadside atmosphere. J. Civil Environ. Eng. S1:002. doi:10.4172/2165-784X.S1-002
- Gietl, J.K., and O. Klemm. 2009. Analysis of traffic and meteorology on airborne particulate matter in Münster, northwest Germany. J. Air Waste Manage. Assoc. 59:809–818. doi:10.3155/1047-3289.59.7.809
- Hara, K., J. Homma, K. Tamura, M. Inoue, K. Karita, and E. Yano. 2013. Decreasing trends of suspended particulate matter and PM2.5 concentrations in Tokyo during 1990–2010. J. Air Waste Manage. Assoc. 63:737–748. doi:10.1080/10962247.2013.782372
- Hauck, H., A. Berner, B. Gomišcek, S. Stopper, H. Puxbaum, M. Kundi, and O. Preining. 2004. On the equivalence of gravimetric PM data with TEOM and beta-attenuation measurements. J. Aerosol Sci. 35:1135–1149. doi:10.1016/j.jaerosci.2004.04.004
- Holgate, S., J. Samet, H. Koren, and R. Maynard. 1999. Air Pollution and Health, 1st ed. London: Academic Press.
- Ito, N., and A. Mizohata. 2006. Long term (1986–2004) observation of atmospheric aerosols at Sakai, Osaka [in Japanese]. J. Aerosol Res. 21:297–304.
- Karasawa, M. 2003. Time and space variations of main species concentration of fine particulates in the Kanto region. In R&D Review of Toyota CRDL, Vol. 38, 148–156. http://www.tytlabs.com/english/review/rev381epdf/e381_048karasawa.pdf (accessed October 29, 2013).
- Kulshrestha, A., P.G. Satsangi, J. Masih, and A. Taneja. 2009. Metal concentration of PM(2.5) and PM(10) particles and seasonal variations in urban and rural environment of Agra, India. Sci. Total Environ. 407:6196–6204. doi:10.1016/j.scitotenv.2009.08.050
- Kume, K., T. Ohura, T. Noda, T. Amagai, and M. Fusaya. 2007. Seasonal and spatial trends of suspended-particle associated polycyclic aromatic hydrocarbons in urban Shizuoka, Japan. J. Hazard. Mater. 144:513–521. doi:10.1016/j.jhazmat.2006.10.079
- Li, Q.F., L. Wang-Li, Z. Liu, and A.J. Heber. 2012. Field evaluation of particulate matter measurements using tapered element oscillating microbalance in a layer house. J. Air Waste Manage. Assoc. 62:322–335. doi:10.1080/10473289.2011.650316
- Lin, W.Y., C.C. Lin, K.L. Huang, J.J. Hsu, J.Y. Chiang, J.H. Tsai, C.H. Chiu, J.Y. Chiu, and S.J. Chen. 2010. Effect of traffic loading on particle-bound water-soluble ions and carbons collected near a busy road and at an urban site. J. Environ. Sci. Health A Toxic Hazard. Subst. Environ. Eng. 45:1839–1849. doi:10.1080/10934529.2010.520505
- Lioy, P.J., Z. Fan, J. Zhang, P. Georgopoulos, S.W. Wang, P. Ohman-Strickland, X. Wu, X. Zhu, J. Harrington, X. Tang, Q. Meng, K.H. Jung, J. Kwon, M. Hernandez, L. Bonnano, J. Held, J. Neal, and HEI Health Review Committee. 2011. Personal and ambient exposures to air toxics in Camden, New Jersey. Res. Rep. Health Eff. Inst. (160): 3–127 discussion: 129–151.
- Ministry of the Environment. 2010. White Paper. http://www.env.go.jp/en/wpaper/ (accessed November 27, 2011).
- Ministry of the Environment. 2011a. Pamphlet about the law concerning special measures for total emission on reduction of nitrogen oxides and particulate matter [in Japanese]. http://www.env.go.jp/air/car/pamph/index.html (accessed November 27, 2011).
- Ministry of the Environment. 2011b. Atmospheric Environmental Regional Observation System [in Japanese]. http://soramame.taiki.go.jp/Index.php (accessed November 27, 2011).
- Ministry of the Environment. 2011c. Air pollution and vehicle measures. Manual on air pollution continuous survey [in Japanese]. http://www.env.go.jp/air/osen/manual_6th/00cover.pdf (accessed November 27, 2011).
- Ministry of the Environment. 2011d. Air pollution and vehicle measures [in Japanese]. http://www.env.go.jp/air/report/h19-03/manual/m02.pdf (accessed 27 November 27, 2011).
- Minoura, H., K. Takahashi, J.C. Chow, and J.G. Watson. 2006. Multi-year trend in fine and coarse particle mass, carbon, and ions in downtown Tokyo, Japan. Atmos. Environ. 40:2478–2487. doi:10.1016/j.atmosenv.2005.12.029
- Mizuno, T., and Y. Meguro. 2010. Contribution of cars to NOx and SPM concentrations and their changes, estimated using data from air quality monitoring stations and traffic census in Tokyo wards area [in Japanese]. J. Jpn. Soc. Atmos. Environ. 45:117–125.
- Motallebi, N., H. Tran, B.E. Croes, and L.C. Larsen. 2003. Day-of-week patterns of particulate matter and its chemical components at selected sites in California. J. Air Waste Manage. Assoc. 53:876–888. doi:10.1080/10473289.2003.10466229
- Murata, K., and E. Yano. 2000. Medical Statistic for Evidence Based Medicine [in Japanese]. Tokyo: Nankodo.
- Murphy, D.M., S.L. Capps, J.S. Daniel, G.J. Frost, and W.H. White. 2008. Weekly patterns of aerosol in the United States. Atmos. Chem. Phys. 8:2729–2739. doi:10.5194/acp-8-2729-2008
- Naser, T.M., Y. Yoshimura, K. Sekiguchi, Q. Wang, and K. Sakamoto. 2008. Chemical Composition of PM2.5 and PM10 and associated polycyclic aromatic hydrocarbons at a roadside and an urban background area in Saitama, Japan. Asian J. Atmos. Environ. 2:90–101. doi:10.5572/ajae.2008.2.2.090
- Pai, T.-Y., K. Hanaki, H. Ho, and C. Hsieh. 2007. Using grey system theory to evaluate transportation effects on air quality trends in Japan. Transport. Res. D Transport Environ. 12:158–166. doi:10.1016/j.trd.2007.01.007
- Sasaki, K., and K. Sakamoto. 2005. Vertical differences in the composition of PM10 and PM2.5 in the urban atmosphere of Osaka, Japan. Atmos. Environ. 39:7240–7250. doi:10.1016/j.atmosenv.2005.09.004
- Sasaki, K., and K. Sakamoto. 2006. Diurnal characteristics of suspended particulate matter and PM2.5 in the urban and suburban atmosphere of the Kanto Plain, Japan. Water Air Soil Pollut. 171:29–47. doi:10.1007/s11270-005-9011-z
- Takahashi, K., H. Minoura, and K. Sakamoto. 2008. Chemical composition of atmospheric aerosols in the general environment and around a trunk road in the Tokyo metropolitan area. Atmos. Environ. 42:113–125. doi:10.1016/j.atmosenv.2007.09.009
- Tokyo Metropolitan Government. 2011a. Regulations on diesel vehicle emission. http://www.kankyo.metro.tokyo.jp/en/automobile/diesel.html (accessed November 27, 2011).
- Tokyo Metropolitan Government. 2011b. Introducing diesel vehicle control. http://www.kankyo.metro.tokyo.jp/en/attachement/diesel_vehicle.pdf (accessed November 27, 2011).
- Tokyo Metropolitan Government. 2011c. The environment of Tokyo 2008. http://www.kankyo.metro.tokyo.jp/kouhou/english/2008/air/air01.html (accessed November 27, 2011).
- World Health Organization. 2006. Air quality guidelines for particulate matter, ozone, nitrogen dioxide and sulfur dioxide. Global update 2005. http://www.who.int/phe/health_topics/outdoorair_aqg/en/ (accessed November 27, 2011).
- Zhu, K., J. Zhang, and P.J. Lioy. 2007. Evaluation and comparison of continuous fine particulate matter monitors for measurement of ambient aerosols. J. Air Waste Manage. Assoc. 57:1499–1506. doi:10.3155/1047-3289.57.12.1499