
Abstract
Air quality in Cyprus is influenced by both local and transported pollution, including desert dust storms. We examined PM10 concentration data collected in Nicosia (urban representative) from April 1, 1993, through December 11, 2008, and in Ayia Marina (rural background representative) from January 1, 1999, through December 31, 2008. Measurements were conducted using a Tapered Element Oscillating Micro-balance (TEOM). PM10 concentrations, meteorological records, and satellite data were used to identify dust storm days. We investigated long-term trends using a Generalized Additive Model (GAM) after controlling for day of week, month, temperature, wind speed, and relative humidity. In Nicosia, annual PM10 concentrations ranged from 50.4 to 63.8 μg/m3 and exceeded the EU annual standard limit enacted in 2005 of 40 μg/m3 every year. A large, statistically significant impact of urban sources (defined as the difference between urban and background levels) was seen in Nicosia over the period 2000–2008, and was highest during traffic hours, weekdays, cold months, and low wind conditions. Our estimate of the mean (standard error) contribution of urban sources to the daily ambient PM10 was 24.0 (0.4) μg/m3. The study of yearly trends showed that PM10 levels in Nicosia decreased from 59.4 μg/m3 in 1993 to 49.0 μg/m3 in 2008, probably in part as a result of traffic emission control policies in Cyprus. In Ayia Marina, annual concentrations ranged from 27.3 to 35.6 μg/m3, and no obvious time trends were observed. The levels measured at the Cyprus background site are comparable to background concentrations reported in other Eastern Mediterranean countries. Average daily PM10 concentrations during desert dust storms were around 100 μg/m3 since 2000 and much higher in earlier years. Despite the large impact of dust storms and their increasing frequency over time, dust storms were responsible for a small fraction of the exceedances of the daily PM10 limit.
Implications
This paper examines PM10 concentrations in Nicosia, Cyprus, from 1993 to 2008. The decrease in PM10 levels in Nicosia suggests that the implementation of traffic emission control policies in Cyprus has been effective. However, particle levels still exceeded the European Union annual standard, and dust storms were responsible for a small fraction of the daily PM10 limit exceedances. Other natural particles that are not assessed in this study, such as resuspended soil and sea salt, may be responsible in part for the high particle levels.
Introduction
The Eastern Mediterranean basin experiences high particulate matter (PM) levels from sources such as traffic, sea salt, dust resuspension, and emissions from industrialized European countries (Dayan et al., Citation1991; Kubilay and Saydam, Citation1995; Güllü et al., Citation2000; Kubilay et al., Citation2000; Querol et al., Citation2009). The area is also impacted hugely by desert dust storms originating mostly from North Africa and to a lesser extent from the Arabian Peninsula (Ganor et al., Citation1991; Kleanthous et al., Citation2009; Bari et al., 2009; Querol et al., Citation2009). During these events, which can last for several days, PM10 (particulate matter with aerodynamic diameter less than 10 μm) concentrations are considerably higher than the 2005 European Union (EU) daily limit value of 50 μg/m3 (Rodriquez et al., 2001; Koçak et al., Citation2007; Mitsakou et al., Citation2008; Querol et al., Citation2009). A number of epidemiological studies have associated exposure to ambient PM10 during desert dust outbreaks with increased cardiovascular and respiratory hospital admissions or even mortality (Bell et al., Citation2008; Middleton et al., Citation2008; Grineski et al., Citation2011; Mallone et al., Citation2011; Barnett et al., Citation2012; Kashima et al., Citation2012; Neophytou et al., Citation2013).
In Cyprus, an island sited in the eastern Mediterranean, a prior study reported relatively high concentrations for nitrogen dioxide (NO2), benzene, and PM in urban areas, and ozone (O3) in the mountainous areas (Baumbach and Pfeiffer, Citation2004). PM10 levels were previously reported to be much higher in Cyprus compared to other European countries and they exceeded the EU air quality standards (Baumbach and Pfeiffer, Citation2004; Kleanthous et al., Citation2009). The national action plan for the improvement of ambient air quality in Cyprus considers pollution derived from industrial sites, cars, central heating, airplanes, ships, and even natural sources. For this purpose, the Cypriot Ministry of Labour and Social Insurance is monitoring the air quality continuously at different sites across the island. While monitoring of PM pollution begun about two decades ago, there has been no assessment to evaluate long-term trends in Cyprus air quality until now.
This study describes the PM10 concentrations in an urban (Nicosia—capital city) and a background (Ayia Marina) monitoring sites in Cyprus and evaluates the pollution trends, impact of changes in fuel use, and frequency of desert dust storm events over a 16-year study period (1993–2008). In addition, it examines the diurnal, weekday, and seasonal variations of urban PM10 concentrations.
Material and Methods
Monitoring sites description
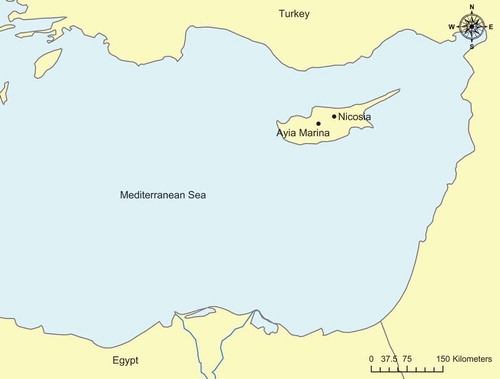
We used PM10 data from an urban representative site at the Old General Hospital in Nicosia (35°10’19.2’’ N, 33°21’10.8’’ E) and a rural background representative site in Ayia Marina Xyliatou village (35º02’08’’ N, 33º03’26’’ E). Ayia Marina is located in the Nicosia district, approximately 40 km southwest of the city, and is situated 450 m above sea level (). Both sites are located in the inland area and experience hot dry summers and mild winters. Over the eastern Mediterranean, surface winds are mostly westerly or southwesterly in the winter and northwesterly or northerly in the summer. Over Cyprus winds are quite variable in direction and strength, and they are influenced by (a) eastward-moving cyclones crossing the Mediterranean Sea, the continental anticyclone of Eurasia, the low-pressure belt of North Africa in the winter, and the Indian monsoon low in the summer; (b) orography; and (c) large temperature differences between land and sea (sea and land breezes). The annual mean wind speed in inland locations (3–5 m/s) is lower than those in coastal (2–6 m/s) and mountainous areas (5–7 m/s). The prevailing wind directions are south or southwesterlies during the day and northwesterlies or northeasterlies during the night (Paschardes and Christofides, Citation1995). On average, Ayia Marina is downwind of Nicosia during the night and the opposite effect occurs during the day.
Figure 1. Location of the two measuring sites: Nicosia (urban) and Ayia Marina (background).
Nicosia Old General Hospital and Ayia Marina Xyliatou were characterized as “traffic” and “background” representative sites, respectively, by the Department of Labour Inspection (DLI), Ministry of Labour and Social Insurance. This characterization is according to the criteria set by Cyprus and European Union legislation (Ambient Air Quality Law of 2002 (Ν.188(Ι)/2002), Ambient Air Quality (96/62/EC)). The Ayia Marina background monitoring station is included in the network of the Co-operative Program for Monitoring and Evaluation of the Long-range Transmission of Air Pollutants in Europe (EMEP). This site is mostly impacted by transported pollution reaching Cyprus and to a lesser extent by sea salt and local soil dust (Kleanthous et al., Citation2007). The reported lack of morning and evening concentration peaks provided some evidence that this site is not impacted by local traffic.
Data collection
Hourly PM10 concentrations at these two sites were monitored using a Tapered Element Oscillating Micro-balance (TEOM) and were obtained from the DLI. Data from the Nicosia urban site were available from April 1, 1993, through December 11, 2008; however, data from the Ayia Marina background site were only available from January 1, 1999, through December 31, 2008. For both sites, daily PM10 averages were calculated for days with at least 12 hourly measurements. DLI refers to the European, EN 12341, filter-based gravimetric reference method for the calibration of TEOM PM10 measurements. For a more detailed description of the reference method and the sampling equipment, the reader is referred to the Baumbach and Pfeiffer (Citation2004) report.
Assuming that the impact of transported particles and local natural particles, such as soil and sea salt, is the same at the urban and background sites, then concentration differences between these two sites reflect the minimum impact of Nicosia urban sources on PM10 concentration levels in Nicosia. Therefore, we calculated the concentration differences for each hourly data point for which we had measurements from both sites and created a new variable, “PM10 urban source contributions.” Daily PM10 averages for the urban contributions were also calculated. A similar approach was previously used to assess the impact of urban sources in Spain (Moreno et al., Citation2005).
Meteorological data including temperature, relative humidity, wind speed, precipitation, and dew point were also obtained for the duration of the study from the Nicosia (Athalassa) meteorological station (Cyprus Meteorological Service).
Desert dust storms identification
We referred to procedures described in the 2002 European Commission report, “Guidance to Member States on PM10 Monitoring and Inter-Comparisons With the Reference Method,” to identify high PM10 levels associated with dust storm events. We also used a combination of approaches to identify desert dust storm events as follows:
We defined days of “high PM10 levels” as the days with mean daily concentration above the 95th percentile value of 100 and 50 μg/m3 in Nicosia and Ayia Marina, respectively.
We used records for days of noted poor visibility due to suspended dust from observations at the Larnaca airport (code 06), provided by Cyprus Meteorological Service.
We used daily measurements of SeaWiFS (Sea-viewing Wide Field-of-view Sensor) aerosol optical depth (AOD) and Angstrom exponent values for 1998–2008 from the Giovanni online data system, developed and maintained by the National Aeronautics and Space Administration, Goddard Earth Sciences Data, and Information Services Center. High AOD values indicate high total atmospheric column particle concentrations and low Angstrom exponent reflects coarse particle size. A combination of high AOD (>0.3) values and a low Angstrom exponent (<0.9) was used as an indication of the presence of desert dust particles. A similar AOD cutoff value for dust storms was suggested in the analysis of Saharan dust particles from MODIS data over Mediterranean region from Barnaba and Gobbi (Citation2004).
We confirmed dust storm events originating from the Sahara or the Arabian Peninsula by examining the 5-day back-wind trajectories reaching the urban and background sites using the HYSPLIT (Hybrid Single-Particle Lagrangian Integrated Trajectory) model to track the possible dust source (Draxler and Rolph, Citation2013). Back-trajectories were calculated for three different altitudes (500, 750, and 1000 m above ground level [A.G.L.]) using isentropic meteorological models. Satellite images from the Moderate Resolution Imaging Spectroradiometer (MODIS) Atmosphere were also used as an additional tool to verify dust events.
Other desert dust storm identification approaches reported in the 2002 European Commission report and successfully applied by other investigators, involve the use of PM2.5 (particulate matter less than 2.5 μm) and total suspended particles (TSP) or PM10 measurements and elemental speciation analysis data (Querol et al., Citation1998; Querol et al., Citation2001; Amodio et al., Citation2008; Amodio et al., Citation2011). However, these approaches were not applicable in our investigation, which relied entirely on hourly PM10 measurements (from TEOM). PM10 chemical speciation data and simultaneous PM2.5 or TSP measurements were also not available. Finally, neither satellite nor PM10 background concentration data were available for the period 1993–1997, and thus we started using satellite and background data after 1997. We would expect that we missed some dust storm days and therefore our estimates of dust contribution for the earlier years might underestimate the real contribution.
Data analysis
Annual and monthly dust effect
We used linear regression analysis to estimate the yearly (eq 1) and monthly (eq 2) impacts of dust storms on daily PM10 concentrations, separately for Nicosia and Ayia Marina, as follows:
where μi is the PM10 concentration on a day i, β0 is the regression intercept, and β1d, β2j, β3k, β3j, and β4k are the regression coefficients for the categorical variables: day of the week (dowd, d = 1–7 [Sunday to Saturday]), month of the year (monthj, j = 1–12 [January to December]), year (yeark, k = 1993–2008 [Nicosia] or 1999–2008 [Ayia Marina]), and the interaction term of month (or year) and desert dust storm day (dusti: 1 if day i was a desert dust storm day, 0 otherwise). The reference day, month, and year were set as Saturday, December, and 2008, respectively.
To estimate the contributions of desert dust storm days to the yearly concentrations we used model 1 to predict yearly averages for days with desert dust storms, and subsequently, we multiplied them by the fraction of desert dust storm days for the respective year k, fk = (number of desert dust storm days in year k)/365. We estimated the contribution of non-dust storm days to the yearly average in the same way. Finally, using the same approach with model 2, we estimated the contribution of desert dust and non-dust storm days to the monthly concentrations.
PM10 trends
We also examined the nonlinear effect of meteorological parameters, weekday, month, and year, on PM10 concentrations using a Generalized Additive Model (GAM) with penalized splines (Barmpadimos et al., Citation2011), as shown in eq 3. This same model was used to study the trends of Nicosia and Ayia Marina PM10 concentrations, and urban contributions:
The impact of fuel use on PM10 trends was examined by adjusting eq 3 with leaded and unleaded gasoline and diesel fuel sales (tonnes per month), having each fuel type as a nonlinear variable in the model each time, as follows:
Precipitation and dewpoint were found to be not statistically significant and thus were not included in the final model. Analyses were performed using the SAS 9.2 (SAS Institute, Inc., Cary, NC) and R version 2.14.2 (R Development Core Team) statistical packages.
Results and Discussion
PM10 concentrations and seasonal trends
We examined PM10 concentrations and their trends at the Nicosia urban and Ayia Marina background sites during the period 1993–2008. In addition, we identified dust events and examined their frequency, temporal trends, and monthly and yearly contribution to the total PM10 levels. To the best of our knowledge, this is the first time that this type of analysis has been conducted in Cyprus.
The average daily PM10 concentration at the urban site was 56.0 μg/m3 with a standard error of 0.6 μg/m3. The average concentration after excluding desert dust storm days was 52.6 μg/m3. The overall PM10 average at the background site was 31.2 μg/m3 with a standard error of 0.7 μg/m3, and when desert dust storm days were excluded from the analysis, the average value decreased to 26.1 μg/m3.
depicts the annual PM10 concentrations and the respective dust contributions estimated using eq 1. As can be seen, the annual mean levels in Nicosia exceeded the EU annual standard limit enacted in 2005 of 40 μg/m3 every year. PM10 yearly concentrations at this urban site ranged from 50.4 μg/m3 (1995) to 63.8 μg/m3 (1998). After excluding desert dust days, the concentrations ranged from 48.3 μg/m3 (2002) to 59.4 μg/m3 (1993). The yearly levels at the Ayia Marina background site were lower than those at the urban site and did not exceed the annual 2005 EU standard, ranging from 27.3 μg/m3 (2002) to 35.6 μg/m3 (2008). For non-dust storm days, the yearly means varied between 24.7 μg/m3 (2007) and 30.2 μg/m3 (1999). The mean annual desert dust contribution was estimated to be 6.0 μg/m3 (95% CI: 5.3, 6.8) in Nicosia and 6.8 μg/m3 (95% CI: 5.8,7.8) in Ayia Marina. The impact of desert dust storms on PM10 concentrations at the urban and background sites is similar, as indicated by the reasonable agreement between impact estimates obtained for these two sites.
Figure 2. Annual PM10 levels for Nicosia (1993–2008) and Ayia Marina (1999–2008) in μg/m3. Dashed line shows the EU annual standard of 40 μg/m3, and error bars correspond to the 95% confidence intervals for the dust contribution.
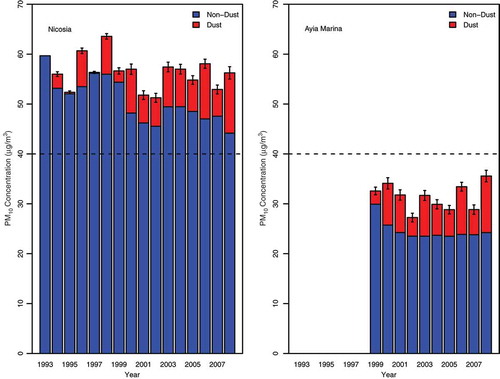
Querol et al. (Citation2009) estimated the mean annual net dust contribution in Ayia Marina for the period 2003–2006 to be 9.0 μg/m3. Using our statistical approach, our estimate of the dust contribution was about 20% lower during the same years (7.3 μg/m3). Different desert dust storm identification approaches and statistical analysis methods were used in the two studies, and that is why we got a different estimate. In the study mentioned previously, dust storms were identified based on meteorological and aerosol maps, satellite SeaWiFS imagery, and HYSPLIT back-trajectories. Dust PM10 load was quantified based on the application of a monthly moving 30th percentile to PM10 data series, after excluding days with African dust influence. For the desert dust days, the net dust load was obtained by subtracting the calculated 30th percentile to the measured PM10 concentration. In our study, we identified dust storms based on ground-level PM10 concentrations, airport observations, SeaWiFS data (AOD, Angstrom exponent), HYSPLIT back-trajectories, and MODIS images. Dust annual contribution was estimated using a regression model as explained in the Methods section.
Overall, annual average PM10 levels in Nicosia were comparable to those observed in other eastern Mediterranean urban sites, such as Heraklion, Greece (51 μg/m3), Istanbul, Turkey (47 μg/m3), and Tel Aviv, Israel (57 μg/m3) (Dayan and Levy, Citation2005; Karaca et al., Citation2005; Gerasopoulos et al., Citation2006). However, PM10 annual levels in Nicosia are higher than those observed in other urban areas in Europe (20–55 μg/m3), and levels at Ayia Marina are higher than those seen at most rural sites in Europe (7–30 μg/m3) (Querol et al., Citation2001; Viana et al., Citation2003; Van Dingenen et al., Citation2004). Eastern Mediterranean urban and rural sites can be impacted by local soil and sea salt particles, which may explain, in part, their higher levels compared to other European sites. PM10 speciation analysis conducted by Querol et al. (Citation2009) shows that mineral dust contributions to the mean annual background particle concentrations are 39% and 25% for the cities of Finokalia (northern coast of Crete, Greece) and Erdemli (southern coast of Turkey), respectively. The same analysis reports sea spray to be responsible for 8% of the mean annual background particle concentrations in Finokalia and 24% in Erdemli.
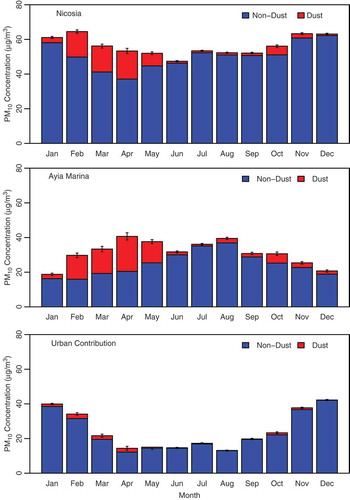
shows the monthly mean PM10 concentrations and the respective desert dust storm contributions at the Nicosia and Ayia Marina sites, which were estimated using eq 2. These results suggest that PM10 levels in Nicosia exhibit little seasonal variability, with concentrations slightly higher from November through February and slightly lower in June. In contrast, the background site shows a seasonal pattern with higher levels from February to May due to desert dust storms. In addition, levels at Ayia Marina were higher during the summer (from July to August), possibly due to a number of reasons, such as regional transport, enhanced photochemical activity, lower precipitation, and increased soil resuspension. As shown, desert dust events occurred more frequently during late winter and in spring and, as expected, both sites were similarly impacted by them.
Figure 3. Monthly PM10 concentrations for Nicosia (urban), Ayia Marina (background), and urban contribution in μg/m3. Error bars correspond to the 95% confidence intervals for the dust contribution.
Annual PM10 trends
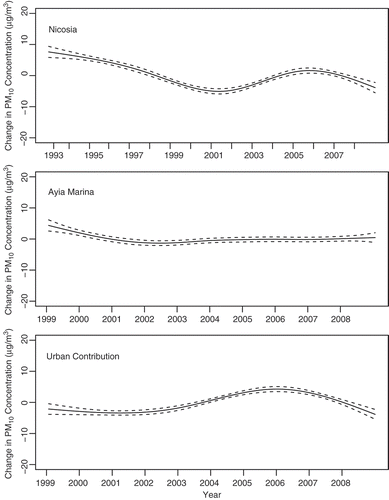
Once the impact of days with dust storms has been excluded, it becomes clear that the yearly PM10 mean concentrations in Nicosia decreased from 59.4 μg/m3 (95% CI: 57.1, 61.4) in 1993 to 49.0 μg/m3 (95% CI: 47.3, 50.8) in 2008. shows the temporal patterns of PM10 values in Nicosia and Ayia Marina, which have been adjusted to remove the effect of dust storms and to account for the influences of month, day of week, and weather (eq 3). The figure also includes a similar plot of an estimate of the urban contribution adjusted in this same way. As can be seen, the downtrend for Nicosia was not monotonic. From 1993 to early 2001 concentrations decreased by 21% (12.7 μg/m3). After 2001, we observed an increase of 13.5% (6.5 μg/m3), which peaked in mid-2005. Subsequently, PM10 levels decreased again by 9.4% (5.2 μg/m3) from mid-2005 until 2008. Because data from the Ayia Marina background site were not available for years before 1999, we could only examine the trends of background levels and urban source contributions from 1999 to 2008. No significant temporal trends in PM10 concentrations were observed at the background site. Urban source contributions in Nicosia exhibited a similar temporal trend to those of PM10 concentrations at this site. The average urban contributions were 23.3 μg/m3 (95% CI: 20.7, 26.0) in 1999 and 20.0 μg/m3 (95% CI: 18.2, 21.8) in 2008. From 1999 until early 2001, PM10 decreased by 5.6% (1.3 μg/m3), then increased again by 36.4% (7.7 μg/m3) until mid-2005, when it decreased again by 28.3% (8.2 μg/m3) until 2008.
Figure 4. Annual PM10 trends adjusted for month, day of the week, desert dust storm effect, temperature, wind speed, and relative humidity for Nicosia (urban), Ayia Marina (background), and urban contribution. Dashed lines represent the 95% confidence intervals for the estimate.
Variation in urban source contributions to PM10 concentrations in Nicosia could be related to changes in traffic emissions. There are several factors that may support this, such as:
During the 1993–2008 period the total number of vehicles in Nicosia increased by 67.6% (Licensed Vehicles by District, 1990–2011, Cyprus Statistical Service).
Unleaded gasoline was first introduced in Cyprus in 1992 and was used concurrently with leaded gasoline until 2004. Since 2005 only unleaded motor gasoline has been used (Sales of Petroleum Products by Type, 1966–2011, Cyprus Statistical Service). It is known that vehicles powered by unleaded gasoline emit less particulate matter than those using leaded gasoline (Yuan et al., Citation2000). Therefore, the phase-out of leaded gasoline might be one of the reasons that PM10 decreased in Nicosia.
In 2002, Cyprus authorities started implementing new regulations regarding emission standards for newly registered vehicles including: periodic inspections of in-use vehicles and fuel quality specifications (Legislation and policy options for reduction of traffic emission in Cyprus, LIFE00 TCY/CY/051, Department of Electrical and Mechanical Services, Ministry of Communications and Works, Republic of Cyprus).
Note however, that we did not observe any significant reduction in the Nicosia concentrations of PM10 or in the estimated urban contributions to PM10 between 2003 and 2009 once we had adjusted for changes in fuel use (eq 4).
Dust storm impact on daily concentrations
summarizes the PM10 mean daily concentrations during desert dust storms and the number of days with PM10 concentrations exceeding the daily EU limit of 50 μg/m3. At Nicosia, standard violations occurred 39.0% (2002) to 67.8% (1993) of the days, where a very small fraction of them (1% to 9%) were attributed to desert dust events. At Ayia Marina, the percentage of days exceeding the limit varied between 7.2% (2005) and 11.0% (2008). The contribution of desert dust storms to the daily exceedances was similar, ranging from 3% to 9%. The PM10 mean daily concentrations during desert dust storms ranged from 55.5 μg/m3 (1995) to 470.1 μg/m3 (1996) in Nicosia and from 68.1 μg/m3 (2002) to 157.9 μg/m3 (2006) in Ayia Marina. These concentrations show that desert dust storm days have been typically about 100 μg/m3 since 2000, but in earlier years dust storm days were much worse, averaging 470 μg/m3 in 1996.
Table 1. PM10 mean daily concentrations during desert dust storms and percent of days exceeding the daily EU limit of 50 μg/m3 at Nicosia and Ayia Marina site for all days and during desert dust storms
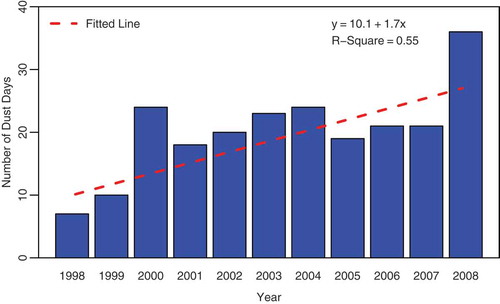
We examined the annual frequency of desert dust storms only for the period of 1998–2008 because satellite data and background measurements were not available for the previous years (1993–1997). During the period of 1998–2008 the incidence of dust days in Cyprus increased at an average rate of 1.7 days per year from 7 in 1998 to 36 in 2008 (). Our findings are consistent with those of other studies in the Mediterranean region that report an increase in the frequency of dust episodes (Goudie and Middleton, Citation2001; Kashima et al., Citation2012), possibly due to climatic changes, such as more droughts, and human disturbance of desert surfaces, such as vegetation removal.
Figure 5. Number of observed dust days per year in Cyprus and fitted linear trend (dashed line).
Urban source contributions
The mean impact of urban sources to PM10 concentrations in Nicosia for the period 1999 to 2008 was 24.0 μg/m3 with a standard error of 0.4 μg/m3. This corresponds to 43% of the total PM10 concentrations.
Nicosia urban source contributions exhibited a strong seasonal pattern, with higher levels observed between November and February (). During these winter months, average temperature and wind velocity were at their lowest, favoring the accumulation of local emissions due to reduction in both vertical mixing and horizontal movement of air masses.
We investigated the weekday and diurnal patterns of the urban source contributions. Values were consistent with traffic patterns, which are heavier during the week and lighter on weekends ().
Table 2. Weekday PM10 urban source contributions
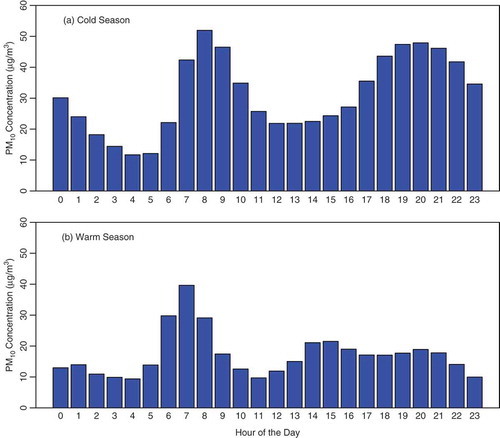
Diurnal variations in urban source contributions are graphically presented in and . During the cold season (November through April), two peaks were observed during 7:00–9:00 h and 18:00–21:00 h, shown in , which are due to the morning and evening traffic, respectively. During the warmer months (May to October), a peak was noticed between 6:00 and 8:00 h due to the morning traffic but the effect of evening traffic was not very noticeable. During winter, the evening peak is more pronounced than that in the warm season possibly due to the higher atmospheric stability of the cold season. The elevated urban source contributions during traffic time periods clearly indicate a high influence of vehicular emissions.
Figure 6. Urban source contributions to PM10 hourly concentrations in the (a) cold and (b) warm season, μg/m3.
Conclusion
In this study, we examined the yearly trends and intra-annual variability of PM10 concentrations at the Nicosia urban and Ayia Marina background representative sites in Cyprus.
Yearly PM10 concentration levels in Nicosia ranged between 50.4 and 63.8 μg/m3 and exceeded the European Union annual standard of 40 μg/m3 during every year of the 16-year study. The study of yearly trends showed that PM10 levels in Nicosia decreased over the period 1993 to 2008, probably in part as a result of traffic emission control policies in Cyprus.
PM10 mean concentrations during dust storm days are typically about 100 μg/m3 since 2000, but in earlier years levels on dust storm days were much worse, averaging 470 μg/m3 in 1996. Furthermore, from 1998 to 2008 the number of desert dust days increased at an average rate of 1.7 days per year. Despite the large impact of dust storms on annual average PM10 concentrations and the increasing frequency of dust storms over time, dust storms were responsible for a small fraction of the exceedances of the daily PM10 limit.
Urban sources in Nicosia were responsible for 43% of the total PM10 concentrations. The impact of the urban source contributions was higher during traffic hours, weekdays, cold months, and low wind conditions, indicating that these contributions are mostly originating from traffic emissions.
Finally, it must be noted that in this paper we assess and discuss the impacts of dust storms, which should not be confused with the contributions of other natural particles such as local resuspended soil and sea salt. It is conceivable that the Earth crust and the sea are major sources of particles in Cyprus, which may be responsible in part for the high levels reported in this study. Recently, we completed 1 year of particle speciation monitoring in the four largest cities of Cyprus: Nicosia, Limassol, Larnaca, and Paphos. A source apportionment analysis is underway to assess the contributions of local resuspended soil and sea salt particles and their relative importance to local anthropogenic emissions, including traffic, aviation, ships, and industrial sources.
Acknowledgment
The Air Quality Section (Department of Labour Inspection, Cyprus Ministry of Labour, Welfare and Social Insurance) and the Cyprus Meteorological Service provided the air pollution and meteorology data, respectively. The authors thank Dr. Alexandra Chudnovsky for her assistance with the satellite data and Dr. Joy Lawrence for her insightful review of the manuscript.
Funding
This study was supported by the Cyprus International Initiative for the Environment and Public Health in association with Harvard School of Public Health (HSPH).
Additional information
Notes on contributors
Souzana Achilleos
Souzana Achilleos, M.S., is a doctoral student at the Exposure, Epidemiology and Risk Program, Department of Environmental Health, Harvard School of Public Health in Boston, MA.
John S. Evans
John S. Evans, Sc.D, is Professor and Director of Cyprus International Institute (CII) for Environmental and Public Health in association with Harvard School of Public Health at Cyprus University of Technology in Limassol, Cyprus.
Panayiotis K. Yiallouros
Panayiotis K. Yiallouros, Ph.D., is Visiting Lecturer and directs the Respiratory Diseases & the Environment Unit at the Cyprus International Institute for Environmental and Public Health at Cyprus University of Technology in Limassol, Cyprus. He is also the head of the Pediatric Pulmonology Clinic at the tertiary Children’s Hospital in Cyprus (Hospital Archbishop Makarios III) and Deputy Director of the Division of Pediatrics.
Savvas Kleanthous
Savvas Kleanthous is the Head of Air Quality Section at the Department of Labour Inspection, Ministry of Labour, Welfare and Social Insurance.
Joel Schwartz
Joel Schwartz, Ph.D., is Professor of Environmental Epidemiology in the Department of Environmental Health and Department of Epidemiology at Harvard School of Public Health in Boston, MA.
Petros Koutrakis
Petros Koutrakis, Ph.D., is Professor of Environmental Sciences in the Department of Environmental Health at Harvard School of Public Health in Boston, MA. He is also the Director of the EPA/Harvard University Center for Ambient Particle Health Effects.
References
- Amodio, M., E. Andriani, L. Angiuli, G. Assennato, G. De Gennaro, A. Di Gilio, R. Giua, M. Intini, M. Menegotto, A. Nocioni, J. Palmisani, M.R. Perrone, C.M. Placentino, and M. Tutino. 2011. Chemical characterization of PM in the Apulia Region: Local and long-range transport contributions to particulate matter. Boreal Environ. Res. 16: 251–61.
- Amodio, M., P. Bruno, M. Caselli, G. de Gennaro, P.R. Dambruoso, B.E. Daresta, P. Ielpo, F. Gungolo, C.M. Placentino, V. Paolillo, and M. Tutino. 2008. Chemical characterization of fine particulate matter during peak PM10 episodes in Apulia (South Italy). Atmos. Res. 90:313–25. doi:10.1016/j.atmosres.2008.07.003
- Barmpadimos, I., C. Hueglin, J. Keller, S. Henne, and A.S.H. Prévôt. 2011. Influence of meteorology on PM10 trends and variability in Switzerland from 1991 to 2008. Atmos. Chem. Phys. 11:1813–15. doi:10.5194/acp-11-3579-2011
- Barnaba, F., and G.P. Gobbi. 2004. Aerosol seasonal variability over the Mediterranean region and relative impact of maritime, continental and Saharan dust particles over the basin from MODIS data in the year 2001. Atmos. Chem. Phys. 4:2367–91. doi:10.5194/acp-4-2367-2004
- Barnett, A.G., J.F. Fraser, and L. Munck. 2012. The effects of the 2009 dust storm on emergency admissions to a hospital in Brisbane, Australia. Int. J. Biometeorol. 56:719–26. doi:10.1007/s00484-011-0473-y
- Baumbach, G., and H. Pfeiffer. 2004. Preliminary assessment of ambient air quality in Cyprus. UNOPS Project, Final report. http://www.mlsi.gov.cy/mlsi/dli/dli.nsf/All/ACA55F8B7B545E9AC2257339003C0F35?OpenDocument&t=d&e=
- Bell, M.L., J.K. Levy, and Z. Lin. 2008. The effect of sandstorms and air pollution on cause-specific hospital admissions in Taipei, Taiwan. Occup. Environ. Med. 65:104–11. doi:10.1136/oem.2006.031500
- Dayan, U., J. Heffter, J. Miller, and G. Gutman. 1991. Dust intrusion events into the Mediterranean Basin. J. Appl. Meteorol. 30:1185–99. doi:10.1175/1520-0450(1991)030<1185:DIEITM>2.0.CO;2
- Dayan, U., and I. Levy. 2005. The influence of meteorological conditions and atmospheric circulation types on PM10 and visibility in Tel Aviv. J. Appl. Meteor. 44: 606–19. doi:10.1175/JAM2232.1
- Draxler, R.R., and G.D. Rolph. 2013. HYSPLIT (HYbrid Single-Particle Lagrangian Integrated Trajectory) Model access via NOAA ARL READY website (http://www.arl.noaa.gov/HYSPLIT.php). NOAA Air Resources Laboratory, College Park, MD.
- Ganor, E., H. A. Foner, S. Brenner, E. Neeman, and N. Lavi. 1991. The chemical composition of aerosols settling in Israel following dust storms. Atmos. Environ. 25: 2665–70. doi:10.1016/0960-1686(91)90196-E
- Gerasopoulos, E., G. Kouvarakis, P. Babasakalis, M. Vrekoussis, J. P. Putaud, and N. Mihalopoulos. 2006. Origin and variability of particulate matter (PM10) mass concentrations over the Eastern Mediterranean. Atmos. Environ. 40: 4679–90. doi:10.1016/j.atmosenv.2006.04.020
- Grineski, S.E., J.G. Staniswalis, P. Bulathsinhala, Y. Peng, and T.E. Gill. 2011. Hospital admissions for asthma and acute bronchitis in El Paso, Texas: Do age, sex, and insurance status modify the effects of dust and low wind events? Environ. Res. 111:1148–55. doi:10.1016/j.envres.2011.06.007
- Goudie, A.S., and N.J. Middleton. 2001. Saharan dust storms: nature and consequences. Earth-Sci. Rev. 56:179–204. doi:10.1016/S0012-8252(01)00067-8
- Güllü, G.H., İ. Ölmez, and G. Tuncel. 2000. Temporal variability of atmospheric trace element concentrations over the eastern Mediterranean Sea. Spectrochim. Acta B. 55:1135–50. doi:10.1016/S0584-8547(00)00206-8
- Karaca, F., O. Alagha, and F. Erturk. 2005. Statistical characterization of atmospheric PM10 and PM2.5 concentrations at a non-impacted suburban site of Istanbul, Turkey. Chemosphere 59:1183–90. doi:10.1016/j.chemosphere.2004.11.062
- Kashima, S., T. Yorifuji, T. Tsuda, and A. Eboshida. 2012. Asian dust and daily all-cause or cause-specific mortality in western Japan. Occup. Environ. Med. 69:908–15. doi:10.1136/oemed-2012-100797
- Kleanthous, S., M.A. Bari, G. Baumbach, and L. Sarachaga-Ruiz. The particulate matter problem in Cyprus. Proceedings of the 6th International Conference on Urban Air Quality, Limassol, Cyprus, March 27–29, 2007.
- Kleanthous, S., M.A. Bari, G. Baumbach, and L. Sarachage-Ruiz. 2009. Influence of particulate matter on the air quality situation in a mediterranean island. Atmos. Environ. 43:4745–53. doi:10.1016/j.atmosenv.2008.06.025
- Koçak, M., N. Mihalopoulos, and N. Kubilay. 2007. Contributions of natural sources to high PM10 and PM2.5 events in the eastern Mediterranean. Atmos. Environ. 41:3806–18. doi:10.1016/j.atmosenv.2007.01.009
- Kubilay, N., S. Nickovic, C. Moulin, and F. Dulac. 2000. An illustration of the transport and deposition of mineral dust onto the eastern Mediterranean. Atmos. Environ. 34:1293–303. doi:10.1016/S1352-2310(99)00179-X
- Kubilay, N., and A.C. Saydam. 1995. Trace elements in atmospheric particulates over the Eastern Mediterranean; Concentrations, sources, and temporal variability. Atmos. Environ. 29:2289–300. doi:10.1016/1352-2310(95)00101-4
- Mallone, S., M. Stafoggia, A. Faustini, G.P. Gobbi, A. Marconi, and F. Forastiere. 2011. Saharan Dust and associations between particulate matter and daily mortality in Rome, Italy. Environ. Health Perspect. 119:1409–14. doi:10.1289/ehp.1003026
- Middleton, N., P. Yiallouros, S. Kleanthous, O. Kolokotroni, J. Schwartz, D. Dockery, P. Demokritou, and P. Koutrakis. 2008. A 10-year time-series analysis of respiratory and cardiovascular morbidity in Nicosia, Cyprus: The effect of short-term changes in air pollution and dust storms. Environ. Health 7:1–16. doi:10.1186/1476-069X-7-39
- Mitsakou, C., G. Kallos, N. Papantoniou, C. Spyrou, S. Solomos, M. Astitha, and C. Housiadas. 2008. Saharan dust levels in Greece and received inhalation doses. Atmos. Chem. Phys. 8:7181–92. doi:10.5194/acp-8-7181-2008
- Moreno, T., X. Querol, A. Alastuey, M. Viana, and W. Gibbons. 2005. Exotic dust incursions into central Spain: Implications for legislative controls on atmospheric particulates. Atmos. Environ. 39:6109–20. doi:10.1016/j.atmosenv.2005.06.038
- Neophytou, A. M., P. Yiallouros, B. A. Coull, S. Kleanthous, P. Pavlou, S. Pashiardis, D. W. Dockery, P. Koutrakis, and F. Laden. 2013. Particulate matter concentrations during desert dust outbreaks and daily mortality in Nicosia, Cyprus. J. Expos. Sci. Environ. Epidemiol. 23:275–80. doi:10.1038/jes.2013.10
- Paschardes, S., and C. Christofides. 1995. Statistical analysis of wind speed and direction in Cyprus. Sol. Energy 55:405–14. doi:10.1016/0038-092X(95)00064-X
- Querol, X., A. Alastuey, J. Pey, M. Cusack, N. Pérez, N. Mihalopoulos, C. Theodosi, E. Gerasopoulos, N. Kubilay, and M. Koçak. 2009. Variability in regional background aerosols within the Mediterranean. Atmos. Chem. Phys. 9:4575–91. doi:10.5194/acp-9-4575-2009
- Querol, X., A. Alastuey, J. A. Puicercus, E. Mantilla, J.V. Miro, A. Lopez-Soler, F. Plana, and B. Artiñano. 1998. Seasonal evolution of suspended particles around a large coal-fired power station: particulate levels and sources. Atmos. Environ. 32:1963–78. doi:10.1016/S1352-2310(97)00504-9
- Querol, X., A. Alastuey, S. Rodriguez, F. Plana, E. Mantilla, and C.R. Ruiz. 2001. Monitoring of PM10 and PM2.5 around primary particulate anthropogenic emission sources. Atmos. Environ. 35:845–58. doi:10.1016/S1352-2310(00)00387-3
- Querol, X., A. Alastuey, S. Rodriguez, F. Plana, C. R. Ruiz, N. Cots, G. Massagué, and O. Puig. 2001. PM10 and PM2.5 source apportionment in the Barcelona Metropolitan area, Catalonia, Spain. Atmos. Environ. 35:6407–19. doi:10.1016/S1352-2310(01)00361-2
- Querol, X., J. Pey, M. Pandolfi, A. Alastuey, M. Cusack, N. Pérez, T. Moreno, M. Viana, N. Mihalopoulos, G. Kallos, and S. Kleanthous. 2009. African dust contributions to mean ambient PM10 mass-levels across the Mediterranean Basin. Atmos. Environ. 43:4266–77. doi:10.1016/j.atmosenv.2009.06.013
- Rodrı́guez, S., X. Querol, A. Alastuey, G. Kallos, and O. Kakaliagou. 2001. Saharan dust contributions to PM10 and TSP levels in Southern and Eastern Spain. Atmos. Environ. 35:2433–47. doi:10.1016/S1352-2310(00)00496-9
- Van Dingenen, R., F. Raes, J.-P. Putaud, U. Baltensperger, A. Charron, M.C. Facchini, S. Decesari, S. Fuzzi, R. Gehrig, H.-C. Hansson, R. M. Harrison, C. Hüglin, A.M. Jones, P. Laj, G. Lorbeer, W. Maenhaut, F. Palmgren, X. Querol, S. Rodriguez, J. Schneider, H. ten Brink, P. Tunved, K. Tørseth, B. Wehner, E. Weingartner, A. Wiedensohler, and P. Wåhlin. 2004. A European aerosol phenomenology—1: Physical characteristics of particulate matter at kerbside, urban, rural and background sites in Europe. Atmos. Environ. 38: 2561–77. doi:10.1016/j.atmosenv.2004.01.040
- Viana, M., X. Querol, A. Alastuey, G. Gangoiti, and M. Menéndez. 2003. PM levels in the Basque Country (northern Spain): analysis of a 5-year data record and interpretation of seasonal variations. Atmos. Environ. 37: 2879–91. doi:10.1016/S1352-2310(03)00292-9
- Yuan, D., W. Zhou, and S. Ye. 2000. Effect of leaded and unleaded gasoline on the mutagenicity of vehicle exhaust particulate matter. J. Environ. Pathol. Toxicol. Oncol. 19:41–48.