
Abstract
Population growth and the pressures spawned by increasing demands for energy and resource-intensive goods, foods, and services are driving unsustainable growth in greenhouse gas (GHG) emissions. Recent GHG emission trends are consistent with worst-case scenarios of the previous decade. Dramatic and near-term emission reductions likely will be needed to ameliorate the potential deleterious impacts of climate change. To achieve such reductions, fundamental changes are required in the way that energy is generated and used. New technologies must be developed and deployed at a rapid rate. Advances in carbon capture and storage, renewable, nuclear, and transportation technologies are particularly important; however, global research and development efforts related to these technologies currently appear to fall short relative to needs. Even with a proactive and international mitigation effort, humanity will need to adapt to climate change, but the adaptation needs and damages will be far greater if mitigation activities are not pursued in earnest. In this review, research is highlighted that indicates increasing global and regional temperatures and ties climate changes to increasing GHG emissions. GHG mitigation targets necessary for limiting future global temperature increases are discussed, including how factors such as population growth and the growing energy intensity of the developing world will make these reduction targets more challenging. Potential technological pathways for meeting emission reduction targets are examined, barriers are discussed, and global and U.S. modeling results are presented that suggest that the necessary pathways will require radically transformed electric and mobile sectors. While geoengineering options have been proposed to allow more time for serious emission reductions, these measures are at the conceptual stage with many unanswered cost, environmental, and political issues.
Implications: This paper lays out the case that mitigating the potential for catastrophic climate change will be a monumental challenge, requiring the global community to transform its energy system in an aggressive, coordinated, and timely manner. If this challenge is to be met, new technologies will have to be developed and deployed at a rapid rate. Advances in carbon capture and storage, renewable, nuclear, and transportation technologies are particularly important. Even with an aggressive international mitigation effort, humanity will still need to adapt to significant climate change.
Introduction
Scientific studies clearly show that the planet is warming. For example, a 2010 synthesis of results from 160 research groups over 48 countries came to the conclusion that the top 10 indicators of global climate change all point to warming (Arndt et al., [IEA], Citation2012). This growth rate corresponds to the most pessimistic emission projection from the Intergovernmental Panel on Climate Change (IPCC, Citation2000). While U.S. and European emissions have leveled off since 2000, the global greenhouse gas (GHG) increases are being driven largely by economic growth in China and India. Combined emissions from China and India more than doubled from 2000 to 2010 (Le Quéré et al., Citation2013; Global Carbon Project, Citation2012).
If we continue on this emissions trajectory, global circulation models indicate that the planet could experience surface warming of 4ºC from preindustrial levels as early as 2065 (Betts et al., Citation2010). Surface temperatures over the continental United States are expected to increase as much as 5 to 8ºC under the same scenario, since land warms more rapidly than the oceans (Sanderson, 2010). Warren (Citation2010, p. 233) summarized the implications of a 4°C warmer world as follows:
Enormous adaptation challenges in the agricultural sector, with large areas of cropland becoming unsuitable for cultivation. … large losses in biodiversity, forests, coastal wetlands… supported by an acidified and potentially dysfunctional marine ecosystem. Drought and desertification would be widespread, with large numbers of people experiencing increased water stress. … Human and natural systems would be subject to increasing levels of agricultural pests and diseases, and increases in the frequency and intensity of extreme weather events.
While some level of increase in global temperatures is now inescapable due to emissions already in the atmosphere, strategies to reduce global GHG emissions have the potential to limit warming and its associated deleterious effects. However, when describing the challenge of a 50% global emission reduction program, from 2007 to 2050, the International Energy Agency (IEA) has characterized the technological changes that would be necessary: “A global revolution … in ways that energy is supplied and used” (IEA, Citation2008, p. 37). The study authors further stated such a mitigation program “requires urgent implementation of unprecedented and far reaching new policies in the energy sector” (IEA, Citation2008, p.38).
The setting of the required reduction targets is challenged by drivers such as population and economic growth and by the increasingly energy-intensive lifestyles of developing countries as they industrialize and urbanize. Proposals for implementing GHG emission reduction targets have also faced difficulties because of the perception that they will hamper economic development by increasing energy costs.
The objective of this review paper is to quantify the challenges faced in large-scale GHG mitigation. First, we decompose the drivers of GHG emissions growth and examine the GHG reductions from a per-capita perspective. Next, at a global level, we discuss and analyze a recent IEA report that provides a global perspective on technological pathways for mitigation and the critical technologies. We present modeling of the U.S. energy system, showing how drastically energy supplies and demands must change if we are to achieve even a more modest emission reduction target. Then we summarize global energy research and development expenditures to illustrate inadequacy in funding. Additional technological challenges are discussed regarding nuclear power and carbon capture and sequestration, two technologies that have been identified as being components critical to many mitigation pathways. We illustrate with modeling how the necessary rate of emission reductions increases dramatically if we postpone action and that even a major, yet not transformational, global mitigation program will yield substantial warming and precipitation changes. Finally, we argue that unless and until humanity moves aggressively to deal with GHG emissions, we are moving in a dangerous and unsustainable path.
Assessing the Climate Change Sustainability Challenge
A holistic view
A holistic view of long-term sustainability cannot ignore humanity’s ever-growing demands on fossil fuels, water, and other finite geological resources. illustrates the key factors that are responsible for potentially unsustainable global impacts, with a focus on climate change (Princiotta, Citation2011). Such impacts have the potential to modify the planet so that it is inhospitable to the needs of the growing population, expected to pass 9 billion by midcentury.
Figure 1. Global climate change: A key challenge to long-term sustainability. Adapted from Princiotta (Citation2011).
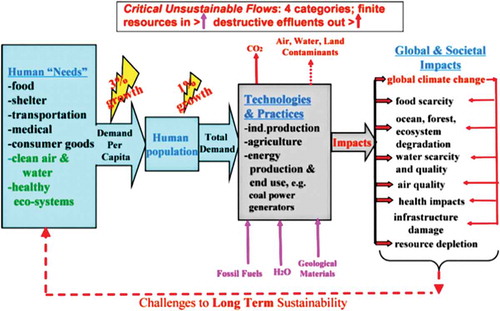
The root cause of potentially deleterious impacts is the technological challenge of meeting human “needs” that are growing dramatically, especially in developing nations. These needs are indicated by the box to the left side of the figure. Over time, the developed nations have expanded their list of needs to include personal transportation, large residences with energy-intensive heating, cooling, and lighting requirements, a diet heavily oriented toward meat production, and a growing array of consumer goods. Developing countries such as China and India, with large populations, are moving in the same direction. Although it is difficult to quantify the growth rate of such per-capita needs, it is reasonable to relate these needs to per-capita annual economic growth, which has been approximately 3% in recent years. The problem is further magnified by a global population that is growing at roughly 1% per year. The combination of these growth rates results in the demand for such needs to double every 25 years, a rate that likely is unsustainable.
The middle of the figure indicates that these human needs are met by means of a large array of industrial, agricultural, and energy technologies and practices. Although there are a multitude of inputs and outputs associated with humankind’s “technologies and practices,” the major threats to long-term sustainability for an advanced level of civilization are shown in the figure. These threats include depletion of fossil fuels without adequate quantities of alternative forms of energy, depletion of mineral and water supplies, and the various impacts associated with the emissions of CO2 and other greenhouse gases. Although air, water, and waste contamination are serious potential consequences of our current resource intensive infrastructure, there appears to be a reasonable chance that we can modify our industrial infrastructure to maintain a tolerable impact of these contaminants over the long term. The United States, European Union (EU), and Japan have been able to keep such impacts at close to tolerable levels despite population growth (in the United States) and industrial growth in recent decades. That is why these contaminants are shown in a dashed-line format.
On the right-hand side of the figure is a listing of key global impacts associated with the technology and practices currently used to meet human needs. As indicated by the red return arrows, climate change has the potential to exacerbate global impacts associated with non-energy-related technologies and practices. Ocean and forest degradation are examples of such amplification. Climate change can also yield unique impacts, such as infrastructure damage due to seawater rise and storm damage. As indicated by the return flow at the top of the graphic, in a business-as-usual scenario, these impacts will challenge the ability of humanity to meet its needs over the long term, challenging long-term sustainability. The bottom of the figure indicates that there are two classes of mitigation opportunities: modifying our current carbon intensive technologies and practices, the most commonly considered approach, and modifying social and cultural behavior toward a less energy- and resource-intensive lifestyle.
Although this paper focuses on low-carbon technologies and practices, the mitigation challenge likely goes beyond what is feasible by technology alone. Additional steps may need to be taken to move humanity away from its current energy- and resource-intensive culture to a more sustainable model. Such societal changes could be encouraged by incentivizing material recycling programs, energy efficiency in buildings, mass transit, and land practices that maximize vegetative sequestration of atmospheric CO2. More difficult and controversial transitions affecting population growth and dietary choices may also be necessary. Reducing resource demands not only has the potential to reduce GHGs; co-benefits may include improved air and water quality, improved ecosystem services (e.g., forest and ocean health), and reduced mineral resource depletion.
also indicates the synergistic relationship between energy production and fresh water use. The production of energy requires large quantities of water, and supplying potable water utilizes considerable quantities of energy.
Factors influencing CO2 emissions
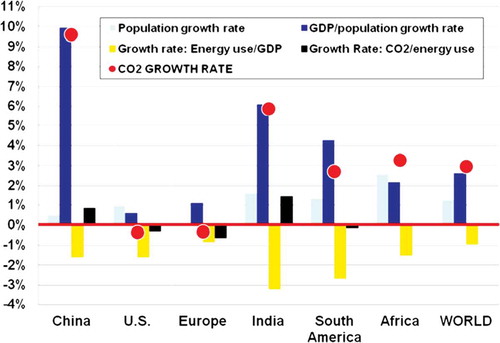
, derived from the Global Carbon Project (2012) data, was generated utilizing energy-related factors that have driven CO2 emissions for key countries from 2000 to 2010. The factors considered are gross domestic product (GDP) per capita, population, carbon intensity (i.e., carbon emissions per unit of energy), and energy intensity (i.e., energy usage per unit of GDP). The relationship is as follows: Carbon emissions = GDP per capita × population × carbon intensity × energy intensity. The sum of the rates of change of these factors approximates the annual carbon (and CO2) emission growth rate. For example, the sum of the bars for “Global” in equates to approximately 3% per year. While emissions in the United States and Europe have decreased slightly in the last decade, those for China and India increased by 9% and 6% per year, respectively, driven by economic and population growth.
Figure 2. Factors influencing CO2 emissions, 2000–2010.
The per capita challenge
More than 100 countries have adopted an upper global warming limit of 2ºC (Meinshausen et al., Citation2009). We examine the CO2 per-capita emissions reductions that would be necessary to reach this target. The analysis provides insights into the current carbon intensity of key countries and the per-capita reductions that would be needed to meet various emission reduction targets.
summarizes an in depth global per-capita analysis using 2008 data (IPCC, Citation2014). This instructive graphic plots per-capita emissions versus world population, which was 6.8 billion in 2008. All major countries are included, with per-capita emissions per country decreasing from left to right. The area of each country’s rectangle equals its 2008 CO2 emissions. Australia and the United States, with almost 18 and 17 tonnes per capita, respectively, have the highest values. The Congo, Bangladesh, Nigeria, and Ethiopia emit less than 0.5 tonnes per capita. China, with a value of 5.2, is the world’s largest emitter, given its 1.3 billion population. The average per-capita value for the developed world was 10.2, while the global average was 4.1.
Figure 3. Total energy-related per-capita emissions by country (red and grsy bars) compared to global per capita levels in 2050 (0.5 to 1.3 range) to limit warming to 20ºC with a 50 to 75% probability.
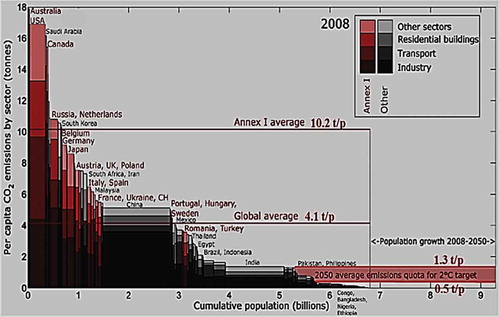
also allows comparison of 2008 per capita values relative to what will be needed to limit warming to 2ºC in 2050, when population is estimated at 9.2 billion. The IPCC (Citation2014) concludes that global per capita emissions will need to be reduced to the range of 0.5 and 1.3 tonnes to constrain warming to 2ºC. This corresponds to global emission reductions between 2008 and 2050 of 53 to 83%.
uses the data from and assumes that by 2050 the global per capita emissions will increase to 10.2. This is a credible scenario if there is no serious global mitigation program, and if the currently non-Annex 1 countries industrialize and move toward the energy- and resource-intensive economies of the Annex 1 countries.
Figure 4. A potential future scenario: By 2050 all countries emit CO2 at the Annex 1 countries’ 2008 per capita rate. Total emissions, represented by the bars, are in units of GT CO2. Per-capita values, indicated at the top of each bar, are in tonnes.
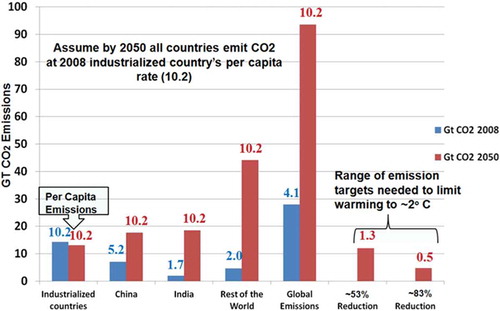
This figure illustrates that current global per capita emissions would have to be reduced from 4.1 to 0.5 tonnes to achieve an 83% reduction target, and to 1.3 tonnes per capita to meet a 53% reduction target. Just to reach the 1.3 tonnes global per capita goal, the United States would have to reduce its per-capita emissions by 92% from 2008 levels. China, the world’s largest emitter, would have to reduce per capita emissions by 64%, at the same time that its per-capita emissions are growing at a fast rate as China industrializes and moves toward the Annex 1 countries’ resource-intensive social and economic model. In fact, as of 2013, China’s per-capita emissions had already increased from 5.2 in 2008 to 7.0 in 2012 (Olivier et al., Citation2013).
It is instructive to analyze a “what-if” scenario that assumes that by 2050 all countries will achieve the industrialized world’s 2008 per capita emissions of 10.2 tonne per capita.
illustrates the emission implications of such an analysis. Under that scenario, emissions would more than triple from 2008 levels. Interestingly, such an emissions annual growth from 2008 to 2050 would be about 2.9%, which is close to the 2000 to 2011 3.0% global growth rate that was derived from earlier references. As the figure illustrates, given the current trend of the developing countries moving toward the developed world’s resource-intensive behavior and the massive reductions that are necessary, the mitigation challenge is monumental.
Mitigation Options
The mitigation challenge: What role can energy technologies play?
In the absence of lifestyle, behavioral, and structural changes, mitigating the roughly 4 trillion tonnes of CO2 required to constrain warming below 2.0ºC this century will be impossible without the extensive use of improved and, in some cases, breakthrough energy technologies (Princiotta, Citation2011). Such technologies are necessary for both energy production and to enhance end-use efficiency (e.g., lower emission vehicles).
In 2010, the International Energy Agency (IEA) completed an extensive analysis to understand the potential of various energy technologies to prevent CO2 emissions (IEA, Citation2010). The key emission scenario assessed was the Blue Map scenario, which assumes both an aggressive and successful research, development, and demonstration (RD&D) program to develop and improve technologies to support a comprehensive technology demonstration and deployment program. The scenario also assumes policies in place that would encourage the use of these technologies in an accelerated time frame, encouraging low-carbon technologies with costs up to US$200 per tonne of CO2. A variety of regulatory and incentive approaches could be applicable in such a scenario, such as CO2 cap and trade requirements, emission rate limits, taxes, or subsidies. The Blue Map scenario targets a 50% CO2 reduction target by 2050, relative to 2007. We analyze this scenario since it is similar to the 53% value mentioned already as a lower bound on necessary reductions by the IPCC (Citation2014).
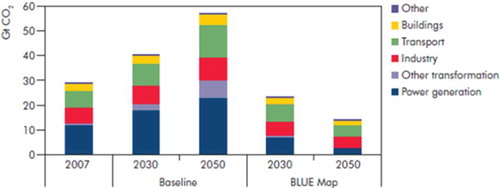
, reproduced from IEA (Citation2010), illustrates the energy-sector implications of the Blue Map scenario compared with projected baseline emissions up to the year 2050. In the baseline scenario, oil and gas prices are assumed to be high, and energy security concerns increase as imports rise. In this scenario, energy-related CO2 emissions in 2050 would be twice the level they were in 2007. This corresponds to an annual growth rate of 1.9%, which is significantly lower than the 3% growth in global CO2 emissions in the 2000 to 2011 time period. Nearly all of the growth in energy demand and in emissions comes from non-Organization for Economic Cooperation and Development (OECD) countries. As shows, for the Blue Map scenario, major reductions are required in every energy sector, with particularly deep reductions in the power-generation sector since such reductions are projected by the model to be lower in cost than those in other sectors.
Figure 5. Emissions by sector for baseline and Blue Map scenarios to 2050 in Gt CO2.
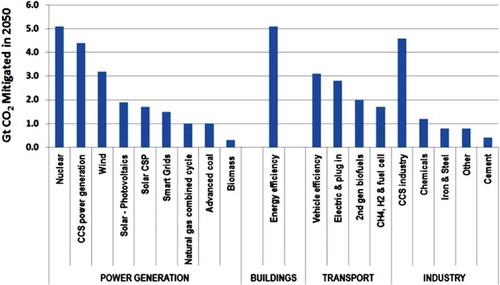
In , we illustrate the quantities of CO2 avoidance by technology for the Blue Map scenario. The sum of all the bars yields 43 Gt avoided in 2050 versus the baseline projections. The results suggest that a diverse array of technologies in all energy sectors will be needed if these avoidance goals are to be met. Of particular importance are end-use technologies in the building, transport, and power-generation sectors, as well as carbon storage technologies in the power-generation and industrial sectors.
Figure 6. Technologies needed to meet Blue Map scenarios avoidance goal of 43 Gt CO2 mitigated by 2050.
What are the challenges to early and deep CO2 reductions?
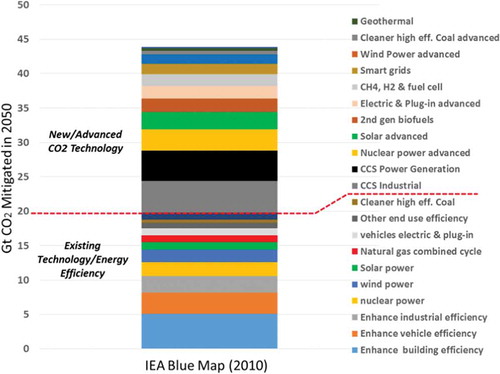
The Blue Map scenario helps identify the implications of an aggressive mitigation strategy because this scenario involves early and deep carbon reductions across all energy sectors. The in-depth IEA analysis of this option offers valuable insights regarding RD&D needs, the role that new technology must play, and investment requirements. For example, in we show that new and advanced technologies must be available in the near term to achieve the required Blue Map scenario emission reduction goals.
Figure 7. New and existing technologies needed to meet Blue Map scenario: 43 Gt CO2 reductions in 2050.
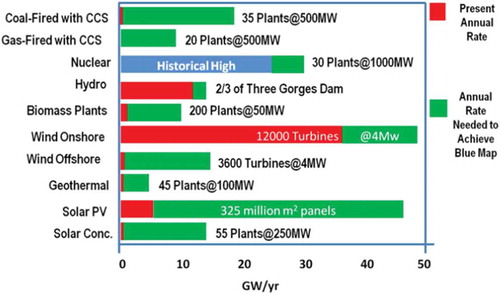
, derived from IEA data (Citation2010), illustrates the magnitude of the annual need of installed low-carbon power generation facilities to reduce emissions consistent with the Blue Map scenario. This graphic illustrates that the world will need to add about 160 GW of low-carbon technologies each year until 2050. Such results suggest that a fundamental and near-term transformation of the power generation sector will be necessary. Such a transformation would require unprecedented construction of nuclear facilities, massive and unprecedented deployment of solar, wind, biomass, and geothermal plants, and a fundamental shift of coal and gas facilities to incorporate carbon capture and storage (CCS) technologies. We discuss the state of the art and research needs for CCS later in this paper. A particular challenge for rapid emission reduction in the power sector is the long lifetime of coal plants. When built, a typical coal-fired power plant has lifetime around 30 years, although in the United States many plants have a lifetime extended to 50 years or more (Union of Concerned Scientists [UCS], Citation2012). This is especially important to China’s and India’s emissions since they have a large number of relatively new power plants. Since the cost of shutting down and replacing a relatively new plant is so high, it may be necessary to develop and install large numbers of affordable retrofit technologies in those countries.
Figure 8. Annual capacity additions of power generation plants and their GW per year production needed for Blue Map scenario (note: CSP=concentrated solar power).
Examining Technological Challenges
50% CO2 mitigation and implications for the U.S. power sector
Similarly, major CO2 reductions within the United States would require fundamental changes in how energy is produced and used. The magnitude of such a transformation is illustrated in an application of the MARKet ALlocation (MARKAL) (Fishbone and Abilock, Citation1981; Loulou et al., Citation2004) and the U.S. Environmental Protection Agency (EPA) MARKAL 9-region database (EPA, Citation2013) by Akhtar et al. (Citation2013). In that application, U.S. energy system-wide CO2 emissions were reduced by 50% from 2005 to 2050. While a 50% reduction is modest in the context of the per capita mitigation needs discussed earlier in this paper, it is similar to the energy system reductions expected with legislative proposals such as the American Clean Energy and Security Act of 2009 (U.S. Congress, Citation2009; EPA, 2009) and to the 53% global CO2 reduction target, 53% from 2007 to 2050, outlined by IEA (2014). Akhtar et al. allowed MARKAL to meet this hypothetical 50% mitigation target by selecting least-cost regional combinations of renewable energy, low-carbon fuels, energy-efficient end-use technologies, and applying carbon capture and storage technologies to electric sector coal and natural gas technologies. Behavioral changes, such as reductions in vehicle-miles traveled and lower utilization of space heating and lighting, were not considered, nor were the implications of the Fukushima nuclear accident.
National CO2 emissions for the baseline and mitigation scenarios are shown in . The figure also depicts corresponding technology penetrations in the power sector and in the light-duty transportation sector.
Figure 9. Example of potential impact of a CO2 mitigation scenario on the U.S. energy system: baseline and 50% energy system CO2 reduction.
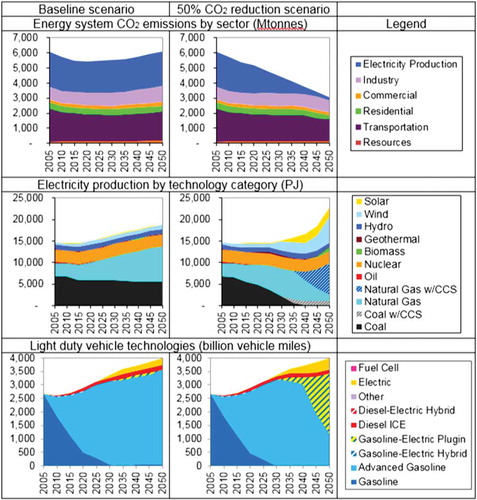
MARKAL results indicate a least-cost mitigation strategy that involves disproportionately high emission reductions from the power sector. In the near term, this transformation includes a rapid transition in electricity production from coal to natural gas, combined with the adoption of more energy-efficient end-use technologies in other sectors. From 2035, however, coal generation requires carbon capture and storage (CCS), and CCS is increasingly applied to natural gas turbines. Electricity production from wind, solar power, and biomass technologies is also expanded. As the supply of electricity becomes very low in carbon, end-use technologies transition from other fuels to electricity, as evidenced by the increase in electrified vehicles in the mitigation scenario.
The study also examined electricity production at the U.S. Census Division level. For example, presents regional and national electricity production in 2005 and 2050 for a baseline scenario, and in 2050 for the 50% mitigation scenario.
Table 1. Illustrative example of the transformation in energy production (PJ) that would be required under a 50% energy system CO2 reduction scenario, with model results from Akhtar et al. (Citation2013)
Under the mitigation scenario, regional electricity production mixes in many regions are radically different than the baseline scenario. Undoubtedly, implementing such a scenario would yield challenges. The readiness of CCS technologies for commercial deployment is discussed later in this paper. The electric grid would require improvements to integrate large-scale wind and solar technologies, both of which have variable output. Given the need for massive introduction of low carbon technologies as illustrated in , the potential for serious environmental impacts of such technologies needs to be recognized. Examples of such potential impacts include leakage of stored sequestered CO2 into water-supply aquifers, land and ultimate solid waste disposal impacts of hundreds of square miles of photovoltaic panels, biomass production, and wind-farm impacts on ecosystems.
At the same time, however, adoption of clean energy and energy efficiency can result in lower pollutant emissions than fossil fuel combustion. The MARKAL study suggests that the 50% mitigation strategy reduces PM-related health costs in 2030 by approximately 25%.
While there may be many alternative pathways to mitigation, additional research is needed to understand more fully the associated logistical constraints and environmental costs and benefits. Endogenizing these costs and benefits into a mitigation design process may help prioritize mitigation technologies and pathways.
Limited RD&D expenditures
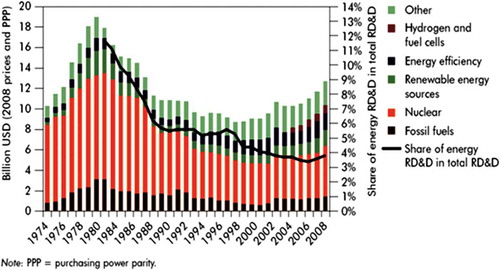
In , IEA (2008) depicts historical research expenditures of member countries in critical energy technology areas. illustrates the relatively flat funding in recent years and the major funding reductions since the funding initiatives in the 1970s motivated by the Middle East oil embargo. also indicates that such RD&D spending represents only about 4% of all spending. The largest single category is defense spending, which in the United States represents half of all research funding.
Figure 10. Government energy technology RD&D funding in IEA member countries, 1974–2008.
IEA also estimated the needed RD&D funding for key energy technologies, based on the assumption that such funding levels would be on the order of 10 to 20% of the deployment costs necessary to achieve a 50% reduction in global CO2 emissions by 2050. Such deployment costs were estimated at $16–21 trillion for the 40-year period 2010 to 2050. IEA defines deployment costs as the total investment over time needed to allow evolving technologies to improve to the point that they are considered commercial and affordable in the context of an aggressive mitigation program.
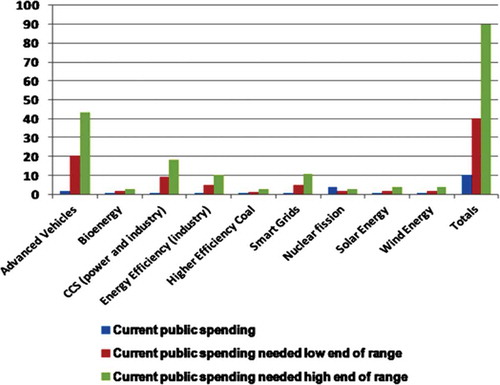
summarizes IEA analysis of actual versus needed global energy technology RD&D funding for key technologies required to achieve their Blue Map 50% reduction scenario. Actual funding is a small fraction of what IEA concludes is required. The total annual required funding is estimated at $40–$90 billion, whereas actual spending for these key technologies is estimated to be only $10 billion per year.
Figure 11. Recent annual RD&D funding for key technologies versus needed funding (high and low ranges), billions of dollars.
Fossil fuel combustion: The most important source
More than 90% of all global CO2 emissions are a result of the combustion of fossil fuels (IEA, Citation2008). In recent years, it has been the developing countries (e.g., those not in the Organization for Economic Cooperation and Development) that have been building and operating coal-fired power plants at a rapid rate, which has been the major factor in escalating emissions. China and India have been especially active in expanding their coal fleet in recent years. This trend is expected to continue. As mentioned earlier, coal-fired power plants typically have lifetimes of 30 years or more, and none of the existing plants mitigates its CO2 emissions. Assuming permanent near-term shut down of such plants is infeasible, carbon capture and storage (CCS) retrofits would be necessary to dramatically reduce emissions from these plants.
Mitigation implications of the Fukushima accident
Another factor exacerbating the CO2 mitigation challenge is the public perception of nuclear power, given the serious damage to several of Japan’s nuclear reactors as a result of the massive earthquake and tsunami that devastated northern Japan on April 7, 2011 (World Nuclear Association, Citation2013). The Fukushima I and II power plants were most seriously damaged, with fires, explosions, and radioactive leakage. As a result of this unexpected and massive damage to Japan’s nuclear capability, Japan announced plans to phase out its nuclear program with no new plants to be built (Inajima and Okada, Citation2011). Recent proclamations by the Japanese government are less definitive, but the future of nuclear power in Japan is uncertain at best (McCurry, Citation2013). Germany has also announced its intention to phase out its nuclear program (Breidthardt, Citation2011). Other countries including Italy and Switzerland are considering similar decisions (Patel, Citation2011). The net result is the likelihood that nuclear power will play a significantly less important role in supplying base load electricity in at least the near term.
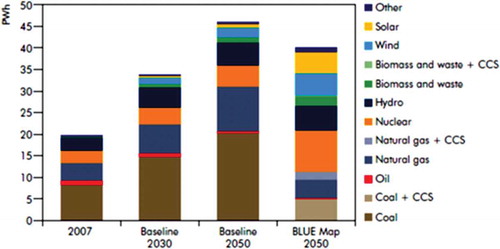
(IEA, Citation2010) illustrates the role that coal (and natural gas) with CCS was projected to play before the Fukushima tsunami, under the Blue Map scenario described earlier. While IEA has projected that nuclear could supply more than 25% of all electricity in 2050, this outcome appears less likely after the Fukushima accident. Recognizing that renewable technologies such as wind and solar cannot readily generate the base load power that nuclear could have provided, coal, natural gas, and energy storage, or some combination of the three, may have to fill much of this gap. Further, to achieve the emission reduction levels assumed in the Blue Map scenario, one would be forced to conclude that CCS will have to play an even greater role than was assumed in the IEA analysis. The assumption of enhanced end-use efficiency lowers overall electricity production in the Blue Map scenario in 2050 relative to the Baseline.
Figure 12. IEA electricity production projections for the Blue Map scenario by technology.
What is the status of CCS technology?
Given the critical role that CCS would be assumed to play, the technology currently is in its early stages. (adapted from IPCC, Citation2005) depicts the three key CCS technologies: precombustion, postcombustion, and oxy-fuel combustion, all with underground sequestration. In , the current state of the art, conversion efficiencies, technological issues, and research challenges are summarized. When comparing efficiencies, modern coal-fired power plants without CCS are capable of efficiencies in the 37 to 45% range, depending upon the steam cycle temperature and pressure (World Coal Association, Citation2013). As indicated in , all the current CCS technologies substantially reduce conversion efficiency. Such efficiency degradation leads to higher operational costs and more impacts associated with the mining and transportation of coal per unit of power output. Although deep saline reservoirs will be needed for the scale of CO2 storage needed, enhanced oil recovery (EOR) opportunities will be important in enhancing the economics of such systems in the near-term. As can be seen in the next to last column, the RD&D needs for all three technologies are great, given the lack of large pilot- and utility-scale operation on both the capture a sequestration operations.
Figure 13. The three key CCS technologies. Adapted from IPCC (Citation2005).
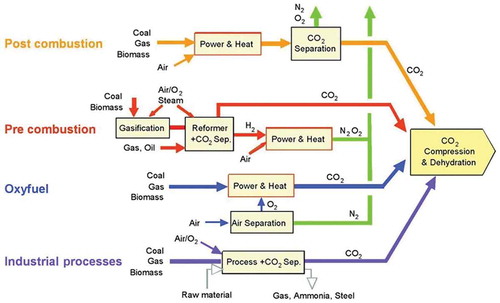
Table 2. Status of the three key CCS technologies
Current CCS research, development, and demonstration program
There are active research and pilot operations ongoing for these three capture technologies in the United States, Canada, the United Kingdom, the EU, and Australia, among others. , derived from MIT’s database (MIT, Citation2013), summarizes the status of the U.S. and Canadian large-scale power generation CCS projects. Five large-scale demonstrations in the United States and two in Canada are in the planning or construction phases. Precombustion via the integrated gasification combined cycle (IGCC), postcombustion (amine scrubbing), and combustion (oxy-fuel) technologies are all represented. Either enhanced oil recovery (EOR) or deep saline aquifer (DSA) storage was selected as the storage medium. Given the current demonstration schedules, it appears that we will have a much better understanding of the performance and economics of key CCS technologies in the 2016 to 2020 time frame. Although EOR has the advantage of potentially providing revenue for the petroleum extracted, there is not nearly enough EOR capacity to store the CO2 that would be associated with a serious national power generation mitigation program. In addition, petroleum extracted will ultimately be refined and the refined components will be burned, generating more CO2 than was stored (Farr et al., Citation2013).
Table 3. Large-scale power plant CSS projects planned or under construction in United States or Canada, derived from MIT (Citation2013)
The U.S. Department of Energy (DOE) also has a significant sequestration field assessment program, testing injection of CO2 into a number of geologic formations on both small and large scales. The DOE sequestration program has supported projects implementing CO2 injection in other countries, including Canada, Algeria, Norway, Australia, and Germany (U.S. DOE, Citation2013). The program also has supported complementary RD&D projects investigating and assessing risks associated with storage options, as well as monitoring the fate of the injected CO2. These efforts provide a baseline of experience, but projects thus far have been on scales far smaller than would be required for commercial applications.
Geoengineering: Can it buy us time?
Geoengineering is a potential supplemental mitigative approach that at least in concept could buy humanity some time to dramatically reduce GHG emissions. Seen as a delaying tactic or as a possible “last resort” action to limit catastrophic climate change, geoengineering is receiving increasing attention in the scientific community. Geoengineering measures attempt to compensate for GHG emissions via two fundamentally distinct approaches: (1) intentionally changing Earth’s solar radiation balance, or (2) removing CO2 from the atmosphere. See for key options for these two categories identified in the literature (T. Felgenhauer, U.S. Environmental Protection Agency, personal communication, Citation2013).
Figure 14. Selected list of geoengineering concepts (Felgenhauer, 2013).
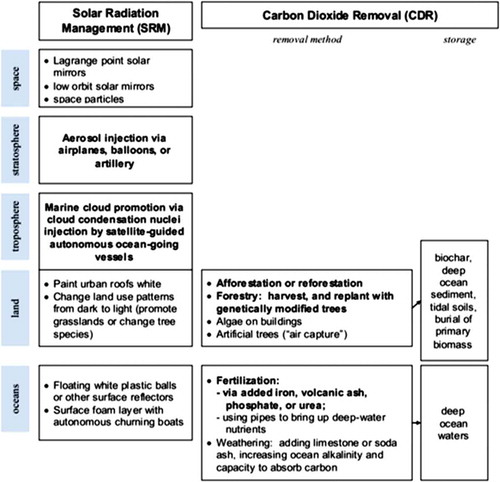
These options are only at the conceptual stage, with only limited research conducted to date. Key questions that must be answered for each concept before such they can be seriously considered (Hemming and Hagler, Citation2011) include:
What are the expected time frame and magnitude of global climate response to the proposed geoengineering action?
What are the immediate ancillary (positive and negative) consequences associated with the action?
What are the long-term risks associated with sustained greenhouse warming mitigation using this strategy (e.g., years to decades)?
What are the immediate and long-term financial, material, and personnel demands for this strategy?
How scalable and reversible is this strategy?
Is the risk of unintended consequences distributed evenly or would some regions of the world pay a higher price? The complexity of the climate system strongly suggests that there will be winners and losers if climate is intentionally managed using the schemes proposed to date. How will the losers be identified and compensated?
How do each of the suggested geoengineering strategies compare on a cost per tonne CO2 basis? The current literature, between global climate modeling studies to evaluate the effects of reduced solar flux and proposed projects to extract CO2 from the atmosphere, does not provide a common metric for comparing costs.
While the viability of geoengineering as a serious climate management strategy is the subject of debate, the scientists participating in these discussions agree that aggressive action toward cutting GHG emissions should not be supplanted by geoengineering (Hemming and Hagler, Citation2011). Geoengineering, at best, should be regarded as a short-term strategy in the context of long-term management of humanity’s GHG emissions.
Adaptation Will Be Needed
There appears to be a high probability that even if the global community decides to deal with GHG emissions aggressively, substantial warming will still occur with serious impacts on human settlements. Even if the current 3% emission growth rate transitions to a 1% decreasing rate, substantial warming is projected. We evaluate such a scenario, along with alternative start years, using the Model for the Assessment of Greenhouse-gas Induced Climate Change (MAGICC) model, version 5.3 (Wigley, Citation2008; Fordham et al., Citation2012). Results are shown in .
Figure 15. What appear to be realistic warming scenarios, assuming a less than transformational global mitigation program?
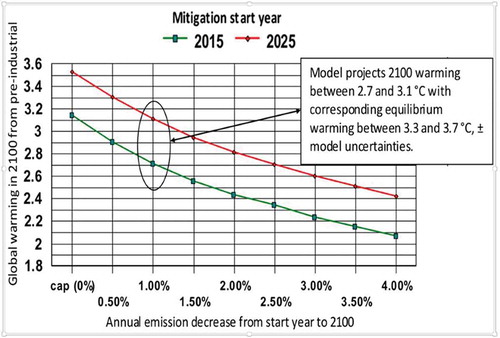
Depending on whether such mitigation starts in 2015 or 2025, MAGICC estimates warming in 2100 to be between 2.7 and 3.1°C,with the corresponding equilibrium warming between 3.3 and 3.7°C, plus or minus the model uncertainties, from preindustrial values. If the other GHGs are mitigated aggressively, additional warming reduction of ˜0.6ºC can be achieved by 2100. For the model calculations the MAGICC default values were assumed, which includes an assumption of atmospheric senstitivity to doubling of CO2 at 3ºC.
To illustrate the potential impact of such levels of warming, we generated and using SCENGEN, a global and regional climate change scenario generator that is coupled with the MAGICC model. These figures show the projected warming and precipitation changes in July, 2100. In the modeled scenario, CO2 emissions are reduced 1% per year between 2025 and 2100. These projections, illustrated in , show large areas in North America, Asia, Africa, and South America where warming is projected to be greater than 4.5°C in 2100 compared to 1990 (the basis of the figure), and greater than 4.9°C relative to the preindustrial era. As can also be seen, resulting warming over land is substantially greater than over the oceans, especially at the higher latitudes. Perhaps even more significant are the major changes projected for precipitation annually.
Figure 16. Projected change in July mean temperature (1990 to 2100) for a less than transformational mitigation approach.
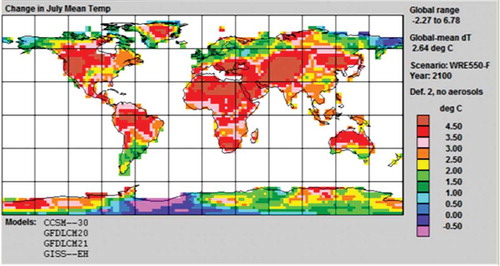
Figure 17. Projected change in July precipitation (1990 to 2100) for a less than transformational mitigation approach.
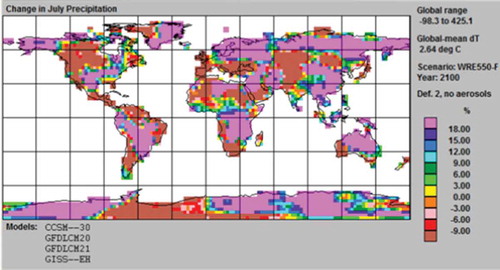
As illustrated in , the model projects currently dry areas will get dryer and wetter areas will get wetter. The areas projected to receive less precipitation will have the added burden of increased evaporation due to the warmer temperatures, yielding the potential for serious drought conditions. Thus, even assuming a major global emission mitigation program (a 1% annual reduction for decades), humanity will have to adapt to fundamentally and dramatically changed weather patterns. The IPCC (2007) concluded that poorer countries will have the most difficulty in implementing required adaptation measures.
Another concern is related to the national and global security implications of climate change. Defense Secretary Leon Panetta (Simeone, Citation2012) conveyed the concern of the U.S. Department of Defense that climate change impacts, such as drought, extreme weather conditions, and rising sea levels, may challenge the stability of many nations by inducing tremendous economic, agricultural, and health stresses.
Summary
GHG emissions have grown exponentially over the past 50 years, driven both by an increasing global population and by increasing per-capita demands for energy- and resource-intensive goods, foods, and services. Models project that if humanity continues on its fossil fuel-intensive trajectory, global mean temperatures will rise 4ºC as soon as 2065, accompanied by impacts such as sea-level rise, ocean acidification, and more severe heat waves and droughts. These changes will impact ecosystems, agriculture, and built infrastructure, thus posing a major threat to long-term human settlement sustainability.
Steps needed to avoid catastrophic impacts can be delineated and quantified. In this review, we discuss projected warming estimates, vectors driving GHG emissions growth, emission reduction needs, technology pathways for meeting those needs both at the global and national level, and research and development priorities. Per-capita analysis further helps quantify the challenge. The CO2 per-capita annual emission rate globally must be reduced from 4.1 tonnes in 2008 to less than 1.3 tonnes by 2050 in order to limit warming to about 2ºC. Emission rates in 2008 for the United States and the industrialized countries, taken collectively, were 17 and 10.2 tonnes, respectively. However, as the developed world industrializes and urbanizes, if this drives global per-capita levels to those associated with the current industrialized world, emissions would more than triple in 2050 compared to current values. The mitigation challenge is daunting; to constrain warming to approximately 2ºC, the recent 3% annual growth in GHG emissions must be transformed into an approximately 3% annual decline for decades.
As commercialized technologies are capable of achieving less than half of the reductions needed, new technologies must be developed and deployed at a rapid rate, especially for the power generation and transportation sectors. Global research, development, and deployment efforts appear to fall far short of what is needed. Although geoengineering options have been proposed to allow more time for serious emission reductions, these options are only at the conceptual stage and have many unanswered cost, environmental, and political issues. Although this paper focuses on low-carbon technologies and practices, the mitigation challenge likely goes beyond what is feasible by technology alone.
Additional steps may need to be taken to move humanity away from its current energy- and resource-intensive culture to a more sustainable model. Reducing resource demands not only has the potential to reduce GHGs; co-benefits may include improved air and water quality, improved ecosystem services (forest and ocean health), and reduced mineral resource depletion. However, at the other end of the environmental impact spectrum, given the need for massive introduction of low-carbon technologies, the potential for serious environmental impacts of such technologies needs to be recognized and impacts need to be ameliorated if required. Examples of such potential impacts include leakage of stored sequestered CO2 into water-supply aquifers, land and ultimate solid waste disposal impacts of hundreds of square miles of photovoltaic panels, and biomass production and wind-farm impacts on ecosystems.
Acknowledgment
The authors thank the many people who have contributed to this work, including Gloria Fuller of the EPA, who assisted in preparation of this document, and the members of the Energy and Climate Assessment Team (ECAT) of the EPA Office of Research and Development, who developed the U.S. nine-region MARKAL. The MARKAL results that are presented were developed using a derivative of that database, as described in Akhtar et al. (Citation2013).
Disclaimer
While this work has been cleared through the Office of Research and Development clearance process, the views expressed herein are those of the authors and do not necessarily reflect the views or policies of the U.S. Environmental Protection Agency. Mention of trade names or commercial products does not constitute agency endorsement or recommendation for use.
Additional information
Notes on contributors
Frank T. Princiotta
Frank T. Princiotta is the director of the Air Pollution Prevention and Control Division, and Daniel H. Loughlin is an environmental scientist at the U.S. Environmental Protection Agency, Office of Research and Development, National Risk Management Research Laboratory, Air Pollution Prevention and Control Division, Research Triangle Park, NC.
Daniel H. Loughlin
Frank T. Princiotta is the director of the Air Pollution Prevention and Control Division, and Daniel H. Loughlin is an environmental scientist at the U.S. Environmental Protection Agency, Office of Research and Development, National Risk Management Research Laboratory, Air Pollution Prevention and Control Division, Research Triangle Park, NC.
References
- Akhtar, F.H., R.W. Pinder, D.H. Loughlin, and D.K. Henze. 2013. GLIMPSE: A rapid decision framework for energy and environmental policy. Environ. Sci. Technol. 47:12011–19. doi:10.1021/es402283j
- Arndt, D.S., M.O. Baringer, and M.R. Johnson ( Eds.). 2010: State of the climate in 2009. bullet. Am. Meteorol. Soc. 91(7): S1–224. doi:10.1175/BAMS-91-7-StateoftheClimate
- Betts, R.A., M. Collins, D.L. Hemming, C.D. Jones, J.A. Lowe, and M.G. Sanderson. 2011. When could global warming reach 4ºC? Philos. Trans. R. Soc. A 369(1934): 67–84. doi:10.1098/rsta.2010.0283
- Breidthardt, A. 2011. German government wants nuclear exit by 2022 at latest. Reuters, May 30. http://uk.reuters.com/article/2011/05/30/us-germany-nuclear-idUKTRE74Q2P120110530 (accessed August 28, 2013).
- Farr, J.M., J. Monast, and T. Profeta. 2013. Regulating carbon under Section 111(d) of the CAA: Options, limits and impacts. Duke Nicholas Institute Report. http://nicholasinstitute.duke.edu/climate/policydesign/regulating-carbon-dioxide-under-section-111d#.Ugf9iIvD-JA (accessed August 26, 2013)
- Fishbone, L.G., and H. Abilock. 1981. MARKAL, a linear programming model for energy systems analysis: Technical description of the BNL version. Energy Res. 5:353–75. doi:10.1002/(ISSN)1099-114X
- Fordham, D.A., T.M.L. Wigley, M.J. Watts, and B.W. Brook. 2012. Strengthening forecasts of climate change impacts with multi-model ensemble averaged projections using MAGICC/SCENGEN 5.3. Ecography 35. doi:10.1111/j.1600-0587.2011.07398.x
- Global Carbon Project 2012. 2012. Website: http://www.globalcarbonproject.org (accessed August 28, 2013)
- Hansen, J., R. Ruedy, M. Sato, and K. Lo. 2010. Global surface temperature change. Rev. Geophys. 48: RG4004. doi:10.1029/2010RG000345
- Hemming, B., and G. Hagler. 2011. Geoengineering: Direct mitigation of climate warming. In Global climate change—The technology challenge, ed. F. Princiotta, 273–99. Netherlands: Springer Publications.
- Inajima, T., and Y. Okada. 2011. Nuclear promotion dropped in Japan Energy Policy after Fukushima. Bloomberg, October 27. http://www.bloomberg.com/news/2011-10-28/nuclear-promotion-dropped-in-japan-energy-policy-after-fukushima.html ( accessed August 28, 2013)
- International Energy Agency. 2008. World energy outlook 2008. Paris, France: IEA Publications.
- International Energy Agency. 2010. Energy technology perspectives 2010. Paris, France: IEA Publications.
- International Energy Agency. 2012. Global carbon-dioxide emissions increase by 1.0 Gt in 2011 to record high. Press releases and news. May 24, 2012. http://www.iea.org/newsroomandevents/news/2012/may/name,27216,en.html (accessed August 27, 2013).
- Intergovernmental Panel on Climate Change, IPCC Working Group III. 2000. IPCC special report on emissions scenarios: Summary for policymakers. Cambridge, UK: Cambridge University Press.
- Intergovernmental Panel on Climate Change (IPCC), IPCC Working Group III. 2005. IPCC special report on carbon dioxide capture and storage. Cambridge, UK: Cambridge University Press.
- Intergovernmental Panel on Climate Change. 2007. Climate change 2007: The physical science basis: Contribution of Working Group I to the Fourth Assessment Report of the Intergovernmental Panel on Climate Change, ed. S. Solomon et al. New York, NY: Cambridge University Press.
- Intergovernmental Panel on Climate Change. 2014. Climate change 2014: Human settlements, infrastructure & spatial planning. Report accepted by Working Group III of the IPCC but not yet approved in detail. http://report.mitigation2014.org/drafts/final-draft-postplenary/ipcc_wg3_ar5_final-draft_postplenary_chapter12.pdf (accessed May 1, 2014).
- Le Quéré, C., R. Andres, T. Boden, et al. 2013. The global carbon budget 1959–2011. Earth Syst. Sci. Data Discuss. doi:10.5194/essdd-5-165-2013
- Loulou R, G. Goldstein, and K. Noble. 2004. Documentation for the MARKAL family of models. Energy Technology Systems Analysis Programme: Paris, France. http://www.etsap.org/tools.htm (accessed September 15, 2011).
- Massachusetts Institute of Technology. 2013. Carbon capture and sequestration technologies @ MIT. CCS Project Database. http://sequestration.mit.edu/tools/projects/index_capture.html (accessed August 26, 2013).
- Meinshausen, M., N. Meinschausen, W. Hare, S.C.B. Raper, K. Frieler, R. Knutti, D.J. Frame, and M.R. Allen. 2009. Greenhouse-gas emission targets for limiting global warming to 2 °C.Nature. 458:1158–62. doi:10.1038/nature08017
- McCurry, J. 2013. Japan seeks to reverse commitment to phase out nuclear power. The Guardian, January 11. http://www.theguardian.com/environment/2013/jan/11/japan-reverse-nuclear-phase-out (accessed August 28, 2013).
- Olivier, J.G.J., G. Janssens-Maenhout, M. Muntean, and J. A.W.W. Peters. 2013. Trends in global CO2 emissions (Background studies report). The Hague, The Netherlands: PBL Netherlands Environmental Assessment Agency.
- Patel, P. 2011. Fukushima’s impact on nuclear power. Tech Talk, IEEE Spectrum. http://spectrum.ieee.org/tech-talk/energy/nuclear/fukushimas-impact-on-nuclear-power (accessed May 2, 2014).
- Peters, G.P., G. Marland, C. Le Quere, T. Boden, J.G. Canadell, and M.R. Raupach. 2011. Rapid growth in CO2 emissions after the 2008–2009 global financial crisis. Nat. Clim. Change 2(2–4). doi:10.1038/nclimate1332
- Princiotta, F. 2011. Global climate change—The technology challenge. In Global climate change—The technology challenge, ed. F. Princiotta, 1–50. Netherlands: Springer Publications.
- Sanderson, M.G., D.L. Hemming, and R.A. Betts. 2010. Regional temperature and precipitation changes under high-end (4o C) global warming. Philos. Trans. R. Soc. A 369(1934): 85–98. doi:10.1098/rsta.2010.0283
- Simeone, N. 2012. Panetta: Remarks at an Environmental Defense Meeting, American Forces Press Service, U.S. Department of Defense. May 3. http://www.defense.gov/news/newsarticle.aspx?id=116192 (accessed August 28, 2013).
- Union of Concerned Scientists, Cleetus, Clemmer, Davis, Deyette, Downing, Frenkel. 2012. Ripe for retirement—The case for closing America’s costliest coal plants. http://www.ucsusa.org/ripeforretirement
- U.S. Congress. 2009. H.R. 2454: American Clean Energy and Security Act of 2009. http://www.gpo.gov/fdsys/pkg/BILLS-111hr2454pcs/pdf/BILLS-111hr2454pcs.pdf (accessed May 2, 2014).
- U.S. Department of Energy. 2013. Office of NEPA Policy and Compliance. Geologic Carbon dioxide storage field projects supported by DOE’s sequestration program. http://energy.gov/nepa/downloads/geologic-carbon-dioxide-storage-field-projects-supported-doe-s-sequestration-program (accessed August 26, 2013).
- U.S. Environmental Protection Agency. 2009. Office of Air and Radiation. EPA Analysis of the American Clean Energy and Security Act of 2009. http://www.epa.gov/climatechange/Downloads/EPAactivities/HR2454_Analysis.pdf (accessed May 2, 2014).
- U.S. Environmental Protection Agency. 2013. Office of Research and Development. EPA U.S. Nine Region MARKAL Database: Database documentation. Research Triangle Park, NC.
- Warren, R. 2010. The role of interactions in a world implementing adaptation and mitigation solutions to climate change. Philos. Trans. R. Soc. A 2011(369): 233. doi:10.1098/rsta.2010.0271 (published November 29).
- Wigley, T.M.L. 2008. MAGICC/SCENGEN 5.3: User manual. http://www.cgd.ucar.edu/cas/wigley/magicc/UserMan5.3.v2.pdf (accessed August 28, 2013).
- World Coal Association. 2013. Improving efficiency. http://www.worldcoal.org/coal-the-environment/coal-use-the-environment/improving-efficiencies (accessed August 27, 2013).
- World Nuclear Association. 2013. Fukushima accident 2011. Updated August 23, 2013. http://world-nuclear.org/info/Safety-and-Security/Safety-of-Plants/Fukushima-Accident-2011/#.Uhz8ctK-p01 (accessed August 28, 2013).