
Abstract
The main research objective of this study is to enhance the removal of recalcitrant compounds that are not readily bioavailable due to limiting mass transfer rate between the liquid and gas phases. Four trickle-bed air biofilters (TBABs), loaded with pelletized diatomaceous earth support media, were run at an empty bed residence time (EBRT) of 120 sec. After an acclimation period at constant loading rate (LR) of n-hexane (13.2 g m−3 hr−1) and intermittent feeding of methanol, n-hexane influent LR was then increased in step-wise fashion to 47.7 g m−3 hr−1 for biofilters receiving acidic nutrients (pH 4), and to 36.3 g m−3 hr−1 for biofilters receiving nutrient at pH 7. The results have shown that for TBABs receiving nutrient at pH 4, greater elimination capacities were obtained as compared to TBABs working at pH 7. n-Hexane removal efficiency of more than 84% at LR up to 47.7 g m−3 hr−1 was obtained for pH 4 nutrient-fed biofilters, while for biofilters with nutrients fed at pH 7, the removal efficiency did not exceed 64% for n-hexane LR of 36.3 g m−3 hr−1. The microbial analysis revealed that no fungal community was detected in TBABs run at neutral pH. The fungi communities that were initially acclimating TBABs run at pH 4, namely, Aspergillus niger and Fusarium solani, were not detected at the end of the experiment, while Gibberella moniliformis (Fusarium verticillioides) genus became the dominant species. Gibberella moniliformis (Fusarium verticillioides) was present along all the biofilter media and sustained very high n-hexane elimination at steady-state condition.
Implications:
With growing apprehension about sustainability and environmental protection, with limited resources available, and with the passage of the 1990 Amendments to the Clean Air Act, there is more need for using air pollution control techniques that are sound economically and proven environmentally friendly. Biofiltration systems, namely, trickle-bed air biofilters, were for decades recognized as efficient in treating air pollutants. Thus, the application of this technique over a wide industrial spectrum would certainly contribute to reduction of hazardous gas emissions.
Introduction
In a world where there is growing apprehension about sustainability and environmental protection, global warming and greenhouse gas emissions receive more public awareness and concern. As a consequence, technologies for treatment of these gases also become of paramount interest because of the limited resources available and the requirement for the use of air pollution control techniques that are proven to be economical and environmentally friendly. In fact, with the passage of the 1990 Amendments to the Clean Air Act, gas-releasing facilities have been significantly affected by the rigorous application of regulations, standards, guidelines, and volatile organic compounds (VOCs) codes emissions (U.S. Environmental Protection Agency [EPA], Citation1990). To comply with the authorities’ emission requirements in achieving reduced concentration levels of VOCs emissions, the development of techniques that enhance air quality was evaluated.
In this regard, biofiltration systems have been for decades the most appropriate option, being proven the most economical, robust, and reliable alternative to conventional technologies (bioscrubbing, physical, chemical, and incineration), and they are an environmentally friendly technique for combating emitted VOCs (Estrada et al., Citation2010). In fact, biofiltration systems offer a very flexible option in their maintenance and of their benign by-product effluents. More remarkably, trickle-bed air biofilters (TBABs) offer more optimal and controllable operations along with low maintenance costs over traditional biofilters. Thus, they are more efficient in treating VOCs that do not engender acidic by-products (Deshusses and Cox, Citation2000). Furthermore, due to their higher and consistent removal efficiency performance and harmless by-products generated, TBABs are increasingly used for a wide spectrum of industrial applications (Sempere et al., Citation2009).
The performance of TBABs is significantly affected by the VOCs’ solubility in water and their Henry’s law constant (Zhu et al., Citation2004). Hydrophilic compounds are more easily biodegradable than hydrophobic ones, which are more resilient to degradation. In most cases, mass transfer from gas to liquid phase is rate-limiting in TBABs. Thus, an increase in bioavailability of VOCs will facilitate their biodegradation by microorganisms. Many processes were tested for addressing the bioavailability of hydrophobic contaminants. One is the introduction of surfactants (Aly Hassan and Sorial, Citation2008; Woertz and Kinney, Citation2004), providing favorable conditions for fungi (Aly Hassan and Sorial, Citation2008; Arriaga and Revah, Citation2005a; Hernández-Meléndez et al., Citation2008; Spigno and De Faveri, Citation2005; Van Groenestijn et al., Citation2001); others include mixture of n-hexane with other less hydrophobic compound such as benzene (Aly Hassan and Sorial, Citation2010a), introduction of more hydrophilic contaminants in mixture with n-hexane, such methanol (Zehraoui et al., Citation2012, Citation2013), and most recently the alternate use of methanol with n-hexane (Zehraoui et al., Citation2014).
n-Hexane was the subject of many studies for being insoluble in water. It is commonly used in a broad range of industrial applications, which eventually lead to its emission from different sources such as printing and publishing, polymer and human-made fiber, pulp and paper, and organic chemical industries (Zehraoui et al., Citation2012, Citation2013; Zehraoui et al., Citation2014). The reported literature reviews were on behalf of its biodegradation in traditional biofilters, TBABs, or in new technologies such as the silicone oil-amended biofilter, two liquid phase biofiltration, and two-phase partitioning bioreactor. The results were varied according to the biofilter or reactor used, support medium, and mode of operation. For instance, Zehraoui et al. (Citation2013) obtained a very high removal efficiency (RE) of 95% with high stability for treating n-hexane after a period of use with methanol at a loading rate (LR) of 13.2 g m−3 hr−1, which corresponds to an elimination capacity (EC) of 12.5 gm−3 hr−1. Previously, Aly Hassan and Sorial (Citation2010a) obtained a 90% in RE at a LR of 47.7 g m−3 hr−1 for a TBAB operating at pH 4. For TBABs operating at pH 7 with and without surfactant, the elimination capacities observed were 12.6 and 8.0 g m−3 hr−1, respectively, for LR of 21.5 g m−3 hr−1 (Aly Hassan and Sorial, Citation2010a). Other results obtained in other new technologies showed very high ECs, but either with low efficiencies, frequent instability in performance, or very short duration of study . For instance, Arriaga and Revah (Citation2005a) obtained an average EC of 60 g m−3 hr−1 for n-hexane load of 119 g m−3 hr−1 in a perlite-packed biofilter (i.e., 50% in RE). van Groenestijn and Lake (Citation1999) used a mixture of silicone oil and water as the trickling medium for n-hexane removal and obtained an EC of 80 g m−3 hr−1 for n-hexane load of 97 g m−3 hr−1. Although the study was promising, the high empty bed residence time (EBRT) used prohibits its economical feasibility for industrial-scale application. In another study, Fazaelipoor et al. (Citation2006) obtained an ECmax of 167 g m−3 hr−1 for the silicone oil-amended biofilter, while for the control biofilter without silicone oil the ECmax obtained was 114.9 g m−3 hr−1 for a 70-days operation.
On the other hand, as the performance of any biofilter is correlated with its active biomass, it is crucial to understand and investigate the microbial ecology within the media biofilm. Current literature shows a very great interest in using molecular biology techniques for microbial species identification from environmental samples (García-Peña et al., Citation2008; Vigueras et al., Citation2009). Most reported species for n-hexane biodegradation were Fusarium solani (Arriaga and Revah, Citation2005b; Hernández-Meléndez et al., Citation2008), Rhinocladiella similis (Vigueras et al., Citation2009), and Aspergillus niger (Spigno et al., Citation2003). Combination of Fusarium solani, Aspergillus niger, and Dothioraceae. sp. was reported by Zehraoui et al. (Citation2014). The results of all of these studies were in favor of biodegrading n-hexane using acidic nutrient to enhance fungi growth over bacteria and hence achieving better performances (Aly Hassan and Sorial, Citation2010b). The reasons behind using fungi in biodegradation of hydrophobic VOCs could be due its filamentous structure with aerial mycelia and large surface area, which could capture the contaminant while it is still in the gas phase. Other advantages in using fungi over bacteria include their capability to degrade a large number of pollutants, as well as their tolerance to harsh and stressed environmental conditions where bacterial growth might be limited (Vigueras et al., Citation2009).
The main research objective of this work is, therefore, the long term removal of recalcitrant compounds that are not readily bioavailable due to the limiting mass transfer rate between the liquid and gas phases. For this purpose, n-hexane is used in this study as a model hydrophobic compound to represent recalcitrant compounds. It is included in the 1990 Clean Air Amendment (EPA, Citation1990). The reported dimensionless Henry’s law constant at 25°C for n-hexane is 40.7 ± 2.78 (Yang et al., Citation2010). Four trickle-bed air biofilters (TBAB). A, B, C, and D, were previously run at a constant loading rate of n-hexane and intermittent addition of methanol (Zehraoui et al., Citation2014). They were fed with different nutrient pH buffers. TBABs A and B were operated at acidic pH of 4, while TBABs C and D were at neutral pH, with each biofilter receiving an increased n-hexane LR. Characterization and identification of the microbial community within the TBAB media, the effect of n-hexane influent concentration step increase on the performance of the biofilters, biomass control strategies, and other operational parameters such as CO2 closure and biodegradation reaction kinetics, were investigated and results were compared to our previous studies, which served as the control. The methods used to control biomass growth were a combination of stagnation and flow-switching and occasional backwashing.
Materials and Methods
Trickling biofilters
n-Hexane used in this study was obtained from Fisher Scientific (Fair Lawn, NJ) with 95% purity. It has been fed to four TBABs: A, B, C, and D. The TBABs were run independently in this study. The TBABs were made up of seven cylindrical glass sections with an internal diameter of 7.6 cm and a total length of 130 cm. They were packed with pelletized diatomaceous earth biological support media to a depth of about 60 cm (Celite 6 mm R-635 Bio-Catalyst Carrier; Celite Corp., Lompoc, CA). presents a schematic of the TBAB setup. More details can be found in a previous work by Cai et al. (Citation2005).
Figure 1. Schematic of the TBAB.
Sodium formate was used as buffer for TBABs fed with nutrient at pH 4, while sodium bicarbonate was used as buffer for TBABs fed with nutrient buffered at pH 7.
The airflow was set up at a rate of 1.36 L min−1 with a corresponding empty bed retention time (EBRT) of 120 sec. Liquid n-hexane was injected via a syringe pump and vaporized into the air stream. Buffered nutrient solution was supplied at a rate of 2.0 L day−1; the composition of the nutrient solution is similar to that reported by Kim et al. (Citation2005c). The experimental runs for the four biofilters were conducted in four phases (I–IV). After the initial startup, TBABs A and B were run for four phases, I through IV, while TBABs C and D were run just for phases I to III.
In order to control biomass growth, a combined procedure of stagnation and flow switching was applied. Flow switching consists of changing the flow of the gas from co-current flow with the liquid nutrients to countercurrent flow or vice versa. Controls have been operated once per week of operation. Such a process might spread the biomass distribution within the entire biofilter media. While stagnation is a complete closure of air, VOCs and buffer nutrient flow for 2 days per week. All these techniques were previously applied in the biofiltration of hydrophilic and hydrophobic VOCs and were proven to be very effective in biomass control (Aly Hassan and Sorial, Citation2010a; Kim et al., Citation2005b; Zehraoui et al., Citation2012, Citation2013).
Analytical methods
Gas-phase samples were taken with gas-tight syringes through low-bleed and high-puncture-tolerance silicone gas chromatograph (GC) septa installed in the sampling ports. Samples for n-hexane were immediately analyzed by using GC (Agilent 6890 Series, Foster City, CA) equipped with flame ionization detector (FID) and 30.0 m × 320 μm × 0.25 μm column (HP-5, 5% Phenyl Methyl Siloxane). The GC oven was programmed to be isothermal at 120°C. The carrier gas helium (He) flow rate was set at 2.7 mL min−1. The FID was used with (He) makeup gas at a flow rate of 45 mL min−1, a fuel gas flow (H2) of 35.3 mL min−1, and an oxidizing gas flow (air) of 450 mL min−1. The detector temperature was 250°C. Retention time of 1.3 min was obtained under these conditions for n-hexane. Carbon dioxide samples were also taken by using gas-tight syringes through sampling ports in the TBAB. A GC (HP 5890, Series II, Hewlett-Packard, Palo Alto, CA) equipped with a thermal conductivity detector (TCD) was used for determining the CO2 concentrations in the effluent gas phase. The detection limit was 0.001%v CO2. A detailed description of the analytical method was provided previously by Cai et al. (Citation2005) and Kim et al. (Citation2005c).
Liquid-phase measurements included influent and effluent concentrations of nitrate, dissolved total carbon (TC), dissolved inorganic carbon (IC), and volatile suspended solids (VSS). Nitrate concentration was determined by measuring ultraviolet (UV) absorption at 220 nm using a Shimadzu UVmini 1240 UV–visible spectrophotometer (Shimadzu Corp., Tokyo, Japan). TC and IC contents of the aqueous samples were determined by using a Shimadzu TOC 5000 analyzer (Shimadzu Corp., Tokyo, Japan). The VSS analysis was carried out according to Standard Method 2540G (Eaton et al., Citation2005).
Microbiology sampling and analysis
The samples were collected at the last week of each of the experimental runs. Therefore, as TBABs A and B were the most prominent and have the highest REs, the emphasis in this study was on fungi detection and characterization, not on bacteria. At the beginning of this experiment, TBABs A and B were mostly dominated by the fungi community (A. niger, F. solani, and Dothioraceae sp.) (Zehraoui et al., Citation2014).
Sample collection and DNA isolation
Biological samples were collected from the top and bottom sampling ports within the biofilter media (). The samples consisted of five media pellets covered with biomass. The pellets were immersed in 20 mL of sterilized water and a 20-sec vortex was necessary to fluff off the biomass. The samples were then conserved at –20ºC until analysis. At room temperature, 2 mL from each of the samples was centrifuged at 13,000 rpm for 2 min using an Eppendorf centrifuge 5417R (Eppendorf, Hamburg, Germany). The pellets obtained were then used for subsequent DNA extraction. The DNA template was extracted using the QIAprep Spin Miniprep kit and QIAcube Machine (QIAGEN Sciences, Germantown, MD) according to the manufacturer’s protocol. The concentration and purity of extracted DNA were analyzed using a NanoDrop 1000 spectrophotometer (Thermo Scientific, Wilmington, DE).
Polymerase chain reaction (PCR) analyses
Polymerase chain reaction (PCR) analysis was performed using 18S rRNA gene. The primers used were forward primer FF102 (5′-CTGAAAGCGTGCAGTCTGAGT-3′) and reverse primer FRev 102 (5′-TTCAGCGGGTATCCCTACCT-3′) for A. niger detection. For the fungus F. solani, forward and reverse primers were 107F (5′-AGAGGACCCCTAACTCTGTTTCT-3′) and 107R (5′-TTTCCTCCGTCTTATTGATATGC-3′), respectively. Both primers were successfully used in our previous work (Zehraoui et al., Citation2014). Another extra universal primer was used to detect more fungi species. ITS86M-F and ITS4M-R were previously used for a wide range of fungi detection (Soeta et al., Citation2009). Forward and reverse primers were ITS86M-F (5′-TGAATCATCGACTCTTTGA-3′) and ITS4M-R (5′-ATAGTTATTCGCCTCC-3′), respectively. For 18S PCRs, 50 μL contained 0.2 mM of primers, 0.8 μL of DFS Tag DNA Polymerase, 5 μL of buffer (Boca Scientific inc, FL), and 1 μL of dNTP Mix N0447L (10 mM) (New England Biolabs, MA), as well as 2 μL of sample DNA. Initial denaturation was at 94 μC for 2 min, followed by 35 cycles of denaturation (at 94ºC), annealing at 56ºC for 107F/107R, at 54ºC for FF102/FRev102, and at 66º°C for ITS86M-F/ITS4M-R, all at 30 sec, and extension at 72ºC for 60 sec.
Microbial sequencing
The PCRs products were then cloned using TA Cloning kits with pCR 2.1 vector and One Shot TOP10 chemically competent Escherichia coli (Life Technologies, San Francisco, CA) according to the manufacturer’s protocol. Selected single large white colonies were placed in LB-ampicillin broth and cultured at 37ºC overnight. The samples were centrifuged and the pellets were sent for further DNA extraction and sequencing to the CCHMC Genetic Variation and Gene Discovery Core Facility (Cincinnati, OH). Vector forward T7 (pCR 2.1) was used as promoter for in vitro RNA transcription and sequencing. Sequences were then submitted to BLAST homology search algorithms to assess similarity to sequences in the 18S rRNA sequences (Fungus) database (NCBI).
Results and Discussion
TBABs performance
Performance of TBABs during initial acclimation period
Initially, the TBABs were acclimated in a previous phase by alternate feed of methanol and continuous feed of n-hexane. During this period, the TBABs received concentration ratios of methanol to n-hexane of (3:1) for TBAB A at pH 4 and TBAB D at pH 7 and (5:1) for TBAB B at pH 4 and TBAB C at pH 7 for 150 days. Afterward, only n-hexane was fed to the TBABs (Zehraoui et al., Citation2014). All TBABs received n-hexane influent concentration of 127 ppmv (13.21 g m−3 hr−1), corresponding to methanol influent concentrations of 975 ppmv (37.7 g m−3 hr−1) and 1668 ppmv (64.5 gm−3 hr−1) depending on concentration ratios of methanol to n-hexane (Zehraoui et al., Citation2014). The removal efficiencies of n-hexane in presence of methanol were 88%, 80%, 41%, and 69% for TBABs A, B, C, and D, respectively(Zehraoui et al., Citation2014). When methanol was suspended and only n-hexane was fed to the TBABs, n-hexane removal efficiencies increased substantially to reach 94%, 95%, 88% and 89% for TBABs A, B, C, and D, respectively. The current study reports the biodegradation performance of n-hexane in these TBABs as sole VOC feed at step increase in LR immediately after this acclimation period. The goal was to check whether after this acclimation period a long-term enhancement in n-hexane elimination is obtained as compared to the previous study where n-hexane was treated under the same operational conditions but without any methanol additions (Aly Hassan and Sorial, Citation2010b).
Performance of TBABs A and B
TBABs A and B were operated at a nutrient feed buffered at pH 4 with n-hexane concentration range from 203 to 450 ppmv, corresponding to LRs 21.1 to 47.7 g m−3 hr−1. The details of operation for TBABs A and B at every phase of operation with corresponding influent concentration, LR, days of operation, RE, and average EC are provided in . The daily results are displayed in and for TBABs A and B, respectively. The figures illustrate the influent and effluent concentrations of n-hexane on the different days of operation and present the removal efficiency as a box plot for the different phases of operation. The box plot summary indicates the 25th and 75th percentiles by the borders of the box, the median by the line within the box, and the 90th and 10th percentiles by the error bars.
Table 1. Operating conditions and performance for TBABs A and B degrading n-hexane at pH 4
Figure 2. Performance of TBAB A with time for degrading n-hexane at pH4.
Figure 3. Performance of TBAB B with time for degrading n-hexane at pH 4.
As mentioned previously, these TBABs were previously acclimated to n-hexane at a concentration level of 127 ppmv in the presence of methanol and then by sole feed of n-hexane. The TBABs were then run at 203 ppmv of n-hexane, providing an LR of 21.1 g m−3 hr−1 using stagnation and flow switching technique for biomass control. The sequential days were set to start from this LR (Phase I). The TBABs with this configuration were working at around 87% (TBAB A) and 90% (TBAB B) removal efficiency with fluctuations of around 4% standard deviation. The shift from 127 ppmv to 203 ppmv did not require any acclimation period for both TBABs. It is noticed from and that only at the start of this run were there small spikes in n-hexane effluent concentrations. On day 57 (Phase II), n-hexane influent concentrations in both TBABs were increased further to 300 ppmv (31 g m−3 hr−1). As the increase in n-hexane influent concentration was 100 ppmv, 5 days were needed for the TBABs to acclimate and stand the shock of surge in the n-hexane influent concentrations. During this phase, the removal efficiency increased to 88.5% and 90% for TBABs A and B, respectively. In general, the removal efficiency showed relatively good performance, suggesting that more time was necessary for fungi to adapt to the new concentration.
Phase III started on day 90; the influent concentration was increased further from 300 to 400 ppmv, corresponding to an LR of 41.5 g m−3 hr−1, while stagnation and flow switching were always applied as the biomass control strategy. Again, during this phase, a 1-week period was necessary for the TBABs to acclimate at this high concentration level. This can be noticed from and . The average removal efficiency decreased to 82.5 ± 1.6% and 82.8 ± 4.3% for TBABs A and B, respectively. On day 132, phase IV was started with an increase in n-hexane influent concentrations in both TBABs from 400 to 450 ppmv corresponding to an LR of 46.7 g m−3 hr−1. A slight increase in removal efficiencies from 82.5 to 83.2% and from 82.8 to 84% in TBABs A and B, respectively, was noticed; 47.7 g m−3h−1 was the maximum LR applied for these two TBABs.
It is worth noting that when the change of n-hexane influent concentration was on the order of 100 ppmv, the TBABs needed an acclimation period of 5 to 7 days to adapt to the new concentration level. However, when the change was on the order of 50 ppmv, the TBABs’ performances increased without the need of any acclimation periods. This is in concordance with findings of Kim et al. (Citation2005a). They demonstrated that hydrophilic compounds were degraded easily and deposited additional cell mass in the biofilter, while degradation of hydrophobic compounds was retarded until biological cultures produced a sufficient RNA or enzyme/protein to utilize these compounds.
Performance of TBABs C and D
TBABs C and D were fed with a nutrient buffered at pH 7. The maximum n-hexane influent concentration applied was 350 ppmv. The sequence of operation applied for TBABs C and D is summarized with the average performance parameters in .
Table 2. Operating conditions and performance for TBABs C and D degrading n-hexane at pH 7
and represent the corresponding daily influent and effluent concentrations in addition to box plots for the removal efficiency for TBABs. Similar to TBABs A and B, TBABs C and D were previously acclimated to n-hexane at lower concentration levels up to 127 ppmv. The TBABs were then run at a concentration level of 203 ppmv with an LR of 21.1g m−3 hr−1 and stagnation and flow switching technique were applied for biomass control (Phase I). Again, the sequential days were set to start from this LR. The removal efficiencies for both TBABs were 68.8 ± 6.6% and 68.2 ± 7.3% for TBABs C and D. The values obtained are far below those obtained for the performances of TBAB A and B under the same conditions.
Figure 4. Performance of TBAB C with time for degrading n-hexane at pH 7.
Figure 5. Performance of TBAB D with time for degrading n-hexane at pH 7.
On day 57, the influent concentration was further increased to 300 ppmv, corresponding to an LR of 31 g m−3 hr−1 (Phase II). The TBABs could not withstand such increase in n-hexane concentration and 10 days was essential for acclimation for both TBABs. It seems that the bacterial community cannot resist a change of 100 ppmv in n-hexane influent concentration as compared to fungi community in TBABs A and B. Furthermore, the removal efficiencies kept decreasing to 62 ± 8% and 67.3± 7.7% for TBABs C and D, respectively. Both TBABs behaved similarly (see and ). For this phase, the TBABs were run for a longer period as compared to TBABs A and B to determine whether any enhancement can be attained. However, as seen in both figures, no stability in performance is attained. On day 127, the concentration was further increased to 350 ppmv, corresponding to 36.3 g m−3 hr−1 (Phase III). The step change in concentration was only 50 ppmv. TBAB C showed a slight increase in performance to 63.2%, while TBAB D continued its decrease in performance to 64.4%. No stability in performance was observed.
Performance Comparison for TBABs A, B, C, and D
TBABs A and B showed higher supremacy in elimination capacity and in performance stability as compared to TBABs C and D. On the other hand, all TBABs did not show higher fluctuations in performances as has been reported previously in n-hexane removal efficiency. The fluctuation in removal efficiency of n-hexane was reported previously without known reason (Aly Hassan and Sorial, Citation2010b) and (Plaggemeier, Citation2000). The overall standard deviation in the removal efficiency was 29%, which is a very high rate as compared to other contaminants degraded in similar TBABs (Cai et al., Citation2006). In this study, the maximum standard deviation noticed in TBABs A and B was 4%, while it was 7.7% for TBABs C and D. In fact, the relatively stable removal efficiency of n-hexane in this study could be more related to the active biomass yielded by initial introduction of methanol. More active biomass was available to enhance the degradation of n-hexane; this has been confirmed by the amount of VSS produced of 150 mg/day as compared to the VSS produced in a previous study (Aly Hassan and Sorial, Citation2010b) where the VSS amount was less than 50 mg/day (data not published).
It is very obvious that fungi utilization greatly enhanced the performance of the TBABs A and B as compared to TBABs C and D working with bacterial community. The switch of microorganisms to fungi has shown superior performance in several studies. Styrene was treated successfully with fungi at a maximum elimination capacity (EC) of 67 g m−3 hr−1 (Rene et al., Citation2010). The same research group could reach ECs up to 336 g m−3 hr−1 using newly isolated fungus Sporothrix variecibatus (Rene et al., Citation2010). In a biofilter treating xylene, fungi were isolated and were identified as the active species in the biofiltration process (Prachuabmom and Panich, Citation2010).
The removal efficiency in the current study increased significantly and reached the upper 84% level. TBABs A and B had similar performances throughout the loading range studied. It should be noted that these TBABs provided higher removal efficiencies and greater elimination capacities as compared to TBABs C and D. These findings were in concordance with our previous published works where TBABs running under acidic conditions, using sodium formate as a nutrient buffer, had always higher performances compare to the TBABs running under neutral pH using sodium bicarbonate as a buffer (Aly Hassan and Sorial, Citation2010b; Zehraoui et al., Citation2012, Citation2013; Zehraoui et al., Citation2014).
On the other hand, even though TBABs C and D, fed by nutrient buffer at pH 7, did not achieve results comparable with those of TBABs A and B, the TBABs supported n-hexane LRs of 36.3 g m−3 hr−1 to achieve an EC of 23.4 g m−3 hr−1. As compared to previous studies and for the same operating conditions, Aly Hassan and Sorial (Citation2010b) obtained a maximum EC of 8 g m−3 hr−1 for an LR of 21.5 g m−3 hr−1 for TBAB working under neutral buffer, while for the same TBAB with surfactant the maximum EC obtained was 8.8 g m−3 hr−1 for an LR of 16.1 g m−3 hr−1. In another study (Aly Hassan and Sorial, Citation2010a) in treating n-hexane with benzene, the maximum EC was 10.16 g m−3 hr−1 for an LR of 21.48 g m−3 hr−1 with a high standard deviation of 32%. In this study, the removal efficiency was greatly enhanced by at least three folds.
summarizes the overall performances of VOCs’ EC versus LR in all TBABs. The diagonal line represents the 100% removal efficiency. It can be seen from the figure that each of the two TBABs run at the same nutrient buffer condition behaved identically. More essential, at all LRs, TBABs A and B have higher and consistent EC as compared to the other TBABs. This confirms the previous observations that fungi provided higher and consistent contaminants removal (40.1 gm−3 hr−1 compared to only 22.4 g m−3 hr−1). Another important observation is that the critical LR was not achieved for all TBABs. This means for TBABs A and B higher LRs could have been studied. However, the objective of this study was to investigate the difference in performance between TBABs run at different nutrient buffer conditions for elimination of n-hexane. It worth noting that for low n-hexane (sole VOC injected) loading rate below 20 gm3 hr−1, 95% in removal efficiency was obtained for TBABs running under acidic conditions, while it varied from 84 and 89% for TBABs running under neutral conditions (Zehraoui et al., Citation2014).
Figure 6. Overall n-hexane elimination capacities versus loading rates in all TBABs.
Carbon Mass Balance
Cumulative CO2 equivalents of n-hexane at the influent as well as at the effluent of all TBABs were computed daily. The major sources of energy and electron donors were n-hexane, plus sodium formate (for TBABs A and B) and sodium bicarbonate (for TBAB C and D), which were used in the nutrient solution. The different contributors to the influent carbon represented as carbon dioxide equivalence consisted of VOC influent gaseous concentration as well as the influent CO2 in the liquid nutrients, although the effluent cumulative CO2 was made up of VOC effluent gaseous concentrations, effluent aqueous carbon, effluent gaseous CO2, and the carbon equivalence of effluent VSS. The carbon recovery rates were 67 ± 5%, 61 ± 6%, 79 ± 7%, and 71 ± 9% for TBABs A B, C, and D, respectively. It is speculated that the loss between influent and effluent carbon was produced as biomass within the TBABs. This was confirmed by the high VSS in the effluent, which was 33.3, 34.6, 22.9, and 23.6 mg L−1 for TBABs A, B, C, and D, respectively. A comparison of the loss in carbon to the biomass amount accumulated in the TBABs was computed in order to verify this hypothesis. In order to compute the amount of biomass recollected within the bed of the TBABs it was assumed that C9H15O5N and C5H7NO2 are typical representations of heterogeneous microorganisms running under acidic (i.e., TBABs A and B) and neutral conditions (i.e., TBABs C and D) (Rittmann and McCarty, Citation2001; Symons and McKinney, Citation1958). The daily nitrate consumption at all LRs was used as the basis of this calculation. The results of the t-test for each phase of the experiment were less than 0.01, which clearly indicates that the difference between the losses in carbon to the biomass retained within the TBABs was significant as indicated by p < 0.05.
Overall, the previous introduction of methanol in mixture with n-hexane at the startup phase was a very good means to enhance the bioavailability of n-hexane, as it facilitated the growth of active biomass necessary for the enhancement of the TBABs in n-hexane removal as well as in performance stabilization.
Kinetics of n-Hexane Removal in TBABs
The biodegradation removal kinetics for n-hexane were computed by taking gaseous samples from sampling ports located at 7.6, 23, 38, 53, and 60 cm measured from media top of the TBABs. In order to ensure uniformity of biomass along the TBABs, the samples were taken 1 day after applying biomass control. It was assumed that the TBABs can be modeled as a plug flow reactor (Zehraoui et al., Citation2012), and a pseudo first-order removal rate as a function of TBABs depth was considered to evaluate the reaction rate constants. The data were fitted with a linear model with the independent variable, time (sec), and the dependent variable, loge(C/C0), where C is the effluent concentration and C0 is the influent concentration. The kinetics reaction rate constants were obtained from the slopes of the regression lines.
represents the n-hexane first-order removal rate constant for different LRs. Notably, the TBABs A and B have higher reaction rate constants as compared to the TBABs C and D at each n-hexane influent concentration. This confirms the advantage of fungi utilization over bacteria. For instance, up to LR of 31 g m−3 hr−1, a 2.5-fold increase in reaction rate constants was obtained for n-hexane influent concentrations of 31 g m−3 hr−1. This is in conformity with the higher RE obtained for TBABs A and B as compared to the other TBABs. It is interesting to note that even with the increase of n-hexane LR, mainly from 31 and 41.5 g m−3 hr−1, the biodegradation kinetics were not greatly affected for TBABs C and D. However, for TBABs A and B, a shift from 31 to 41.5 g m−3 hr−1 caused a significant decrease in reaction rate constant. It is speculated that this decrease could be due to the high increase in LR by 11.5 g m−3 hr−1 (i.e., an increase of 100 ppmv), which affected microorganisms uptake of n-hexane. Yet when the increase in LR was around 6 g m−3 hr−1 (i.e., 50 ppmv), the uptake of n-hexane was not affected, as illustrated in . This is not uncommon for biofiltration systems where a swift change in VOCs LRs affects their performance. The reaction rate constant values for TBABs A and B ranged from 0.0152 to 0.0217 sec−1, while the maximum reaction rate constant for TBABs C and D were 0.0099 and 0.011 sec−1, respectively.
Figure 7. First-order removal rate constants for different n-hexane loading rates.
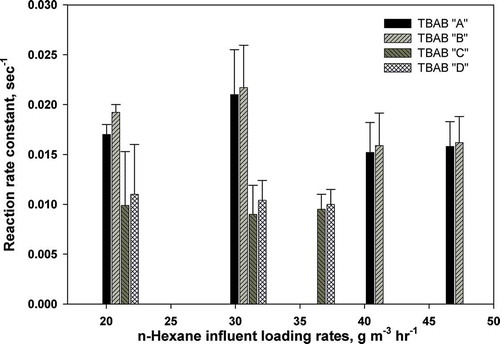
The reaction rate constants values obtained in this study are much higher than previously reported values. For instance, Aly Hassan and Sorial (Citation2010b) at an LR of 41.5 g m−3 hr−1 obtained a maximum value of 0.008 sec−1, while in this study 0.0158 sec−1 and 0.0162 sec−1 were obtained in TBABs A and B, respectively. This indicates that the bioavailability of n-hexane was higher in TBABs A and B than it was in the previous study. It seems that the acclimation period by alternating use of methanol with n-hexane at an earlier phase had provided an active biomass that elucidates the high n-hexane removal in TBABs (an average of 58 mg day−1 of VSS, compared to less than 30 mg day−1; Aly Hassan and Sorial, Citation2010b), as well as maintaining stable performances for TBABs A and B.
Microbial Analyses and TBABs Performances
Under acidic conditions, the analyses of bacterial and fungi communities at the start of this study indicated that the fungi community is the dominant species in TBABs A and B (Zehraoui et al., Citation2014). TBABs C and D, operating under pH 7, did not show any fungi community as indicated by the PCR analysis. Therefore, the interest is focused in characterizing the temporal and spatial variability for the fungi community in TBABs A and B.
summarizes the findings of the biological analysis at the start and at the end of the experiment. During the acclimation period, at n-hexane LR of 13.2 g m−3 hr−1 A. niger and F. solani were present at the top port of the TBABs and only F. solani was detected at the bottom part of the TBABs. With this distribution, the TBABs reached higher REs of 95% in n-hexane removal. As n-hexane LRs increased to 47.7 g m−3 hr−1 at the end of the experiment, both species were negatively regulated and new species were detected. Gibberella moniliformis (Fusarium verticillioides) was detected in both ports of TBABs. To the best of our knowledge, this is the first time that G. moniliformis has been reported for n-hexane biodegradation in TBAB. Gibberella moniliformis (F. verticillioides) is rarely reported for VOCs biodegradation except for a study where Paecilomyces lilacinus and Fusarium verticillioides removed t-butanol from contaminated air (Shevtsov et al., Citation2006).
Table 3. Fungi species present within TBAB A and B at the start and the end of the experiment
From it appears that the dominant populations detected at the initial period after the suspension of methanol were not dominant in the fungi community at the end of the experimental run. The explanation for this phenomenon could be due to the increase in n-hexane loads, which inhibited the activity of A. niger and F. solani. Another factor could be that G. moniliformis (F. verticillioides) was not effectively sustained at low n-hexane LRs as compared at the high loads. Borin et al. (Citation2006) revealed that a complex bacterial succession occurred in the reactor in response to the increasing concentrations of benzene. More time might be needed for the species to develop in using n-hexane as a sole source of carbon and energy, which was the case in this study. In other biofiltration systems using a specific inoculum, strength and persistence in community structure over time have been noticed, as well as change from the initial observed inoculum community structure. However, to build up a stable community, longer time was required, during which a changing community structure is observed (Sercu et al., Citation2007; Tresse et al., Citation2002). Another likely cause might be competitive exclusion among n-hexane degraders. Gibberella moniliformis (F. verticillioides) seems to be best adapted to metabolizing n-hexane at high LRs and to be dominant, as compared to A. niger and F. solani, under steady-state conditions until the end of the 190 days of experiments. The other important cause could be the detection methods sensibility, under the limit of detection, as has been reported (Babbitt et al., Citation2009). also suggested significant time-dependent changes in the detected microbial communities of the two TBABs.
Interestingly, although n-hexane concentration along the depth of the biofilters decreased, G. moniliformis (F. verticillioides) was present along all the biofilm media which enhanced n-hexane bioavailability and therefore its removal in both TBABs. Moreover, G. moniliformis (F. verticillioides) is the dominant strain in both TBABs A and B. Another very important observation is that the identified species require strong aerobic conditions, which confirm that TBABs A and B were not subject to substrates, nutrients, or oxygen limitation.
Conclusion
This study investigated the long-term degradation of n-hexane in trickle-bed air biofilters (TBABs) after an initial period of alternate addition of methanol. Targeting the change and variability of fungi community structure was another very important aspect explored. n-Hexane influent LRs were varied from 21.1 to 47.7 g m−3 hr−1 for TBABs receiving nutrient buffer at pH 4, while the LRs were between 21.1 to 36.3 g m−3 hr−1 for TBABs operating under pH 7.
The results obtained confirmed the superiority of fungi over bacteria for high biodegradation of n-hexane, as well as maintaining stable and consistent performance that was largely contested as a negative point for treating hydrophobic VOCs in TBABs. The change of the medium from bacteria to fungi by providing acidic nutrient buffers was revealed to be very effective in biofiltration of hydrophobic VOCs. TBABs fed with nutrient buffered at pH 4 showed a higher EC of 40.1 g m−3 hr−1 for n-hexane LR of 47.7 g m−3hr−1, while it did not exceed 23.4 g m−3 hr−1 for n-hexane LR of 36.3 g m−3 hr−1 for TBABs fed with neutral nutrient buffer.
The other crucial aspect revealed was that the fungi community detected during the initial run of both TBABs A and B, namely, A. niger and F. solani, were not detected at the end of the experiment, while G. moniliformis (F. verticillioides) became the dominant species present toward the end of the experimental run. This suggests that as VOCs LRs increase, microbial community might be changing under the gradient concentrations. On the other hand, to the best of our knowledge, this study is the first ever of its kind in which a thorough molecular analysis of microbial community treating n-hexane in TBABs was reported. Furthermore, this is the first time that G. moniliformis (F. verticillioides) was reported in the literature for biodegrading n-hexane.
It is worth noting that the operation of TBABs requires knowledge of the nature of VOCs employed and their LRs in order to achieve optimum performances coupled with the best choice of biomass control strategies.
Disclaimer
The finding and conclusions expressed in this publication are solely those of the authors and do not necessary reflect the views of the foundation.
Funding
The authors thank the National Science Foundation for financial support under award CBET 0852803.
Additional information
Notes on contributors
Abderrahman Zehraoui
Abderrahman Zehraoui is a Ph.D. graduate student and David Wendell is a professor in the Environmental Engineering Program, Department of Biomedical, Chemical, and Environmental Engineering, College of Engineering and Applied Science, University of Cincinnati, Cincinnati, OH.
David Wendell
Abderrahman Zehraoui is a Ph.D. graduate student and David Wendell is a professor in the Environmental Engineering Program, Department of Biomedical, Chemical, and Environmental Engineering, College of Engineering and Applied Science, University of Cincinnati, Cincinnati, OH.
George A. Sorial
George A. Sorial is a professor at the Environmental Engineering Program and Department Head, Department of Biomedical, Chemical, and Environmental Engineering, College of Engineering and Applied Science, University of Cincinnati, Cincinnati, OH.
References
- Aly Hassan, A., and G. Sorial. 2008. n-Hexane biodegradation in trickle bed air biofilters. Water Air Soil Pollut. Focus 8(3–4): 287–96. doi:10.1007/s11267-007-9149-3
- Aly Hassan, A., and G.A. Sorial. 2010a. Biofiltration of n-hexane in the presence of benzene vapors. J. Chem. Technol. Biotechnol. 85:371–77. doi:10.1002/jctb.2330
- Aly Hassan, A., and G.A. Sorial. 2010b. A comparative study for destruction of n-hexane in trickle bed air biofilters. J. Chem. Technol. Biotechnol. 162(1): 227–33. doi:10.1016/j.cej.2010.05.034
- Arriaga, S., and S. Revah. 2005a. Improving hexane removal by enhancing fungal development in a microbial consortium biofilter. Biotechnol. Bioeng. 90(1): 107–15. doi:10.1002/bit.20424
- Arriaga, S., and S. Revah. 2005b. Removal of n-hexane by Fusarium solani with a gas-phase biofilter. J. Ind. Microbiol. Biotechnol. 32(11): 548–553. doi:10.1007/s10295-005-0247-9
- Babbitt, C.W., A. Pacheco, and A.S. Lindner. 2009. Methanol removal efficiency and bacterial diversity of an activated carbon biofilter. Bioresour. Technol. 100(24): 6207–16. doi:10.1016/j.biortech.2009.06.110
- Borin, S., M. Marzorati, L. Brusetti, M. Zilli, H. Cherif, A. Hassen, A. Converti, C. Sorlini, and D. Daffonchio. 2006. Microbial succession in a compost-packed biofilter treating benzene-contaminated air. Biodegradation 17(2): 79–89. doi:10.1007/s10532-005-7565-5
- Cai, Z., D. Kim, and G.A. Sorial. 2005. Removal of methyl isobutyl ketone from contaminated air by trickle-bed air biofilter. J. Environ. Eng. 131(9): 1322–29. doi:10.1061/(ASCE)0733-9372(2005)131:9(1322)
- Cai, Z., D. Kim, G.A. Sorial, P. Saikaly, M.M. Zein, and D.B. Oerther. 2006. Performance and Microbial Diversity of a Trickle-Bed Air Biofilter under Interchanging Contaminants. Eng. Life Sci. 6(1): 37–42. doi:10.1002/elsc.200620111
- Deshusses, M.A., and H.H.J. Cox. 2000. Biotrickling filters for air pollution control. In The Encyclopedia of Environmental Microbiology, ed. G. Bitton, vol. 2, pp 782–795. New York, NY: Wiley.
- Eaton, A.D., L.S. Clesceri, E.W. Rice, A.E. Greenberg, and M.A.H. Franson. 2005. Standard Methods for Examination of Water & Wastewater, 21st ed. Washington, DC: American Public Health Association, American Water Works Association, Water Environment Federation.
- Estrada, J.M., N.J.R.B. Kraakman, R. Muñoz, and R. Lebrero. 2010. A comparative analysis of odour treatment technologies in wastewater treatment plants. Environ. Sci. Technol. 45(3): 1100–6. doi:10.1021/es103478j
- Fazaelipoor, M.H., S.A. Shojaosadati, and E.V. Farahani. 2006. Two liquid phase biofiltration for removal of n-hexane from polluted air. Environ. Eng. Sci. 23(6): 954–59. doi:10.1089/ees.2006.23.954
- García-Peña, I., I. Ortiz, S. Hernández, and S. Revah. 2008. Biofiltration of BTEX by the fungus Paecilomyces variotii. Int. Biodeter. Biodegr. 62(4): 442–47. doi:10.1016/j.ibiod.2008.03.012
- Hernández-Meléndez, O., E. Bárzana, S. Arriaga, M. Hernández-Luna, and S. Revah. 2008. Fungal removal of gaseous hexane in biofilters packed with poly(ethylene carbonate) pine sawdust or peat composites. Biotechnol. Bioeng. 100(5): 864–71. doi:10.1002/bit.21825
- Kim, D., Z. Cai, and G.A. Sorial. 2005a. Impact of interchanging VOCs on the performance of trickle bed air biofilter. Chem. Eng. J. 113(2–3): 153–60. doi:10.1016/j.cej.2005.04.004
- Kim, D., Z. Cai, and G.A. Sorial. 2005b. Behavior of trickle bed air biofilter for toluene removal: effect of non-use periods. Environ. Prog. 24(2): 155–61. doi:10.1002/ep.10079
- Kim, D., Z. Cai, and G.A. Sorial. 2005c. Evaluation of trickle-bed air biofilter performance under periodic stressed operating conditions as a function of styrene loading. J. Air Waste Manage. Assoc. 55(2): 200–9. doi:10.1080/10473289.2005.10464611
- Plaggemeier, T. 2000. Elimination der schwer wasserloslichen Modellabluftinhaltsstoffe n-Hexan und Toluol im Biorieselbettverfahren. Stuttgart, Germany: Universitaet Stuttgart.
- Prachuabmom, A., and N. Panich. 2010. Isolation and identification of xylene degrading microorganisms from biofilter. J. Appl. Sci. 10(7): 585–89. doi:10.3923/jas.2010.585.589
- Rene, E.R., M.C. Veiga, and C. Kennes. 2010. Biodegradation of gas-phase styrene using the fungus Sporothrix variecibatus: Impact of pollutant load and transient operation. Chemosphere 79(2): 221–27. doi:10.1016/j.chemosphere.2010.01.036
- Rittmann, B.E., and P.L. McCarty. 2001. Environmental Biotechnology: Principles and Applications, 128–29. New York, NY: McGraw-Hill.
- Sempere, F., C. Gabaldón, V. Martínez-Soria, J.M. Penya-roja, and F.J. Álvarez-Hornos. 2009. Evaluation of a combined activated carbon prefilter and biotrickling filter system treating variable ethanol and ethyl acetate gaseous emissions. Eng. Life Sci. 9(4): 317–23. doi:10.1002/elsc.200900011
- Sercu, B., N. Boon, S.V. Beken, W. Verstraete, and H. Van Langenhove. 2007. Performance and microbial analysis of defined and non-defined inocula for the removal of dimethyl sulfide in a biotrickling filter. Biotechnol. Bioeng. 96(4): 661–72. doi:10.1002/bit.21059
- Shevtsov, J., I. Eraso, and G. Stutte. 2006. Paecilomyces lilacinus and Fusarium verticillioides Remove t-Butanol from Contaminated Air. SAE Technical Paper 2006-01-2150. doi:10.4271/2006-01-2150
- Soeta, N., M. Terashima, M. Gotoh, S. Mori, K. Nishiyama, K. Ishioka, H. Kaneko, and T. Suzutani. 2009. An improved rapid quantitative detection and identification method for a wide range of fungi. J. Med. Microbiol. 58(8): 1037–44. doi:10.1099/jmm.0.006858-0
- Spigno, G., and D.M. De Faveri. 2005. Modeling of a vapor-phase fungi bioreactor for the abatement of hexane: Fluid dynamics and kinetic aspects. Biotechnol. Bioeng. 89(3): 319–28. doi:10.1002/bit.20336
- Spigno, G., C. Pagella, M. Daria Fumi, R. Molteni, and D. Marco De Faveri. 2003. VOCs removal from waste gases: Gas-phase bioreactor for the abatement of hexane by Aspergillus niger. Chem. Eng. Sci. 58(3–6): 739–46. doi:10.1016/s0009-2509(02)00603-6
- Symons, J.M., and R.E. McKinney. 1958. The biochemistry of nitrogen in the synthesis of activated sludge. Sewage Ind. Wastes 30(7): 874–90.
- Tresse, O., M.J. Lorrain, and D. Rho. 2002. Population dynamics of free-floating and attached bacteria in a styrene-degrading biotrickling filter analyzed by denaturing gradient gel electrophoresis. Appl. Microbiol. Biotechnol. 59(4–5): 585–90. doi:10.1007/s00253-002-1039-z
- U.S. Environmental Protection Agency. 1990. The Clean Air Act Amendments of 1990 List of Hazardous Air Pollutants. http://www.epa.gov/ttnatw01/orig189.html (accessed June 9, 2011).
- Van Groenestijn, J.W., and M.E. Lake. 1999. Elimination of alkanes from off-gases using biotrickling filters containing two liquid phases. Environ. Prog. 18(3): 151–55. doi:10.1002/(ISSN)1547-5921
- Van Groenestijn, J.W., W.N.M. Van Heiningen, and N.J.R. Kraakman. 2001. Biofilters based on the action of fungi. Water Sci. Technol. 44:227–32.
- Vigueras, G., S. Arriaga, K. Shirai, M. Morales, and S. Revah. 2009. Hydrophobic response of the fungus Rhinocladiella similis in the biofiltration with volatile organic compounds with different polarity. Biotechnol. Lett. 31(8): 1203–9. doi:10.1007/s10529-009-9987-3
- Woertz, J.R., and K.A. Kinney. 2004. Influence of sodium dodecyl sulfate and Tween 20 on fungal growth and toluene degradation in a vapor-phase bioreactor. J. Environ. Eng. 130(3): 292–99. doi:10.1061/(ASCE)0733-9372(2004)130:3(292)
- Yang, C., F. Chen, S. Luo, G. Xie, G. Zeng, and C. Fan. 2010. Effects of surfactants and salt on Henry’s constant of n-hexane. J. Hazard. Mater. 175(1–3): 187–92. doi:10.1016/j.jhazmat.2009.09.147
- Zehraoui, A., A.A. Hassan, and G.A. Sorial. 2012. Effect of methanol on the biofiltration of n-hexane. J. Hazard. Mater. 219–220(0): 176–182. doi:10.1016/j.jhazmat.2012.03.075
- Zehraoui, A., A.A. Hassan, and G.A. Sorial. 2013. Biological treatment of n-hexane and methanol in trickle bed air biofilters under acidic conditions. Biochem. Eng. J. 77:129–35. doi:10.1016/j.bej.2013.06.001
- Zehraoui, A., V. Kapoor, D. Wendell, and G.A. Sorial. 2014. Impact of alternate use of methanol on n-hexane biofiltration and microbial community structure diversity Biochem. Eng. J. 85: 110–18. doi:10.1016/j.bej.2014.02.009
- Zhu, X., M.T. Suidan, A. Pruden, C. Yang, C. Alonso, B.J. Kim, and B.R. Kim. 2004. Effect of substrate Henry’s constant on biofilter performance. J. Air Waste Manage. Assoc. 54(4): 409–18. doi:10.1080/10473289.2004.10470918