
Abstract
This study aims to develop an inexact two-stage optimization model to gather manure distributed over the southwest Taiwan and convert it into bioenergy. In the method, local optimization of each hauling zone is performed first using a gray mixed-integer programming model. Then, the hauling zones are prioritized by its performance on four gray scenarios. Although the biogas yield and the manure generation rate are ambiguous, one can easily evaluate his opportunity and risk by gray interval, which is a group of values within the lower and upper bounds. The analyses reveal that the biogas yield dominates the profit in this project, and it leads to the failure of the project when the biogas yield is below the level of 0.2 m3 kg−1. With the goal of reducing 45% of methane emissions from pig farms, seven hauling zones are required to be developed. The farmers living in these zones from the project get carbon credits ranging from 478 to 3269 ton CO2eq per year, and the investors own the carbon credits in the range of 3264–11820 ton CO2eq per year. Through the carbon trading, both the investors and pig farmers are able to make profits by trading their carbon credits.
Implications:
Biogas recovered from hoggery can be used as a bioenergy source and mitigate the atmospheric greenhouse effect and global warming. This research develops an inexact two-stage optimization model to evaluate the potential of gathering manure for biogas and converting it into bioenergy. The analyses reveal that the biogas yield dominates the profit in this project, and it leads to the failure of the project when the biogas yield is below the level of 0.2 m3 kg−1. This study has provided a useful reference for the management of biogas production and carbon trading from hoggery for bioenergy.
Introduction
Methane is one of the important greenhouse gases (GHGs) (Chen, Citation2002, Citation2006), and it is the prime component in biogas. On account of increasing population and consuming more meat worldwide, GHG emissions from farms have become one of the main sources causing global warming (Budzianowski, Citation2011, Citation2012; Chen and Lu, Citation2003). For example, in the report “Livestock’s Long Shadow” of the United Nations (UN) in 2006 (Steinfeld et al., Citation2006), it was outlined that 18% of greenhouse gases came from cow, sheep, pig, and other livestock. The Worldwatch Institute in 2009 went step further to report that the emitted CO2eq volume of livestock was more than 51% of the world’s total GHG emissions. For this reason, reducing meat consumption seems to be a feasible countermeasure to lessen GHG emissions from livestock. But any suggestions to consume less meat would run into resistance from livestock industry. Like many other countries, the pig industry strongly contributes to the economy of rural area in Taiwan. However, the development of pig industry herein is still an issue in controversy. The electricity-from-manure project in Sterksel, a village in southern Netherlands, gives us a different vision on the development of livestock industry. In the project, the reduction of methane emissions via developing bioenergy from pig manure let farmers get a substantial payback by selling carbon credits and electricity as well as getting free fertilizer in European markets (Rosenthal, Citation2008). In fact, the potential of economic benefits from commercial biomass, such as employment/earnings, regional economic gain, and contribution to security of energy supply, are catching the attention of more and more policy makers (Domac et al., Citation2005).
Conventionally, farmers produce fertilizers from untreated manure on nearby lands. But such a route of manure management results in biogas (or methane) emissions and eutrophication of water bodies (Fujino et al., Citation2005; Gerber et al., Citation2005). Since the mid-1990s, while intensive livestock farming was practiced, its environmental impacts, such as water pollution from nitrate emissions, air pollution from ammonia emissions, soil pollution from excreta and heavy metal emissions, and greenhouse gas emissions, have become a serious problem (Martinez et al., Citation2009). With the growing concern of environmental protection, the treatment of pig manure will face not only more stringent regulation but also higher cost for disposal in the future. In some regions, for example, in The Netherlands, the high pig concentration and limited availability of arable land have led to a surplus of manure, which results in high off-farm manure disposal costs (Melse and Versoes, Citation2005). In order to facilitate adopting superior environmental technologies in pig farm, using the credits of GHG reduction to compensate for higher installation cost of manure waste treatment system is receiving a great deal of attention (Vanotti et al., Citation2008).
Unlike other industries that are facing enormous political and regulatory pressure to get greener, the pig industry in Taiwan just commences to come under scrutiny. Even though farms are equipped with good wastewater treatment plants, biogas (or methane) generated from anaerobic process is not well reused, and most of the biogas is emitted into the air. Nowadays pig farmers can play a significant role in promoting environmental sustainability by generating their own bioenergy and reducing GHG emissions. The Environmental Protection Agency (EPA) of Taiwan is promoting “clean pig farm” and has assisted pig farmers to build 100 pig farms with the demonstration of pigsty with “pig toilet.” With this design, pig manure can be collected easily. If all pig farms are equipped with pig toilet, the wastewater from the farms can be cut down over 50% (Mepo Forum, Citation2010), and the collected pig manure can be converted into biogas and bioenergy.
Taiwan depends highly on energy import. Over 98% of natural gas was supplied from other countries, and around 79% of which was consumed for power generation in 2011. In addition to energy security, increasing concerns of GHG reduction and carbon footprint have called for the development of alternative fuels, such as biogas converted from local biomass resources. The total number of pigs in Taiwan was around 6,265,550 in 2011, and most of them were concentrated at southwest Taiwan. By virtue of high density of pig farms, Taiwan has a high potential to produce biogas from pig manure. However, most of the pig farms are too small to have profit by directly using biogas on the farms. A large and centralized biogas plant can get a higher yield of biogas and a better profit than a small one. Accordingly, an efficient hauling system is crucial to gather manures distributed over small pig farms into the nearest biogas plant. Before building this hauling system, both investors and farmers require a decision tool to evaluate how much profits can be obtained from using pig manure as an energy source.
According to the study of Ramachandra et al. (Citation2000), the dung yield of pigs was approximately 2.5 kg head−1 day−1 and the gas yield per pig dung was about 0.062 m3 day−1 head−1. Batzias et al. (Citation2005) reported that the dry solid of pig manure was 0.216 t head−1 yr−1 and the biogas yield was 649 m3 dry solids t−1. From the estimations of Vanotti et al. (Citation2008), the methane production capacity from pig manure and the volatile solid excrete produced by pig were 0.45 m3 kg−1 and as 0.5 kg day−1 head−1, respectively. The data of Sajjakulnukit et al (Citation2005) suggested that the generation rate of pig’s fresh waste was 2 kg head−1 day−1, the volatile solids in manure was 24.84 wt%, and the biogas yield of manure was 0.217 m3 kg−1 (as shown in ). From the aforementioned studies, both the biogas yield and generation rate of manure are fairly uncertain, and the ambiguous information from them will cause a risk of investment in developing bioenergy from pig manure.
Table 1. Biogas yield and manure generation rate
The uncertainty of waste generation forecast is a crucial factor in planning and optimizing the facility of material recovery. Such an uncertainty will affect the optimization processes and generate wrong decision schemes. Davila and Chang (Citation2005) used interval values in a gray integer programming model to enrich the capacity planning choices of material recovery facility in a solid waste management system in San Antonio, a city in South Texas. In the planning of energy system management and GHG emission control of Beijing and Waterloo, Lin and Huang (2009) utilized a dynamic inexact stochastic energy system planning model to identify the complexities of multiuncertainty, dynamic, and interactive municipal energy management systems. Their model integrated mixed-integer, interval-parameter, and two-stage stochastic programming techniques.
The prime purpose of the optimization model is to get the maximum yield along with the minimum cost or investment. Currently, the reduction of GHG emissions in Taiwan is of the utmost importance. It has been illustrated earlier that biogas recovery from pig manure simultaneously possesses the merits of producing bioenergy and reducing GHG emissions. For these reasons, the present study aims to develop an inexact two-stage optimization model to gather manure distributed over the southwest Taiwan and convert it into bioenergy. The results suggest that the development of seven hauling zones can fulfill the goal of 45% reduction in GHG emissions. Consequently, the developed optimization model is able to provide a useful reference for policy makers to identify the location that is suitable for becoming the local bioenergy factories from pig manure. Details of the developed optimization model and important findings will be illustrated.
Conceptual Analysis of Carbon Credits
Theoretically, carbon markets are able to provide a win-win opportunity for buyers and sellers of carbon credits. Carbon payments can contribute to incomes to rural areas and promote productivity (Perez et al., Citation2007). The emission trading, in which buyers can purchase carbon credits derived from renewable energy to offset GHG emissions due to their activities, has evolved to be a promising way to pursue the goal of GHG reduction. Bird et al. (Citation2008) estimated that renewable energy markets were likely to benefit from carbon cap-and-trade programs because the compliance with the cap would increase the cost of fossil fuel and motivate the capped industries to use renewable energy for meeting the load growth in the future. According to the estimation by the World Bank, the carbon trading amount in 2009 has risen to 136 billion USD level.
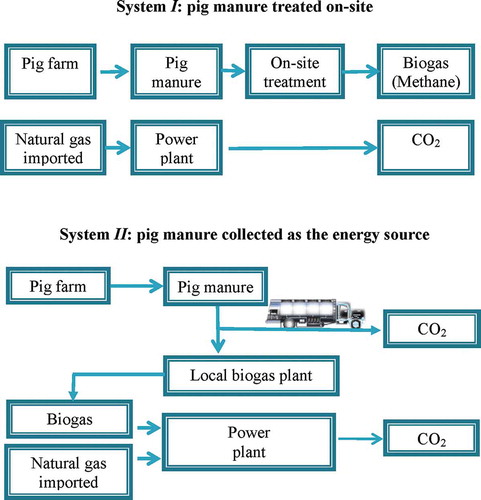
After Tokyo launching the Asia’s first carbon trade scheme, Taiwan also announced its attempt of carbon trading. This study tries to figure out the carbon credits of investors and pig farmers in the proposed energy system. Two different systems are evaluated, as shown in , in which no reuse of pig manure and reuse of pig manure are individually taken into account. System I treats pig manure on farms so that biogas is released into the air. The power generated in System I depends completely on the imported natural gas. System II deals with pig manure as the stuff of local biogas plants. The biogas plants supply biogas to the power plants for power generation to replace imported natural gas. The Intergovernmental Panel on Climate Change (IPCC) (Citation2008) suggested that the emission factor of nature gas was 56,100 kg CO2 TJ−1 and the emission factor of biogas produced by sludge was 54,600 kg CO2 TJ−1. This study assumes that the heating values of biogas and natural gas are the same at 5800 kcal m−3 (or 2.43 × 10⁻⁵ TJ m−3), and the power generation will reduce 0.036 kg CO2 emissions from using 1 m3 biogas to replace natural gas. The investors can not only get the profits from selling electricity but also own the carbon credits of GHG reduction. System II also depicted CO2 emissions from trucks during hauling process. The investors should be responsible to GHG emissions from their service and only keep the net carbon credits being offset by their duty. Moreover, pig farmers offer their pig manure to biogas plants so as to prevent biogas emitted into the atmosphere. When methane reduced by pig farmers is more than their duty, this difference is considered as the carbon credits of farmers. All pig farmers in this project can share the income of selling carbon credits.
Figure 1. Schematics of pig manure treatment and GHG emissions of two different energy systems.
Methodology
Hauling situation
Commercially, the bioenergy system involves a number of different market segments, supply chains, and actors (Elghali et al., Citation2007). When pig manure is converted into bioenergy, it is related to a variety of interrelated energy-related activities, and the interaction is associated with a number of socioeconomic, technological, and environmental factors. First of all, collecting pig manure in a minimum distance is essential for hauling service in that the fuel cost and GHG emissions in the service can be minimized. For the sake of scale efficiency, the amount of pig manure is counted in terms of townships rather than individual farms.
In addition to economic and technical supports, a well-operating bioenergy system requires an efficient cooperation among local farms for providing raw materials (Batzias et al., Citation2005). Investors have to offer contracts and enough hauling trunks to all farmers in alliance for picking up all pig manure. The duty of the farmers is to hand over all their pig wastes. In contrast, farmers out of the alliance have to treat pig wastes by themselves. Normally, the neighbors of pig farms will support this plan due to the improved environmental quality by hauling away pig manure. But the residents along the hauling routes might oppose it because of the concerns of odor, leakage, and traffic jam. For this reason, the optimization model should have a rule of to avoid hauling trunks passing through the townships out of the alliance.
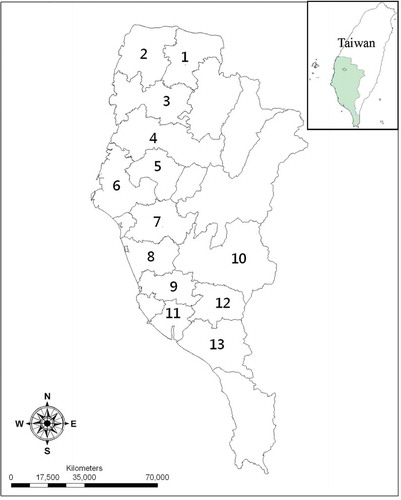
Based on Danish and UK experiences with transporting farm livestock manure to biogas plants, Dagnall et al. (Citation2000) suggested that the high-dry-matter feedstock (moisture content <10%) could be transported from within a 40 km radius of the site, and the low-dry-matter feedstock (moisture content around 70%) could be transported from within a 10 km radius of the site. The hauling service of pig manure with long distance is not feasible from the economic point of view. Meanwhile, the strategy of collecting pig manure form pig farms should be supported by farmers. From the perspective of disease control, the operation of energy system should avoid spreading pig flu. So partitioning pig farms into several hauling zones is better than centralizing them into a big zone. Accordingly, 109 townships with pig farming activity in southwest Taiwan are clustered into 13 hauling zones in accordance with the Euclidean distance (Yeh et al., Citation2011). demonstrates the positions of hauling zones located in southwest Taiwan. Each hauling zone in the figure was bounded under the limit of radius below 10 km. With the consideration of the responsibility of administration, each hauling zone was composed of 3–4 areas charged by the same authority. In this study, each hauling zone is endowed with its own gray mixed-integer programming model. The investors can identify the best plan to build up the local biogas plants, set up the transportation stops, draw up each hauling route, and to send out the manpower and trunks for each hauling zone.
Figure 2. The schematic of clustering 13 hauling zones with pig farming activity in southwest Taiwan.
Modeling
Chen et al. (Citation2011) have developed a mixed-integer optimization model for collecting pig manure into biogas plants, in which the routes were composed of express lines and circuit lines. As pointed out earlier (Ramachandra et al., Citation2000; Batzias et al., Citation2005; Sajjakulnukit et al., Citation2005; Vanotti et al., Citation2008), the uncertainties on biogas yield and manure generation rate exist in the bioenergy system of pig manure. This ambiguous information will induce risks in developing the bioenergy system and trading carbon credits. In order to diminish the risks, this work upgrades the previous model by adding two gray parameters. According to the studies of Karmakar and Mujumdar (Citation2006), Lin et al. (Citation2009), and Cai et al. (Citation2009), the upgraded model has changed its attribute from deterministic into inexact by considering some parameters as gray interval instead of deterministic real numbers. The gray interval is an inexact continuous variable that is a value within the lower and upper bounds, as expressed as the following:
The system analysis also needs the information of profit of power generation, the profit of carbon trading, the fuel cost, the manpower cost, the material cost, and the values of operating parameters. In this model, the net profit will be discounted to the present value of the modeling period (n = 8 yr and discount rate = 5%). Maintaining such a bioenergy system needs to pay for the fuel, salary of manpower, and charge for swine manure annually. Two workers are assumed to handle a hauling service. The selling price of pig manure (MSP) is defined as 1000 NTD ton−1 (1 USD = 30 NTD, 2013/12). The energy profit comes from the income of selling electricity that is generated by gas turbines through burning biogas. The composition of methane in biogas is between 55 and 70 vol%; certain amount of carbon dioxide as well as small amounts of hydrogen sulfide and other trace gases are also contained in biogas (Nelson and Lamb, Citation2002). After the removal of carbon dioxide, the biogas becomes a homogeneous fuel containing up to 80 vol% of methane, with the calorific value of over 25 MJ m−3 (Mihic, Citation2004). In this model, the higher heating value of biogas (GHV) is postulated to be 5000 kcal m−3. According to the report of EURELECTRIC–Union of the Electricity Industry (Honorio, Citation2003), the efficiency of electricity generation from biomass and biogas is 30–40%. Hence, this model assumes that the conversion of electricity from thermal energy is at a constant ratio of (CR) 3.5 × 10⁻⁴ kWhr kcal−1. Currently, the selling price of electricity generated by renewable energy (ESP) is at 2.5 NTD kWhr−1. The township index () is a binary variable that represents the ith township of the zth hauling zone in or out of energy system. When
is 1, all pig manure produced in the ith township will be hauled to the centralized biogas plant located at the zth hauling zone. Alternatively, the pig manure will be dropped on farms when
is 0. HEADzi is the number of pigs in the ith township of the zth hauling zone.
Carbon trading is another income in this system. If no pig manure is reused, biogas or methane on farms will be liberated into the air. The reduction of methane emissions (GHG is denoted as CO2eq) by developing bioenergy from pig manure must be offset by carbon dioxide emissions during the hauling processes. The net amount of GHG reduction can be sold at carbon markets, trading as CO2eq. It is presumed that biogas (GD) is methane with the density of 0.717 kg m−3, the emission rate of carbon dioxide during the hauling process (ECR) is 0.924 kg km−1, and the carbon trading price (CTP) is 0.128 NTD kg−1.
The total system cost is related to annual operating cost and four fixed costs. The latter are made up of the land cost for building biogas plant and storage, the construction cost of biogas plant, the vehicle cost for conveying pig manure, and the machine cost for power generation. The gas turbine cost is expressed as a regression function of gas turbine power scale (kw) and expense (NTD) by the database posted on the Web sites of Utility Warehouse (http://www.utilitywarehouse.com/), Generatormart (http://www.generatormart.com/), and Nye Thermodynamic Corporation (http://www.gas-turbines.com/).
The objective function of benefit maximization is formulated for calculating the discounted cash flow of all quantifiable system benefits and costs over time. The objective function represents the net capital by combining the present value converted from the annual profits and the initial funds. The annual profit is obtained by the incomes of carbon trade and selling electricity, but is reduced by the expenses of the payments for fuels, workers, and manure. The initial funds are the money for buying lands, construction, buying trucks, and buying power generators during building up a bioenergy system. This project calculates the cash flow of investment on developing bioenergy of manure with a cycle of 8 yr. The project seeks the optimal way of methane emission control from hoggery under the maximum situation of profit from developing bioenergy.
where A and B in the above equation are 5977 and 100,904,281, respectively (Chen et al., Citation2011).
There are six constrains in the optimization model, consisting of the hauling distance, routing balance, demand, capacity, bypass, and speed constraints. They are written as follows.Hauling distance constraint:
Bypass constraint:
The hauling distance constraint means that the sum of hauling distances by express lines and circuit lines at each hauling zone must fit the requirement of hauling service per day. The routing balance constraint checks whether the times of passing any township comply with the balance of trucks moving in and out. The demand constraint asks investors to offer enough hauling capacity to clean up all pig manure produced at the farms in alliance. The minimum circuit routing constraint limits the choice of hauling manure by circuit way to the areas where a truck is not able to be loaded full. The hauling service by express is arranged when a truck is able to be loaded full. The trucks on duty of expressway stop only at biogas plant and one serving point. When trucks are filled up, they must stop the hauling service and go back to its nearest biogas plant to dump manure. The reducing routing distance is also a way of saving the fee of transportation and reducing GHG emissions. For disease control, the bypass constraint is added in this model. A red line is set to bypass the area where farmers do not join the service. The last constraint, namely, the speed constraint, defines that the maximum routing time (RTIME) for each truck is 4 hr per day and the maximum speed of truck is 60 km hr−1. There are seven integer decision variables, including the number of hauling trucks (CARsz), the routing time of expressway (DSzi), the routing time of circuit way (RSzmi or RSzin), the routing time of circuit way ended at the ith township (RSEzi), the routing time of circuit way started at the ith township (RSSzi), and the township index ().
Two-stage optimization
While dealing with water resource management in the Kaidu-Konqi watershed in northwest China, Huang et al. (Citation2012) used a two-stage stochastic programming to identify desired water allocation plans with a maximum economic benefit and a minimum risk of system disruption under uncertainty. The fundamental idea behind the two-stage programming is the concept of recourse, which defines the ability to take corrective actions after a random event having taken place (Li et al., Citation2007). This study deals with the uncertainties of coming from biogas yield (PGR) and manure generation rate (PDV). and
are two inexact continuous variables that are the random values within the lower and the upper bounds, respectively. Based on 2k factorial design, this study assigns two levels of high and low to these two variables. Due to linear characteristic, the extreme situation of the optimization model will take place at four gray scenarios composed of two-level biogas yields and two-level manure generation rates.
Basically, environmental management is a territorial administration. Therefore, managers should solve the environmental problems locally and not cover different administrative districts, especially in the treatment of solid wastes. For this reason, a two-stage optimization model is developed to ascertain the proposal working well in practice. In the first stage, the study area is divided into several hauling zones in accordance with their administrative attributions, and the optimization of hauling plan is determined to collect manure at a minimum distance in each hauling zone. In the second stage, a priority in the development of bioenergy is made, based on the profit of selling electricity and the reduction of GHG emissions. Finally, the hauling zones, which should be selected into the plan of developing bioenergy according to the different targets of GHG reduction, are identified.
The four scenarios based on gray feature of two decision variables display the uncertainty of this project. This makes the optimistic and pessimistic outcomes of developing bioenergy clear. The procedures are described as follows.
| Stage I: | = | Local optimization of methane emission control in pig farms at each hauling zone |
| Step 1. | = | The area with pig farms was divided into 13 hauling zones. |
| Step 2. | = | 13 gray mixed-integer programming models of hauling zones were formulated. |
| Step 3. | = | The optimal solutions at the four gray scenarios were solved. |
| Step 4. | = | The gray interval of benefit by selling electricity at each hauling zone was obtained. |
| Stage II: | = | Global optimization of methane emission control in the pig industry of Taiwan |
| Step 5. | = | Financial sustainability was the first criterion when the way of methane emission control from hoggery was evaluated. Accordingly, the present values of net profit from the hauling zones were ranked. The total income subtracted by the total expense was the net profit. |
| Step 6. | = | When the difference in profit between different hauling zones was not pronounced, the comparison of hauling distance was taken into account. The long hauling distance means the increase in GHG emission and risk in environmental pollution during collecting manure. |
| Step 7. | = | When some neighbor areas were selected into the development, a hauling cluster in the map was formed. The developers should minimize the number of hauling clusters to avoid the spread of swine flu. |
| Step 8. | = | According to the above criteria, the optimal strategy for meeting the duty of methane emission control by pig industry was determined. |
Results and Discussion
There are more than 6 million pigs in Taiwan in 2011. Most of the pigs (over 70%) and pig farms are located in southern Taiwan where the pig density is 411 heads km−2. In view of the characteristics of crowded pigs and high density of pig farms in southern Taiwan, it is desirable to propose a project to gather pig manure distributed over southern Taiwan and convert it into bioenergy. Meanwhile, the reduction extent of GHG emissions is evaluated in the project. From the viewpoints of economic concern and epidemic prevention, 109 townships with pig farming activity in southwest Taiwan are clustered into 13 hauling zones. Each hauling zone is endowed with its own gray mixed-integer programming model to evaluate its local optimization for developing bioenergy from pig manure. is a list of biogas yield and manure generation rate from four references. The data include the pairs of biogas yield () and the manure generation rate (
) (0.649 m3 kg-manure−1, 0.592 kg head−1 day−1) from Batzias et al. (Citation2005), (0.45 m3 kg-manure−1, 0.5 kg head−1 day−1) from Vanotti et al. (Citation2008), (0.062 m3 kg-manure−1, 2.5 kg head−1 day−1) from Ramachandra et al. (Citation2000), and (0.217 kg-manure−1, 2 kg head−1 day−1) from Sajjakulnukit et al. (Citation2005). Seeing that the value of
is between 0.062 (
) and 0.649 (
) m3 kg−1, and the value of
is between 0.5 (
) and 2.5 (
) kg pig−1 day−1, four gray scenarios from the combinations of
and
are denoted by A, B, C, and D and they are shown in . Using the optimal engine of LINGO (Lindo Systems Inc., Chicago, IL, USA), the results of optimization for each hauling zone are displayed in . It can be seen that Scenarios C (PGR− and PDV−) and D (PGR− and PDV+) can’t get feasible solutions. After undergoing a trial-and-error procedure, raising the value of PGR− and lowering the value of PDV+ can obtain feasible solutions. Scenarios C and D are thus revised and the two modified scenarios are shown in where they are renamed as C’ and D’, respectively. displays the results of optimization for each hauling zone in the modified scenarios.
Table 2. Biogas yield and manure generation rate at four gray scenarios
Table 3. Biogas yield and manure generation rate at four revised scenarios
Table 4. The results of optimization for each hauling at four gray scenarios
Table 5. The results of optimization for each hauling at four revised scenarios
The biogas yield (PGR) is a critical parameter to the profit in this project. PGR− means the lower bound of biogas yield. When it is increased to 0.2 m3 kg−1, the optimal solution is available for Scenario C’; this implies that this project in the absence of high biogas yield does not deserve investment. In other words, the utilization of pig manure depends on the mature technique of biogas yield and well operation of biogas plant. The supply of manure is another critical parameter in this project. PDV+ stands for the upper bound of manure generation rate. A high manure generation rate will increase the number of hauling service; it also increases fuel cost and causes higher GHG emissions. As the number of hauling services increases, investors are more concerned with the hauling distance. So the areas with higher density of pigs get the higher priority of bioenergy development because of easier supply of biomass.
At present, the three criteria of high profit, short hauling distance, and less number of clusters are taken into account to determine the priority of development. displays the gray intervals of profit by developing biomass energy from pig manure in the 13 hauling zones according to the data obtained in . Meanwhile, demonstrates the gray intervals of hauling distance in the 13 hauling zone. Among the 13 zones, depicts that Zone 2 has the highest profit from selling electricity and carbon trading, regardless of the lower or upper bound considered. Zone 2 is thus chosen as the first priority. Subsequently, from the three set criteria, Zone 1 and Zone 12 are the second and third priorities, respectively. The net GHG reduction is more reachable if the hauling distance is shorter. Because Zone 11 has a higher profit and the shortest hauling distance (), it is selected as the fourth priority. Zone 4 and Zone 10 also have higher profits, but they also have larger hauling distances. Their priorities are thus adjusted downward. Instead, Zone 8 becomes the fifth priority. Once Zone 8 is selected, the areas under methane emission control can be grouped in three clusters. It is assumed that the less clusters of hauling zones are able to reduce the risk of disease spread (e.g., swine flu). This assumption makes Zone 7 and Zone 13 have higher priorities than Zone 5. Finally, Zone 6, Zone 9, and Zone 3 are the last three priorities because of their lower profits and longer hauling distances. Accordingly, the priority sequence of developing hauling zones is Zone 2, Zone 1, Zone 12, Zone 11, Zone 8, Zone 7, Zone 13, Zone 5, Zone 4, Zone 10, Zone 6, Zone 9, and Zone 3.
Figure 3. Profiles of gray interval of profit by selling electricity from biogas at various hauling zones.
Figure 4. Profiles of gray interval of hauling distance at various hauling zones.
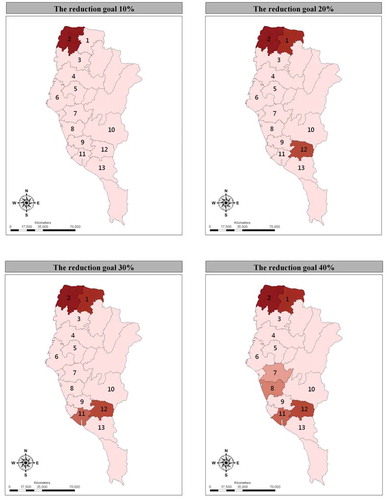
Methane emissions in the course of manure management are uncertain. According to the IPCC 2006 guidelines for national greenhouse gas inventories, the emission factor of pig manure in liquid process at 26 °C was between 6 and 41 kg CH4 head−1 yr−1. shows the carbon credits for farmers and investors who join this project. Corresponding to the goals of 10%, 20%, 30%, 40%, and 45% reduction of GHG emissions, hauling zones 1, 2, 4, 6, and 7 are required to be developed. and
are the random values within the lower and the upper bounds. Thus, carbon credits and profits of selling electricity, which are calculated based on these uncertain factors, are also inexact and written as gray intervals. The number of pigs is restrained from methane emissions for the duty of pig industry at various goals of GHG reduction. When the number of pigs under methane emission control is more than the number of pigs that are restrained from methane emissions for the duty of pig industry claimed by government, the extra count of pigs will become the carbon credits for farmers in this project. All pig farmers in this project can share the income of selling the carbon credits. This income is able to encourage the pig farmers to treat pig wastes and maintain their facilities carefully. For carbon credits of investors in this project, it has been known that using biogas to generate electricity will reduce 0.036 kg CO2 emissions per m3 biogas. Under the uncertain biogas yield and manure generation rate, the carbon credits are estimated in terms of gray intervals, as shown in . These carbon credits belong to the investors who develop bioenergy from pig manure. shows the strategies of zone selection for getting the goals of 10%, 20%, 30%, and 40% reduction of GHG emissions. With the goal of 10% reduction, the pig industry has to cease the disposal of 641,890 pig manure on site. To achieve the goal, Zone 2 developed alone is sufficient in that 1,012,972 pigs are fed in this zone. Developing Zone 2 not only meets the duty of 10% off but also creates [50,491, 345,022] tons of gray carbon credits for farmers and [4204, 1216] tons of gray carbon credits for investors. To meet the goal of 20% reduction, Zone 1, Zone 2, and Zone 12 have to be developed where two clusters form. Developing Zone 11 is also required if 30% of GHG reduction is to be achieved. With regard to 40% reduction, two more hauling zone, namely, Zone 7 and Zone 8, have to be developed where three clusters are exhibited. The investors will gain more carbon credits by increasing the utilization of biogas. However, the farmers have to meet their own duty of GHG reduction and then check how many carbon credits remain. Maybe some farmers argue why they take all the duty of pig industry. Even so, it is believed that the motivation is strong enough to encourage them to join this project. In practice, when the farmers hand over the pig wastes to this project, they have saved a lot of budgets on waste treatment.
Table 6. Carbon credits for farmers and investors at various goals of GHG reduction
Figure 5. Strategies of achieving the goals of 10%, 20%, 30%, and 40% reduction of GHG emissions.
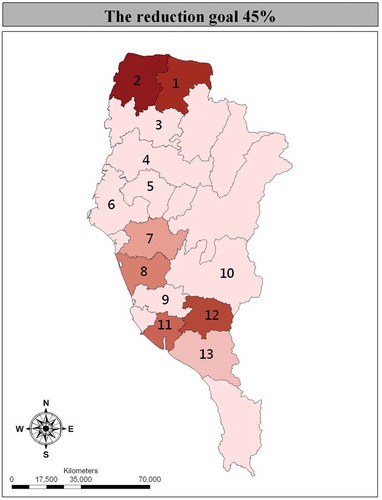
Taiwan government announced that GHG emissions will be reduced to the level of 2005 in 2020. Eventually, the GHG emissions will be back to the level of 2000 in 2025. So Taiwan needs to cut GHG emissions from 467 million tons to 257 million tons; that is, the amount of GHG emissions should be reduced to the level of 45%. shows that the development of seven hauling zones, 1, 2, 7, 8, 11, 12, and 13, is able to reach the goal of 45% reduction in GHG emissions. The farmers in these zones have the carbon credits of [478, 3269] ton CO2eq per year. Alternatively, the investors can obtain the carbon credits of [3264, 11,820] ton CO2eq per year. In addition, they can get the profits of 646 million and 2138 million NTD per year from selling electricity.
Figure 6. Seven zones developed for achieving the goal of 45% reduction of GHG emissions.
Through carbon trading, all participants including farmers and investors have the opportunity to increase their income. That is a win-win situation proposed in this project.
Conclusion
Most of the pig farms in Taiwan are too small to get profits by directly using biogas on the farms. An exact two-stage optimization model is thus developed in the present study to evaluate the reduction strategy of GHG emissions from pig industry in southern Taiwan. The two-stage optimization model includes the local optimization of hauling zones and the priority determination of the developed hauling zones based on four gray scenarios. The analyses suggest that the biogas yield is a critical parameter to the profits of this project. The optimum solution is available only when the biogas yield is as high as 2 m3 kg−1, implying that this project without high biogas yield will fail. Accordingly, the development of bioenergy from pig manure must be based on a mature technique of biogas yield and a well-operated biogas plant. Although biogas yield and manure generation rate are ambiguous, the gray intervals enable us to judge the performance of developed bioenergy of pig manure. To reach the goal of GHG reduction, the areas with high profits, short hauling distances, and less clusters of hauling zones are favored. With the goal of 45% reduction of GHG emissions, seven hauling zones in southern Taiwan are suggested to be developed. The analyses indicate that the investors in this renewable energy system can gain the carbon credits within 3264 and 11,820 ton CO2eq per year. The pig farmers joining this project can share carbon credits ranging from 478 to 3269 ton CO2eq per year. All participants in this project can make profits from trading their carbon credits. This win-win situation will make the project of GHG reduction sustainable.
Finally, it should be illustrated that carbon-rich pig manure can be used to increase C/N content in soils. However, Taiwan lacks energy resources and relies highly on import, and much carbon dioxide is emitted. Therefore, this study gives priority to consider biogas recovery for developing fuel and reducing greenhouse gas emissions. On the other hand, in our test, it was found that after biogas production from manure digestion, the carbon content in the residue is still high. Accordingly, pig manure can be digested first to produce biogas; then the residue is used to increase C/N content in soils.
Nomenclature
| A | = | a constant value (= 5977) |
| AIR | = | discount rate (= 5 %) |
| = | choice of collecting pig manure at the ith township of the zth hauling zone (-) | |
| B | = | a constant value (= 100904281) |
| CARsz | = | number of hauling trucks at the zth hauling zone (—) |
| CARPRICE | = | price of hauling trucks (NTD per truck, USD = 30 NTD) |
| CPRICE | = | the construction expense (NTD m−3) |
| CR | = | efficiency of converting thermal energy into electricity (= 3.5 × 10⁻⁴ kWhr kcal−1) |
| CTP | = | carbon trading price (= 0.128 NTD kg−1) |
| DAYs | = | operational days during 1 yr (day) |
| DDISTzi | = | distance between the ith township and the biogas plant of the zth hauling zone (km) |
| DSzi | = | routing time of expressway designated to the ith township at the zth hauling zone |
| ECR | = | emission of carbon dioxide during the hauling process (= 0.924 kg km−1) |
| EHQi | = | hauling quantity at the ith township when it is the end point of circuit way (kg) |
| ESP | = | selling price of electricity generated by renewable energy (= 2.5 NTD kWhr−1) |
| FCR | = | fuel consumption rate (= 0.2 L km−1) |
| FHQ | = | full hauling quantity for each truck (= 15,000 kg) |
| FP | = | fuel price (= 32 NTD L−1) |
| GD | = | density of biogas as methane (= 0.717 kg m−3) |
| GHV | = | heating value of biogas (= 5000 kcal m−3) |
| GWP | = | global warming potential of methane (= 23 CO2eq) |
| HEADzi | = | pigs fed in the ith township of the zth hauling zone (pig) |
| HRT | = | retention time of anaerobic digestion of pig manure (day) |
| LKz | = | total hauling distance at the zth hauling zone per day (km day−1) |
| LPRICE | = | land price (= 4000 NTD m−2) |
| M | = | a constant value (= 10,000) |
| MARz | = | accumulating rate of pig manure at the zth hauling zone (t day−1) |
| Mh | = | manpower to serve hauling job per trucks (= 2 man) |
| MSP | = | selling price of pig manure (= 1000 NTD t−1) |
| N | = | the modeling period (= 8 yr) |
| OHT | = | operational time for generating electricity per day (= 8 hr) |
| PDAVE | = | average depth of anaerobic digestion process (= 5 m) |
| PDV | = | manure generation rate per pig (kg pig−1 day−1), PDV+ (= 2.5 kg pig−1 day−1) and PDV−- (= 0.5 kg pig−1 day−1) |
| PGR | = | biogas yield (m3 kg−1 manure), PGR + (= 0.649 m3 kg−1) and PGR− (= 0.062 m3 kg−1) |
| RDISTzin | = | distance from the ith township to the nth township at the zth hauling zone (km) |
| RHQin | = | hauling quantity by truck moving from the ith township to the nth township (kg) |
| RS | = | routing time of circuit way linked two townships (time),RSzmi routing time from the mth township to the ith township at the zth hauling zone, RSzin routing time from thei th township to the nth township at the zth hauling zone |
| RSEi | = | routing time of circuit way ended at the ith township (time), RSEzi routing time of circuit way ended at the ith township at the zth hauling zone |
| RSSi | = | routing time of circuit way started at the ith township (time), RSSzi routing time of circuit way started at the ith township at the zth hauling zone |
| RTIME | = | the maximum time for each routing (= 4 hr) |
| RSPEED | = | the maximum speed of truck (= 60 kilometer hr−1) |
| Sh | = | annual salary for hauling service per person (= 300,000 NTD yr−1) |
Funding
The authors gratefully acknowledge the financial support of the Ministry of Science and Technology, Taiwan, Republic of China, under contract NSC 102-2221-E-006-288-MY3 for this study.
Additional information
Notes on contributors
Jeng-Chung Chen
Jeng-Chung Chen is a professor in the Department of Environmental Engineering and Science at Fooyin University, Taiwan, Republic of China.
Wei-Hsin Chen
Wei-Hsin Chen is a professor in the Department of Aeronautics and Astronautics at National Cheng Kung University, Taiwan, Republic of China.
References
- Batzias, F.A., D.K. Sidiras, and E.K. Spyrou. 2005. Evaluating livestock manures for biogas production: A GIS based method. Renew. Energy 30:1161–1176. doi:10.1016/j.renene.2004.10.001
- Bird, L.A., E. Holt, and G.L. Carroll. 2008. Implications of carbon cap-and-trade for US voluntary renewable energy markets. Energy Policy 20:2063–2073. doi:10.1016/j.enpol.2008.02.009
- Budzianowski, W.M. 2011. Can ‘negative net CO2 emissions’ from decarbonised biogas-to -electricity contribute to solving Poland’s carbon capture and sequestration dilemmas? Energy 36:6318–6325. doi:10.1016/j.energy.2011.09.047
- Budzianowski, W.M. 2012. Sustainable biogas energy in Poland: Prospects and challenges. Renew. Sustain. Energy Rev. 16:342–349. doi:10.1016/j.rser.2011.07.161
- Cai, Y.P., G.H. Huang, Q.G. Lin, X.H. Nie, and Q. Tan, 2009. An optimization-model-based interactive decision support system for regional energy management systems planning under uncertainty. Expert Syst. Appl. 36:3470–3482. doi:10.1016/j.eswa.2008.02.036
- Chen, J.C., S.K. Ning, and Y.L. Chen. 2011. Strategy for effective hauling service to optimize the development of biomass energy in a smallholder livestock area. Sustain. Environ. Res. 21:123–133.
- Chen, W.H. 2002. An analysis of gas absorption by a liquid aerosol in a stationary environment. Atmos. Environ. 36:3671–3683. doi:10.1016/S1352-2310(02)00244-3
- Chen, W.H. 2006. Scavenging waves and influence distances of gas absorption around single liquid aerosols in clouds. Atmos. Environ. 40:500–511. doi:10.1016/j.atmosenv.2005.10.072
- Chen, W.H., and J.J. Lu. 2003. Microphysics of atmospheric carbon dioxide uptake by a cloud droplet containing a solid nucleus. J. Geophys. Res. D Atmos. 108(D15):4470–4478. doi:10.1029/2002JD003318
- Dagnall, S., J. Hill, and D. Pegg. 2000. Resource mapping and analysis of farm livestock manures—Assessing the opportunities for biomass-to-energy schemes. Bioresour. Technol. 71:225–234. doi:10.1016/S0960-8524(99)00076-0
- Davila, E., and N.B. Chang. 2005. Sustainable pattern analysis of a publicly owned material recovery facility in a fast-growing urban setting under uncertainty. J. Environ. Manage. 75:337–351. doi:10.1016/j.jenvman.2004.11.016
- Domac, J., L.K. Richards, and S. Risovic. 2005. Socio-economic drivers in implementing bioenergy projects. Biomass Bioenergy 28:97–106. doi:10.1016/j.biombioe.2004.08.002
- Elghali, L., R. Clift, P. Sinclair, C. Panoutsou, and A. Bauen. 2007. Developing a sustainability framework for the assessment of bioenergy systems. Energy Policy 35:6075–6083. doi:10.1016/j.enpol.2007.08.036
- Fujino, J., A. Morita, Y. Matsuoka, and S. Sawayama. 2005. Vision for utilization of livestock residue as bioenergy resource in Japan. Biomass Bioenergy 29:367–374. doi:10.1016/j.biombioe.2004.06.017
- Gerber, P., P. Chilonda, G. Franceschini, and H. Menzi. 2005. Geographical determinants and environmental implications of livestock production intensification in Asia. Bioresour. Technol. 96:263–276. doi:10.1016/j.biortech.2004.05.016
- Honorio, L. 2003. Efficiency in Electricity Generation. Brussels, Belgium: Union of the Electricity Industry—EURELECTRIC, VGB. July.
- Huang, Y., X. Chen, Y.P. Li, A.M. Bao, and Y.G. Ma. 2012. A simulation-based two-stage interval-stochastic programming model for water resources management in Kaidu-Konqi watershed. China J. Arid Land 4:390−398. doi:10.3724/SP.J.1227.2012.00390
- Intergovernmental Panel on Climate Change (IPCC). 2008. 2006 IPCC Guidelines for National Greenhouse Gas Inventories – A primer, Prepared by the National Greenhouse Gas Inventories Programme, eds. H.S. Eggleston, K. Miwa, N. Srivastava, and K. Tanabe, 16–17. Japan: IGES.
- Karmakar, S., and P.P. Mujumdar. 2006. An inexact optimization approach for river water-quality management. J. Environ. Manage. 81:233–248. doi:10.1016/j.jenvman.2005.10.009
- Li, Y.P., G.H. Huang, S.L. Nie, and X.S. Qin. 2007. ITCLP: An inexact two-stage chance-constrained program for planning waste management systems. Resour. Conserv. Recycl. 49:284–307. doi:10.1016/j.resconrec.2006.03.017
- Lin, Q.G., G.H. Huang, B. Bass, and X.S. Qin. 2009. IFTEM: An interval-fuzzy two-stage stochastic optimization model for regional energy systems planning under uncertainty. Energy Policy 37:868–878. doi:10.1016/j.enpol.2008.10.038
- Lin, Q.G., and G.H. Hung. 2009. Planning of energy system management and GHG-emission control in the Municipality of Beijing—An inexact-dynamic stochastic programming model. Energy Policy 37:4463–4473. doi:10.1016/j.enpol.2009.05.066
- Martinez, J., P. Dabert, S. Barrington, and C. Burton. 2009. Livestock waste treatment systems for environmental quality, food safety, and sustainability. Bioresour. Technol. 100:5527–5536. doi:10.1016/j.biortech.2009.02.038
- Melse, R.W., and N. Verdoes. 2005. Evaluation of four farm-scale systems for the treatment of liquid pig manure. Biosyst. Eng. 92:47–57. doi:10.1016/j.biosystemseng.2005.05.004
- Mepo Forum. 2010. Pig farmer’s good idea turns pig manure into green energy. Mepo Forum, December 22. http://mepopedia.com/forum/read.php?160,10068 (accessed December 22, 2010).
- Mihic, S. 2004. Biogas fuel for internal combustion engines. Annals of the Faculty Engineering Hunedoara. 2(3): 179–190.
- Nelson, C., and J. Lamb. 2002. Final Report: Haubenschild Farms Anaerobic Digester. The Minnesota Project. www.mnproject.org (accessed February 2, 2006).
- Perez, C., C. Roncoli, C. Neely, and J.L. Steiner. 2007. Can carbon sequestration markets benefit low-income producers in semi-arid Africa? Potentials and challenges. Agric. Syst. 94:2–12. doi:10.1016/j.agsy.2005.09.009
- Ramachandra, T.V., N.V. Joshi, and D.K. Subramanian. 2000. Present and prospective role of bioenergy in regional energy system. Renew. Sustain. Energy Rev. 4:375–430. doi:10.1016/S1364-0321(00)00002-2
- Rosenthal, E. 2008. As more eat meat a bid to cut emissions. New York Times, Science and Earth, December 4, 2008.
- Sajjakulnukit, B., R. Yingyuad, V. Maneekhao, V. Pongnarintasut, S.C. Bhattacharya, and P. Abdul Salam. 2005. Assessment of sustainable energy potential of non-plantation biomass resources in Thailand. Biomass Bioenergy 29:214–224. doi:10.1016/j.biombioe.2005.03.009
- Steinfeld, H., P. Gerber, T. Wassenaar, V. Castel, M. Rosales, and C. de Haan. 2006. Livestock’s Long Shadow—Environmental Issues and Options, 112–113. Rome: Food and Agriculture Organization (FAO) of the United Nations.
- Vanotti, M.B., A.A. Szogi, and C.A. Vives. 2008. Greenhouse gas emission reduction and environmental quality improvement from implementation of aerobic waste treatment systems in swine farms. Waste Manage. 28:759–766. doi:10.1016/j.wasman.2007.09.034
- Yeh, H.C., J.C. Chen, and Y.L. Chen. 2011. Feasibility analysis of utilizing swine manure as an energy source in the southwest Taiwan. Energy Sources A 33:229–243. doi:10.1080/15567030903078038.