
Abstract
Three modeling approaches, the U.S. Environmental Protection Agency’s (EPA) Community Multiscale Air Quality (CMAQ) zero-out, the Comprehensive Air quality Model with extensions (CAMx) zero-out, and the CAMx probing tools ozone source apportionment tool (OSAT), were used to project the contributions of various source categories to future year design values for summer 8-hr average ozone concentrations at selected U.S. monitors. The CMAQ and CAMx zero-out or brute-force approaches predicted generally similar contributions for most of the source categories, with some small differences. One of the important findings from this study was that both the CMAQ and CAMx zero-out approaches tended to apportion a larger contribution to the “other” category than the OSAT approach. For the OSAT approach, this category is the difference between the total emissions and the sum of the tracked emissions and consists of non-U.S. emissions. For the zero-out approach, it also includes the effects of nonlinearities in the system because the sum of the sensitivities of all sources is not necessarily equal to the sum of their contributions in a nonperturbed environment. The study illustrates the strengths and weaknesses of source apportionment approaches, such as OSAT, and source sensitivity approaches, such as zero-out. The OSAT approach is suitable for studying source contributions, whereas the zero-out approach is suitable for studying response to emission changes. Future year design values of summer 8-hr average ozone concentrations were projected to decrease at all the selected monitors for all the simulations in each city, except at the downtown Los Angeles monitor. Both the CMAQ and CAMx results showed all modeled locations project attainment in 2018 and 2030 to the current National Ambient Air Quality Standards (NAAQS) level of 75 ppb, except the selected Los Angeles monitor in 2018 and the selected San Bernardino monitor in 2018 and 2030.
Implications:
This study illustrates the strengths and weaknesses of three modeling approaches, CMAQ zero-out, CAMx zero-out, and OSAT to project contributions of various source categories to future year design values for summer 8-hr average ozone concentrations at selected U.S. monitors. The OSAT approach is suitable for studying source contributions, whereas the zero-out approach is suitable for studying response to emission changes. Future year design values of summer 8-hr average ozone concentrations were projected to decrease, except at the downtown Los Angeles monitor. Comparing projections with the current NAAQS (75 ppb) show attainment everywhere, except two locations in 2018 and one location in 2030.
Introduction
In recent years, the amount of vehicle-related emissions has decreased due to the introduction of new vehicles with cleaner technology and the retiring of older vehicles with less clean technology. The California Air Resources Board (CARB) has approved the Low Emission Vehicle third-generation (LEV III) standards, and the U.S. Environmental Protection Agency (EPA) adopted similar requirements. The expected changes to air quality due to these mobile source requirements were modeled and described in a study by Collet et al. (Citation2014) and in another study by Vijayaraghavan et al. (Citation2012). Collet et al. (Citation2012) used the Comprehensive Air quality Model with extensions (CAMx) model (version 4.6) (Byun and Schere, Citation2006) to compare the air quality impacts in California’s South Coast Air Basin (SoCAB) of emissions from passenger cars and light-duty trucks under the California Low Emission Vehicle II (LEV II) standards with those from a control scenario that was anticipated in 2008 to become LEV III. Separately, Vijayaraghavan et al. (Citation2012) compared the estimated effect of past, present, and potential future emission standards for light-duty gasoline vehicles on ozone and fine particulate matter (aerodynamic diameter <2.5 μm; PM2.5) in the eastern and western United States (U.S.) using the CAMx model (ENVIRON, Citation2011). From these studies, it was apparent that the light-duty vehicle changes alone will not drive the U.S. to the current National Ambient Air Quality Standards (NAAQS) attainment level.
This study builds upon the previous study of Collet et al. (Citation2014), in which projected ozone outcomes resulting from implementing air quality regulations in the U.S. that are on-the-books or on-the-way were calculated. The previous study was done by developing anthropogenic emission inventories for 2018 and 2030, and Community Multiscale Air Quality (CMAQ) simulations were conducted to estimate future year ambient concentrations of ozone for a summer month (July) using 2008 meteorology and natural emissions in the eastern and western U.S. Subsequently, the study described here was done to predict the future contribution of each source category to future year 8-hr average ozone design value concentrations for the same domains and modeling period as in the previous study. The calculations used the EPA’s Modeled Attainment Test Software (http://www.epa.gov/scram001/modelingapps_mats.htm). The design value is a statistic that describes the air quality status of a given location relative to the level of the NAAQS over an averaging time based on a form of the standard (http://www.epa.gov/airtrends/values.html). In the case of 8-hr ozone, the design value is the annual fourth-highest daily maximum 8-hr concentration, averaged over 3 yr (http://www.epa.gov/air/criteria.html). The resulting number determines if a location is below the standard level or above it. Results from different modeling approaches used to calculate these contributions were compared to determine the sensitivity of the results to the approach used. This study modeled the contributions of boundary conditions, various anthropogenic emission source categories, and natural emissions to future year (2018 and 2030) concentrations of 8-hr average ozone concentrations during a summer month (July), which is typically when the highest ozone levels occur. The study used the CMAQ model version 4.7.1 and CAMx version 5.40 (ENVIRON, Citation2011). Source contributions were calculated with CMAQ and CAMx using the brute-force (“zero-out”) methodology, as well as a probing tool built into CAMx, referred to as the Ozone Source Apportionment Tool (OSAT) (Yarwood et al., Citation1996). OSAT offers the capability to use unique source attribution tools to track source contributions and was initially implemented in CAMx by Dunker et al. (Citation2002). This tool provides a method for estimating the contributions of multiple source areas, categories, and pollutant types to ozone formation in a single model run, which is a strength over the zero-out approach when a large number of source attribution studies need to be conducted.
The anthropogenic source categories considered in this source attribution study were on-road mobile source emissions, off-road mobile source emissions, emissions from other anthropogenic area (nonpoint) sources, and elevated (point) source emissions. In addition to the anthropogenic source categories, contributions from natural (biogenic and fire) emissions were calculated as well as the contribution of global boundary conditions: these boundary conditions were derived from the global photochemical model, MOZART (e.g., Emmons et al., Citation2010), used for the 36 km continental U.S. (CONUS) domain (see following section). The differences between the base 8-hr average ozone concentrations and the sum of the estimated contributions to the 8-hr values from tracked source categories were assigned to the “other” category. In the brute-force simulation results, this category represents the effects of both nonlinearities in the system as well as emissions not tracked explicitly (e.g., non-U.S. emissions), whereas in the OSAT results this category represents the contributions of emissions from source categories that are not tracked explicitly.
Methods
Model inputs
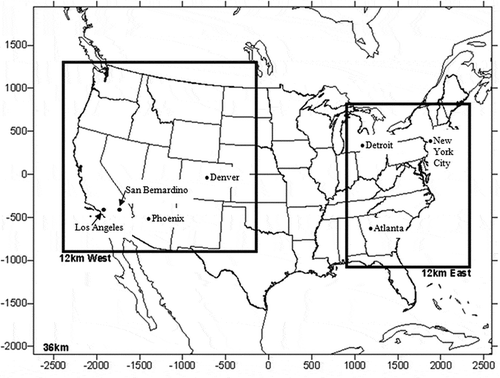
The simulations were conducted for the month of July in two future years (2018 and 2030). A nested-grid configuration was used for the CMAQ and CAMx simulations, with a 36 × 36 km resolution outer domain (CONUS) covering the lower 48 states and adjacent portions of Canada and Mexico, and two 12 × 12 km resolution inner domains covering the eastern and western U.S. describes the CMAQ and CAMx domains, whereas shows the three CMAQ modeling domains. Predictions from the outer coarse resolution domain provided the initial and boundary conditions for the finer 12 km grid resolution inner domains, whereas predictions from the MOZART global chemistry model provided the boundary conditions for the 36 km resolution domain. A one-way nest was used for the nested-grid modeling. The black carbon (BC) contributions that are presented for the nested 12 km domains are global. However, it should be noted that future year emissions were not considered in the MOZART global simulations, so the global BC contributions presented do not reflect potential impacts due to future changes in global emissions outside the 36 km modeling domain. The following calculation represented by eq 1 was used to estimate the total global BC contributions (BCTOT) for a given grid cell within the 12 km domain from the 36 km and 12 km BC attribution results:
Table 1. CMAQ and CAMx domain definitions (km)
Figure 1. Visual example of 36 km and eastern and western U.S.12 km modeling domains used for the CMAQ simulations and city locations.
For the CMAQ and CAMx zero-out runs, emission files without each category (one category at a time) were created, with the exception of the global boundary condition scenario. For the global boundary condition contribution, all emission categories were included, but the boundary conditions for the 36 km CONUS domain were set to zero.
CMAQ zero-out scenario inputs were prepared for the sensitivity studies. Various combinations of the Sparse Matrix Operator Kernel Emissions (SMOKE; http://cmascenter.org/smoke/index.cfm) processing streams were merged as appropriate to exclude a particular source category. Since CMAQ provides the option to specify point source emissions separately from the gridded emissions from other sources, no processing was required for the point source zero-out scenario. Only distributed sources (mobile sources, area sources, natural emissions) were processed in developing the emission files for the source contribution calculations.
Next, CAMx zero-out scenario inputs were prepared for the sensitivity studies. CAMx requires two types of emission files for every episode day. One type is the surface-level two-dimensional (2D) emissions. It contains 2D gridded fields of low-level (i.e., surface) emission rates for all emitted species to be modeled. The second type is elevated point source emissions. It contains stack parameters and emission rates for all elevated point sources, and for all emitted species, to be modeled. For the zero-out (brute-force) sensitivity modeling with CAMx, CMAQ model-ready emissions were converted for the future year base and CMAQ zero-out scenarios into CAMx format using the CMAQ2CAMX program available at http://www.camx.com/download/support-software.aspx. CAMx needs only one elevated point source file for the master 36 km domain. The elevated point source file is independent of the modeling grid because it contains geographic coordinates for point sources for spatial allocation. Three separate elevated anthropogenic point source files were created for the future year base and source attribution scenarios: (1) base point source file containing emissions and elevated fire emissions; (2) emissions only for the natural emissions zero-out simulations; and (3) elevated fire emissions only for the anthropogenic point source emissions zero-out simulations. Another key difference between CMAQ and CAMx is that CMAQ internally computes sea salt emissions, whereas CAMx requires separate estimates of sea salt emissions that need to be merged with other emissions. Thus, as a final step, sea salt emissions were merged with the surface-level emissions using the MRGUAM processor (ENVIRON, Citation2009) available at the CAMx support software Web site to develop CAMx model-ready emissions.
CAMx gridded emissions for July 2018 and 2030 are shown in ; these are the low-level (surface) emissions from on-road mobile sources, off-road mobile sources, other area source, biogenic emissions, and surface and elevated emissions from fires. shows CAMx July 2030 elevated point source emissions.
Table 2. CAMx gridded emission totals (tons/month) for July
Table 3. Elevated point source emission totals (tons/month) for July 2030
The CAMx probing tools approach calculates source contributions from assigned source categories in a single simulation per domain. Thus, separate emission files for each source category were provided as inputs in this approach. To achieve this, emissions for the separate groups were supplied as sets of separate emission files for each source group: a low-level (gridded) file for each fine grid nest and one elevated point source file. To keep the source apportionment run manageable, and because overlap in source groups is not allowed, the on-road mobile subcategories in the source apportionment runs were not considered separately. It is assumed that the distribution of contributions from subcategories in the CAMx source apportionment runs can be approximated from the distribution obtained from the corresponding CAMx zero-out runs. The source group files were developed by merging appropriate components from the SMOKE processing streams and then converting into CAMx format.
Air quality model setup
After the inputs were prepared, the air quality models were configured to perform the calculations. CMAQ simulations for the month of July for the base year 2008 were already available from the previous study described in Collet et al. (Citation2014). Model evaluation results for the same period have also been presented in Collet et al. (Citation2014). As in the previous study, version 4.7.1 of CMAQ (released in June 2010) was used with the recommended options for the various CMAQ science modules. The CMAQ 36 km and eastern and western 12 km domains use meteorology from a 2008 Weather Research and Forecasting (WRF) simulation performed for the West-wide Jumpstart Air Quality Modeling Study (WestJUMP AQMS; ENVIRON, Citation2013), whereas the northeastern 12 km domain used meteorology from a 2008 WRF simulation performed by EPA covering the continental U.S. at 12 km resolution (Gilliam, Citation2010). CMAQ-ready meteorology files for the simulations for the 36 km and 12 km resolution domains were obtained by running version 3.6 (released June 2010) of the Meteorology-Chemistry Interface Processor (MCIP; Otte and Pleim, Citation2010) on the 2008 WRF outputs obtained from EPA and WestJUMP AQMS. The same base year meteorology files were also used in the future year simulations for 2018 and 2030. CAMx simulations for the base year were also conducted using the latest available version of CAMx at the time of this study (version 5.40; released October 2011) for the zero-out and probing tool simulations. The CAMx configuration included CB05 gas-phase chemistry mechanism with Euler Backward Iterative (EBI) chemistry solver; Piecewise Parabolic Method (PPM) horizontal advection scheme; K-theory horizontal and vertical diffusion; photolysis rate adjustment for the presence of clouds; and Zhang dry deposition scheme (Zhang et al., Citation2001, Citation2003). The CAMx probing tools simulations for 2018 and 2030 share the CAMx model configuration and have the OSAT probing tools turned on to track individual source category contributions to total ozone throughout the simulation. Next, CAMx meteorology, land use, and boundary conditions were configured. CAMx-ready meteorology files were obtained using the WRFCAMx version 3.4 (http://www.camx.com/download/support-software.aspx) processor, released in November 2012. These 2008 meteorology files were used for the base year 2008 and future year 2018 and 2030 CAMx simulations. WRF was run with the planetary boundary layer (PBL) scheme that does not contain turbulent kinetic energy (TKE) fields. So, the Yonsei University (YSU) vertical diffusivity (Kv) methodology in WRFCAMx was used. This methodology uses wind, temperature, and PBL parameters from WRF to derive the vertical diffusivities within WRFCAMx. Subgrid cloudiness was diagnosed from grid-resolved thermodynamic parameters for all domains in a manner similar to that used in CMAQ (Emery et al., Citation2010). WRFCAMx can optionally generate land use fields from the WRF output fields. WRF output fields contain only the dominant land use type for a given grid cell (i.e., one land use type makes up 100% of a grid cell’s area). So, instead geographic information system (GIS) processing techniques that allow the use of fractional land use percentages obtained from satellite data in CAMx were used. Leaf area index (LAI) fields were generated from satellite data and were added to the land use file: these LAI fields override the default assumptions used in the Zhang dry deposition scheme, resulting in more accurate deposition velocities in CAMx. Note that the CAMx OSAT probing tool can optionally utilize a receptor file, which contains grid cell locations representing monitor locations. This type of file is useful because CAMx will produce an ASCII-formatted comma separated (CSV) file containing only the contributions to ozone at the specified monitor locations given in the receptor file. The downside to this approach is that a new model run is needed if additional receptors are desired. Therefore, the binary gridded source apportionment model results were processed to provide the flexibility of examining source contributions at other monitors besides those selected for this study. This process shares many of the same processing steps as the CMAQ and CAMx zero-out approaches.
summarizes the inputs and model configurations for the CMAQ and CAMx simulations. The basis for the 2030 emissions was EPA’s 2030 inventory, developed to support the “Heavy Duty Greenhouse Gas (HDGHG)” rule and made available through EPA’s Emissions Modeling Clearinghouse (available at ftp://ftp.epa.gov/EmisInventory/2005v4_2/hdghg). The control and growth assumptions used in preparing this inventory are documented in the Technical Support Document (TSD) for the emission inventories (available at http://www.epa.gov/otaq/climate/documents/420r11008.pdf). The EPA Motor Vehicles Emission Simulator (MOVES) model was used to generate 2030 on-road mobile emissions with Tier 3 controls.
Table 4. CMAQ and CAMx model inputs and configurations
Source category contributions in the two 12 km resolution modeling domains were predicted at specific receptors located in Atlanta, Georgia; Detroit, Michigan; New York City, New York; Los Angeles and San Bernardino, California; Denver, Colorado; and Phoenix, Arizona. These metropolitan cities were selected because they had valid ambient data meeting EPA’s modeling guidance (http://www.epa.gov/scram001/guidance/guide/8-hour-o3-guidance-final-version.pdf).
Projections of future year summer ozone design values and contributions
The design value (DV) for ozone is calculated as an 8-hr average, and the form of the standard is the average of the annual fourth-highest daily maximum 8-hr average ozone concentration at an ambient air quality monitoring site (40 CFR 50.10) averaged over 3 yr. When the design value level is less than or equal to the required level, which for the 8-hr primary and secondary ozone ambient air quality standards currently is 75 ppb, then an area is considered in attainment (http://www.epa.gov/air/criteria.html). The EPA Modeled Attainment Test Software (MATS) was used in this study to project future year design values for July ozone concentrations at the selected monitoring locations in the eastern and western U.S. The MATS tool includes ambient ozone air quality data, and the user provides modeling results for the current year base case and the future year of interest. A series of MATS analyses was conducted using the year 2008 modeling results as the base case and future year source category scenarios as future cases. The analyses were performed with the CMAQ and CAMx modeling results from all three types of source attribution techniques employed in this study: CMAQ zero-out simulations, CAMx zero-out simulations, and CAMx Source Apportionment (OSAT) simulations. Source contributions to future year ozone design values were calculated. The procedures for performing a modeled ozone attainment demonstration as outlined in EPA’s current 8-hr ozone modeling guidance (EPA, Citation2007) were followed. EPA’s current recommended procedures for making future year ozone projections involve the use of the model in a relative sense to scale the observed site-specific current year 8-hr ozone design value concentration (DVC) based on the relative changes in the modeled 8-hr ozone concentration between the current year and the future year. The model-derived scaling factors are called relative reduction factors (RRFs) and are based on the relative changes in the modeling results between the current year base case and the future year emission scenarios. The model-derived RRFs were applied to the DVC to obtain future year 8-hr ozone design values (DVFs). Equation 2 is an example of the DVF for 2018 based on the CMAQ results:
These EPA guidance procedures for performing 8-hr ozone DV projections have been codified in the MATS tool. The general MATS procedure was employed for projecting 8-hr ozone DV at a monitoring site. Following EPA guidance, the 2008 8-hr average ozone DVC was obtained as a 5-yr weighted average of observations at monitors over the 2006–2010 period.
Results and Analysis
Source apportionment
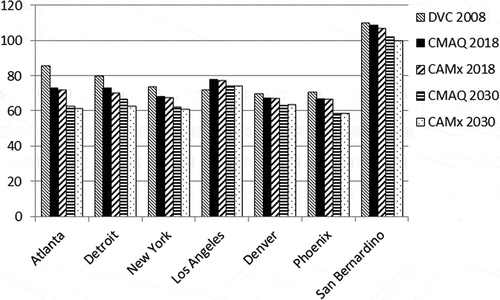
Before discussing the source attribution results obtained in this study, it is useful to understand the differences between the two models (CMAQ and CAMx) in their predictions of 8-hr average ozone concentrations in the two future years. shows the total summer ozone DVC (ppb) for 2008 as well as the 2018 and 2030 DVFs at selected MATS monitors. As shown in the figure, 8-hr ozone design values are projected to decrease from 2008 to 2018 and from 2008 to 2030 at all the selected monitors, except the Los Angeles monitor. All selected monitors are projected to have a decrease in 8-hr ozone concentration design value from 2018 to 2030. In 2018, all but the Los Angeles and San Bernardino monitors will meet the current standard of 75 ppb. In 2030, only the San Bernardino monitor will not meet the current standard.
Figure 2. Total summer ozone (ppb) for 2008 DVC and 2018 and 2030 DVF at selected MATS monitors for CMAQ and CAMx.
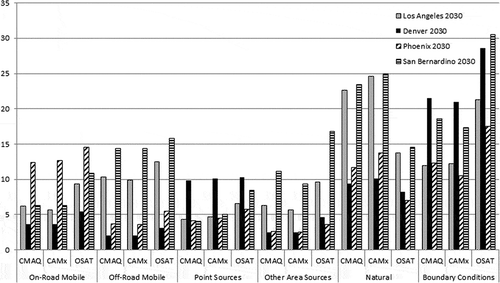
Source contributions to the DVF were determined by subtracting the DVF without the source from total DVF. These contributions were only calculated for the tracked source categories, i.e., the “other area sources” contribution category was not tracked. The results for the source apportionment to DVFs are shown in and for the eastern cities in 2018 and 2030, respectively, and and for the western cities in 2018 and 2030, respectively. and show that on-road mobile, off-road mobile, point, natural sources, and boundary condition DVF 8-hr average ozone concentration contributions decline between 2018 and 2030 in the three eastern U.S. cities from all three modeling approaches, whereas “other area sources” remain the same. The zero-out approaches have similar results for all three eastern U.S. cities. There are larger differences between the CMAQ and CAMx zero-out approaches and the CAMx OSAT approach. In particular, both the CMAQ and CAMx zero-out runs for DVF predict lower contributions than the OSAT results for all sources except the “Natural” source. These differences in estimated contributions from the OSAT and zero-out approaches reflect the fundamental differences in the two approaches: OSAT is a source apportionment approach, whereas zero-out is a source sensitivity approach. Because of nonlinearities in the system, the sum of the contributions with the zero-out approach is not the same as the sum of the contributions with OSAT. In the zero-out case, there are large perturbations in the emissions, whereas in the OSAT case the total emissions remain the same. Both approaches have their own strengths and weaknesses. The OSAT approach is suitable for calculating source contributions assuming no changes in emissions, whereas the zero-out approach is suitable for determining the effect of reducing emissions from a particular source category. As noted by Cohan et al. (Citation2005), ozone cannot be strictly apportioned as a sum of zero-out contributions, due to nonlinearities. Other studies (e.g., Farooqui et al., Citation2013) have also examined the differences between approaches such as zero-out, sensitivity coefficients, and OSAT.
Figure 3. Source contribution of 2018 summer ozone DVF (ppb) in Atlanta, Detroit, and New York. The individual source models are designated as CMAQ and CAMx for the zero-out methods and OSAT for CAMx OSAT.
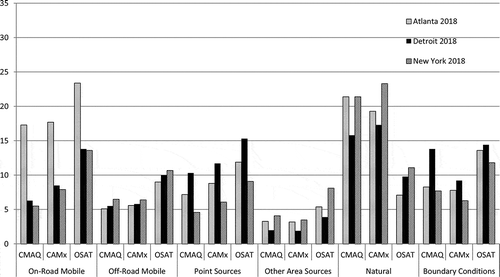
Figure 4. Source contribution of 2030 summer ozone DVF (ppb) in Atlanta, Detroit, and New York. The individual source models are designated as CMAQ and CAMx for the zero-out methods and OSAT for CAMx OSAT.
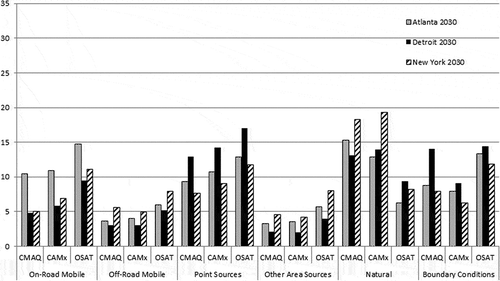
Figure 5. Source contribution of 2018 summer ozone DVF (ppb) in Los Angeles, Denver, Phoenix, and San Bernardino. The individual source models are designated as CMAQ and CAMx for the zero-out methods and OSAT for CAMx OSAT.
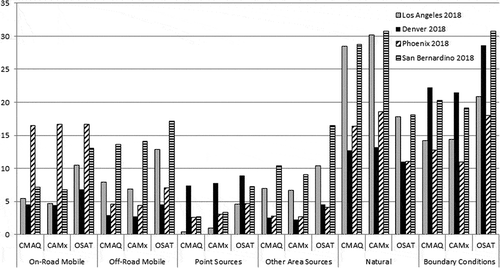
Figure 6. Source contribution of 2030 summer ozone DVF (ppb) in Los Angeles, Denver, Phoenix, and San Bernardino. The individual source models are designated as CMAQ and CAMx for the zero-out methods and OSAT for CAMx OSAT.
The differences between the OSAT and zero-out approaches also provide an explanation of the lower contributions predicted by OSAT for natural sources as compared with those predicted by the zero-out approach. Natural volatile organic compound (VOC) emissions dominate total VOC emissions, particularly in the eastern U.S., and are highly reactive, whereas natural nitrogen oxide (NOx) emissions are typically smaller than anthropogenic emissions. When such a large source of reactive VOCs is removed in the zero-out calculations, it is likely that many areas that are normally NOx-limited become VOC-limited; thus, the zero-out approach tends to assign greater weighting to the natural sources. On the other hand, the OSAT calculations are conducted under existing conditions when most areas tend to be NOx-limited rather than VOC-limited. When ozone is formed under NOx-limited conditions due to biogenic VOC and anthropogenic NOx, the OSAT approach attributes the ozone formed to anthropogenic NOx. Thus, OSAT assigns lower weighting to the natural sources.
Some general conclusions can be made about the predicted source contributions to DVF 8-hr ozone concentrations. shows the general trends in source contributions to future year design values 8-hr ozone concentrations between 2018 and 2030. As shown in , the contributions of on-road mobile sources, off-road mobile sources, and natural sources decrease between 2018 and 2030 for the selected cities in both the eastern and western U.S. modeling domains. On the other hand, point source contributions increase from 2018 to 2030, whereas the contributions of other area sources and the global background show small changes between the two future years.
Table 5. Source apportionment general direction results for DVF 8-hr ozone concentrations between 2018 and 2030
shows the general ranking (highest to lowest) of the contributions to 8-hr ozone concentrations of DVFs to the various source categories. As shown in the table, natural sources are predicted to have the largest contributions for the selected monitors in the eastern U.S. in both future years, whereas off-road mobile sources and other area sources have the smallest contributions. In 2018, on-road mobile sources are the second-largest contributors in the selected eastern U.S. monitors, followed by global background and point sources. In 2030, the contributions of global background, on-road mobile sources, and point sources are comparable at the eastern U.S. monitors.
Table 6. Source general ranking results for DVF 8-hr ozone concentrations
At the western U.S. monitors, there is more variability between the two future years in the source rankings of contributions to maximum ozone concentrations and DVFs. For example, natural sources are the largest contributors to maximum ozone concentrations in 2018, followed by the global background, but in 2030 the global background contributions are larger than natural source contributions. On-road mobile source emissions are the third largest contributors to maximum ozone concentrations in both future years. For the DVFs, the largest contributions are from natural sources followed by the global background. The next largest contributors are on-road and off-road mobile sources. The contributions from these two categories are comparable in 2018, but off-road contributions are higher in 2030. Point sources are the smallest contributors to maximum ozone concentrations and DVFs at the western U.S. monitors in both future years.
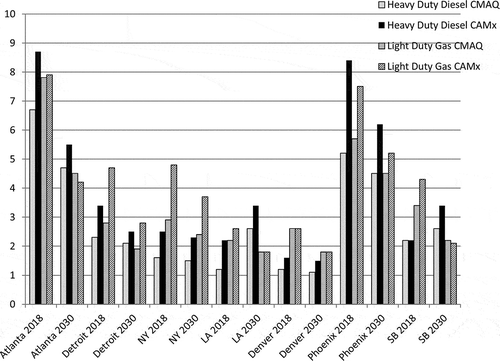
The following subcategories of the on-road mobile source emission component were also evaluated for DVF: light-duty gasoline vehicles (LDGVs), heavy-duty gasoline vehicles (HDGVs), light-duty diesel vehicles (LDDVs), and heavy-duty diesel vehicles (HDDVs). When analyzing the subcategories for on-road vehicles maximum ozone, in all locations, the on-road subcategories zero-out approaches show that heavy-duty gas and light-duty diesel have almost no contributions to ozone concentrations; non-negligible contributions are only predicted for heavy-duty diesel and light-duty gasoline vehicles. shows the July 2018 and 2030 results for maximum 8-hr average ozone contributions (ppb) by city for heavy-duty diesel and light-duty gas using the CMAQ and CAMx zero-out methods. Heavy-duty diesel and light-duty gas concentration contributions decrease between 2018 and 2030 except at the selected Los Angeles and San Bernardino monitors, where heavy-duty diesel contributions increase slightly.
Figure 7. July 2018 and 2030 maximum 8-hr average ozone contributions (ppb) overall results by city for heavy-duty diesel and light-duty gas using CMAQ and CAMx zero-out methods.
Conclusion
The source attribution results from this study provide useful information on the important source categories and provide some initial guidance on future emission reduction strategies. However, since complete reductions of emissions from a given category are not feasible, it is also necessary to conduct partial reduction studies or use tools such as DDM (direct decoupled method) to calculate sensitivity coefficients, in order to refine these strategies. This study has shown that the various approaches used to conduct source attribution analysis yield similar results for most of the major contributors, but there are also some large differences. Some of the differences can be traced to model differences, whereas other differences are related to the limitations of the zero-out approach. One of the important findings from this study was that both the CMAQ and CAMx zero-out approaches tended to apportion a larger contribution to the “other” category than the CAMx probing tools (OSAT for ozone) approach. For the zero-out runs, the contributions of this category are calculated from the zero-out results by subtracting the sum of the contributions of the simulated source categories from the base ozone concentration. It primarily represents the “unexplained” component of the zero-out analysis, i.e., the limitations of using the zero-out approach for a nonlinear system. In the CAMx probing tools approach, this category is explicitly tracked as the difference between the base emissions and the sum of the tracked source category emissions and represents the contributions of these untracked emissions. In the case of the maximum 8-hr average summer ozone concentrations, the contribution of the “other” source category was much larger for the zero-out approaches than for the OSAT approach. Source apportionment approaches such as OSAT and source sensitivity approaches such as zero-out have strengths and weaknesses. The OSAT approach is suitable for looking at source contributions, whereas the zero-out approach is suitable for addressing questions of response to emission changes. The zero-out approach includes the effects of nonlinearities in the system because the sum of the sensitivities of all sources is not necessarily equal to the sum of their contributions in a nonperturbed environment. This may be viewed as a weakness when addressing questions of source contribution. On the other hand, zero-out may have strength in addressing questions of response to emission changes.
Regarding the comparison between 8-hr average ozone concentration results from the CMAQ and CAMx models for the overall maximum and DVF results, the values vary with no pattern by city, model, or source. For the selected monitor locations, the maximum ozone concentration between 2018 and 2030 decreases in Atlanta, Detroit, New York, and San Bernardino, stays about the same in Denver and Phoenix, and increases in Los Angeles. In the DVF analysis, except for Los Angeles, all the selected monitors are projected to have a decrease in 8-hr ozone concentration design value from 2008 to 2018 and from 2008 to 2030, and all the monitors are projected to have a decrease in 8-hr ozone concentration design value from 2018 to 2030. In 2018, all locations will meet a 75 ppb design value except the selected Los Angeles and San Bernardino monitors. In 2030, only the San Bernardino will not meet a 75 ppb design value. This study has also shown that global boundary conditions appear to play an important role, particularly for ozone concentrations.
Regarding the comparisons among 8-hr average ozone concentration results from the CMAQ and CAMx zero-out runs and the CAMx source apportionment approach for the maximum and DVF results, again the values vary with no pattern by city, model, or source. However, some general conclusions can be made regarding the source apportionment results for the maximum and DVF 8-hr ozone concentrations, while not including the “other” category. When comparing very generally between 2018 and 2030 for 8-hr average ozone maximum and DVF values, the selected monitors in the eastern and western U.S. generally show a decrease in ozone contributions for on-road mobile and natural sources, an increase for point sources, and nearly the same amount of global background contributions. Off-road mobile contributions show decreases except in the western U.S. locations for DVF values where the changes are negligible. In general, when source contributions are ranked from highest to lowest, the highest contributors tend to be natural emissions and the global background, followed by on-road and off-road mobile source, whereas other area and point sources have the lowest contributions. For on-road mobile emissions, the results show negligible contributions of heavy-duty gas and light-duty diesel vehicles. Almost all the on-road mobile source contributions are attributable to heavy-duty diesel and light-duty gas vehicles. The source attribution results also show that heavy-duty diesel and light-duty gas contributions decrease between 2018 and 2030, except at the selected Los Angeles and San Bernardino monitors, where heavy-duty diesel contributions increase slightly.
It would also be useful to understand the ozone forming potential of different source categories by using the DDM capability in CAMx to calculate sensitivity coefficients (e.g., ppb of ozone formed per ton of emissions from a given source category). These sensitivity coefficients would allow the comparison of the benefits of comparable reductions in emissions from one source category versus another.
Additional information
Notes on contributors
Susan Collet
Susan Collet is a senior principal engineer and Hiroaki Minoura is an executive engineer at Toyota Motor Engineering and Manufacturing, North America, Inc., in Ann Arbor, MI.
Hiroaki Minoura
Susan Collet is a senior principal engineer and Hiroaki Minoura is an executive engineer at Toyota Motor Engineering and Manufacturing, North America, Inc., in Ann Arbor, MI.
Toru Kidokoro
Toru Kidokoro is a group manager, Yukihiro Sonoda is a general manager, and Yukio Kinugasa is a professional partner at Toyota Motor Corporation in Shizuoka, Japan.
Yukihiro Sonoda
Toru Kidokoro is a group manager, Yukihiro Sonoda is a general manager, and Yukio Kinugasa is a professional partner at Toyota Motor Corporation in Shizuoka, Japan.
Yukio Kinugasa
Toru Kidokoro is a group manager, Yukihiro Sonoda is a general manager, and Yukio Kinugasa is a professional partner at Toyota Motor Corporation in Shizuoka, Japan.
Prakash Karamchandani
Prakash Karamchandani is a senior manager, Allison DenBleyker and Jaegun Jung are senior associate managers, and Jeremiah Johnson and Tejas Shah are managers at ENVIRON International Corporation in Novato, CA.
Jeremiah Johnson
Prakash Karamchandani is a senior manager, Allison DenBleyker and Jaegun Jung are senior associate managers, and Jeremiah Johnson and Tejas Shah are managers at ENVIRON International Corporation in Novato, CA.
Tejas Shah
Prakash Karamchandani is a senior manager, Allison DenBleyker and Jaegun Jung are senior associate managers, and Jeremiah Johnson and Tejas Shah are managers at ENVIRON International Corporation in Novato, CA.
Jaegun Jung
Prakash Karamchandani is a senior manager, Allison DenBleyker and Jaegun Jung are senior associate managers, and Jeremiah Johnson and Tejas Shah are managers at ENVIRON International Corporation in Novato, CA.
Allison DenBleyker
Prakash Karamchandani is a senior manager, Allison DenBleyker and Jaegun Jung are senior associate managers, and Jeremiah Johnson and Tejas Shah are managers at ENVIRON International Corporation in Novato, CA.
References
- Byun, D., and K.L. Schere. 2006. Review of the governing equations, computational algorithms, and other components of the Models-3 Community Multiscale Air Quality (CMAQ) modeling system. Appl. Mech. Rev. 59:51–77. doi:10.1115/1.2128636
- Cohan, D.S., A. Hakami, Y. Hu, and A.G. Russell. 2005. Nonlinear response of ozone to emissions: Source apportionment and sensitivity analysis. Environ. Sci. Technol. 39:6739–6748. doi:10.1021/es048664m
- Collet, S., T. Kidokoro, Y. Sonoda, K. Lohman, P. Karamchandani, S.-Y. Chen, and H. Minoura. 2012. Air quality impacts of motor vehicle emissions in the south coast air basin: Current versus more stringent control scenario, Atmos. Environ. 47:236–240. doi:10.1016/j.atmosenv.2011.11.010
- Collet, S., H. Minoura, T. Kidokoro, Y. Sonoda, Y. Kinugasa, and P. Karamchandani. 2014. Evaluation of light-duty vehicle mobile source regulations on ozone concentration trends in 2018 and 2030 in the western and eastern United States. J. Air Waste Manage. 64(2): 175–183. doi:10.1080/10962247.2013.845621
- Dunker A.M., G. Yarwood, J.P. Ortmann, and G.M. Wilson. 2002. Comparison of source apportionment and source sensitivity of ozone in a three-dimensional air quality model. Environ. Sci. Technol. 36:2953–2964. doi:10.1021/es011418f
- Emery, C., J. Jung, J. Johnson, G. Yarwood, S. Madronich, and G.Grell. 2010. Improving the Characterization of Clouds and their Impact on Photolysis Rates within the CAMx Photochemical Grid Model. Prepared for the Texas Commission on Environmental Quality, Austin, TX, by ENVIRON International Corporation, Novato, CA ( August 27, 2010).
- Emmons, L.K., S. Walters, P.G. Hess, J.F. Lamarque, G.G. Pfister, D. Fillmore, C. Granier, A. Guenther, D. Kinnison, T. Laepple, J. Orlando, X. Tie, G. Tyndall, C. Wiedinmyer, S.L. Baughcum, and S. Kloster. 2010. Description and evaluation of the Model for Ozone and Related chemical Tracers, version 4 (MOZART-4). Geosci. Model Dev. 3:43–67. doi:10.5194/gmd-3-43-2010
- ENVIRON. 2009. User’s Guide Emissions Processor Version 3. Novato, CA: ENVIRON International Corporation, August 2009.
- ENVIRON. 2011. Ozone/PM2.5 Modeling for the Northeastern United States. Final report prepared for Toyota Motor Corporation by ENVIRON International Corporation, Novato, CA, February 2011.
- ENVIRON. 2012. Future Year Ozone/PM2.5 Modeling for the Northeastern and Western United States. Final report prepared for Toyota Motor Corporation by ENVIRON International Corporation, Novato, CA, March 2012.
- ENVIRON. 2013. Western Regional Air Partnership (WRAP) West-wide Jump-start Air Quality Modeling Study (WestJumpAQMS). Final report prepared for the Western Regional Air Partnership by ENVIRON International Corporation, Novato, CA, September 2013.
- Farooqui, Z.M., J. Kuruvilla, J. Biswas, and N. Sule. 2013. Modeling analysis of the impact of anthropogenic emission sources on ozone concentration over selected urban areas in Texas. Atmos. Pollut. Res. 4:33–42. doi:10.5094/APR.2013.004
- Gilliam, R. 2010. Evaluation of multi-annual CONUS 12 km WRF simulations. http://epa.gov/scram001/adhoc/gilliam2010.pdf ( accessed May 2014).
- Otte, T.L., and J.E., Pleim. 2010: The Meteorology-Chemistry Interface Processor (MCIP) for the CMAQ modeling system: Updates through MCIPv3.4.1, Geosci. Model Dev. 3:243–256. doi:10.5194/gmd-3-243-2010
- U.S. Environmental Protection Agency. 2007. Guidance on the Use of Models and Other Analyses for Demonstrating Attainment of Air Quality Goals for Ozone, PM2.5 and Regional Haze. EPA-454/B-07-002. Research Triangle Park, NC: U.S. Environmental Protection Agency, April 2007.
- Vijayaraghavan, K., G. Yarwood, C. Lindhjem, A. DenBleyker, U. Nopmongcol, J. Grant, E. Tai, T. Sakulyanontvittaya, and J. Johnson, 2012. Estimating the effect of past, present and potential future emission standards for light duty gasoline vehicles on ozone and fine particulate matter in the eastern United States. Atmos. Environ. 60:109–120, doi:10.1016/j.atmosenv.2012.05.049
- Yarwood, G., R.E. Morris, M.A. Yocke, H. Hogo, and T. Chico. 1996. Development of a methodology for source apportionment of ozone concentration estimates from a photochemical grid model. Presented at the 89th AWMA Annual Meeting, Nashville TN, June 23–28.
- Zhang, L., J.R. Brook, and R. Vet. 2003. A revised parameterization for gaseous dry deposition in air quality models. Atmos. Chem. Phys. 3:2067–2082. doi:10.5194/acp-3-2067-2003
- Zhang, L., S. Gong, J. Padro, and L. Barrie. 2001. A size-segregated particle dry deposition scheme for an atmospheric aerosol module. Atmos. Environ. 35:549–560. doi:10.1016/S1352-2310(00)00326-5