
Abstract
Nitrous oxide (N2O) is the third most important greenhouse gas after carbon dioxide and methane, and contributes about 6% to the greenhouse effect. Nitrous oxide is a minor component of the atmosphere, and it is a thousand times less than carbon dioxide (CO2). Nevertheless, it is much more potent than CO2 and methane, owing to its long stay in the atmosphere of approximately 120 yr and the high global warming potential (GWP) of 298 times that of CO2. Although greenhouse gases are natural in the atmosphere, human activities have changed the atmospheric concentrations. Most of the values of emission of nitrous oxide are still obtained by means of emission factors and not actually measured; the lack of real data may result in an underestimation of current emissions. The emission factors used for the calculation of N2O can be obtained from the “Guidelines for the implementation of the national inventory of emissions” of the Intergovernmental Panel on Climate Change, which refer to all nations for the realization of their inventory. This study will present real data, measured in several Italian cement plants with different characteristics. The work also shows a comparison between N2O concentration measured with in situ Fourier transform IR (FTIR) and the reference method EN ISO 21258 based on nondispersive IR (NDIR), in order to investigate the interfering compounds in the measurement with NDIR.
Implications:
N2O may arise as an unwanted by-product of nitrogen oxide (NOx) abatement systems, in particular selective noncatalytic reduction (SNCR). Since it is applied in the cement plants, N2O emission from cement industry is evaluated, with both FTIR and NDIR instrument. Several considerations emerged from the results. First of all, the emission from this industrial sector is not negligible, and for that reason N2O concentration should be regulated; another observation is that the reference method based on the NDIR technique is not as selective as FTIR could be.
Introduction
The major greenhouse gases (GHGs) emitted into the atmosphere through human activities are carbon dioxide (CO2), methane, nitrous oxide (N2O), and fluorinated gases. Some of these gases are produced almost entirely by human activities; others come from a combination of natural sources and human activities. The industrial sector is an important direct and indirect source of GHG emissions; GHGs are produced from a variety of industrial activities that are related not only to energy. The main emission sources are industrial production processes that are involved in chemical or physical transformation of materials. Many of the major greenhouse gases can remain in the atmosphere for tens to hundreds of years after being released. They become globally mixed in the lower atmosphere, reflecting contributions from emission sources worldwide. Several factors determine how strongly a particular greenhouse gas will affect the earth’s climate. One factor is the length of time that the gas remains in the atmosphere. A second factor is each gas’ unique ability to absorb energy. To compare GHG emissions from different sources, they are indexed according to their global warming potential (GWP), i.e., the ability of a GHG to trap heat in the atmosphere relative to an equal amount of carbon dioxide. According to the Intergovernmental Panel on Climate Change (IPCC) (Citation2007), over a 100-yr time span carbon dioxide (CO2) assumes the value of 1. The two other GHGs of importance in this analysis are methane (CH4) and nitrous oxide (N2O), which, according to a reevaluation of the IPCC in 2001, take a value of 25 and 298, respectively. From a legislative point of view, the first regulations on non-CO2 GHGs are emerging in Europe. During the review of permits for large emitters under the European Union’s (EU’s) Integrated Pollution Prevention and Control (IPPC) Directive (96/61/EC), a number of facilities have been required to implement the best available control technologies for N2O and fluorinated gases (Wartmann et al., Citation2006). The European Pollutant Emission Register (EPER) includes 50 pollutants, and for each of them threshold values are defined (i.e., 10,000 kg yr−1 in air for N2O). If emissions exceed threshold values at specific facilities, such emissions must be reported. Facilities with lower emissions are not included (EU, Citation2000). The European Pollutant Release and Transfer Register (E-PRTR) is the successor to EPER. It is a Web-based register established by Regulation 2006/166/EC, which implements the United Nations Economic Commission for Europe (UNECE) PRTR Protocol, signed in May 2003 in Kiev.
Nitrous oxide (N2O)
At present, non-CO2 GHGs make up for around 18% of total GHG emissions in the EU-25; among these, CH4 and N2O clearly dominate, with 92% of total emissions (Wartmann et al., Citation2006). Nitrous oxide (N2O) plays an important role as a GHG and is involved in the depletion of the ozone layer in the atmosphere (Pearman et al., Citation1986; Ravishankara et al., Citation2009). In the last century, the anthropogenic sources of N2O increased by a factor 2, and, consequently, the concentration in the atmosphere increased from 285 in 1900 to 330 ppbv in 2010, at a rate of 0.2–0.3% per year. The fourth assessment report of the IPCC (IPCC, Citation2007) estimated N2O emissions from both natural and anthropogenic sources at 8.5–27.7 Tg N2O-N yr−1. In this regard, there are several studies on methods and models for the estimation of the emission of N2O from different sources (Osada et al., Citation1995; Olivier et al., Citation1998; Seitginzer et al., Citation2000; Brown et al., Citation2002; Tsai et al., Citation2006; Wang et al., Citation2011; Nol et al., Citation2012; Desloover et al., Citation2012). The worldwide increase is generally considered to be caused solely by the anthropogenic sources. Agricultural soils, manure management, and fuel combustion activities are difficult to monitor due to their high uncertainty in emission determination, or their large numbers of small emitters. Wastewater handling also are difficult to monitor, as emissions from the various sources (digester, lagoon, reactor, etc.) varying also in size can be monitored and verified only with difficulty due to a lack of data and high uncertainty. Only the production of adipic and nitric acid are easy to monitor and shows a high enforcement and relevance. Another minor (but not negligible) source is vehicular traffic: it is well established that vehicle exhaust contains N2O. Furthermore, it is widely accepted that new vehicles equipped with three-way catalysts generally emit more N2O than older vehicles without catalysts (Becker et al., Citation1999). With regard to climate change, the emissions of N2O from light-duty vehicles have impacts that are approximately 1–3% of that of CO2 emissions from vehicles (Lipman and Delucchi, Citation2002; Wallington et al., Citation2008). The numerous sources and sinks are categorized and grouped into major sectors (IPCC, Citation2006). The sector “Energy” comprises total emission of all greenhouse gases from stationary and mobile energy activities (fuel combustion as well as fugitive fuel emissions). The Emissions Database for Global Atmospheric Research (EDGAR) provides global past and present-day anthropogenic GHG emissions and air pollutants by country and on spatial grid (Joint Research Centre/Netherlands Environmental Assessment Agency [JRC/PBL], Citation2012). shows an overview of contributions of each IPCC sector, referring to USA, Organisation for Economic Co-operation and Development (OECD) Europe, and China, expressed in Gg yr−1. Detailed data are presented in Supplementary Material. USA and EU countries show a relevant decrease in almost all sectors; on the contrary, China shows a great increment in the emission of N2O.
Table 1. Contribution of IPCC sectors anthropogenic emissions of N2O in Gg yr−1 in USA, OECD Europe, and China, subdivided by IPCC sectors (from EDGAR database, JRC/PBL, Citation2012)
Another not negligible indirect source of anthropogenic N2O from emissive systems is the uncontrolled reduction of nitrogen oxides (NOx) by applying abatement systems listed by the legislation in order to have the emission of a nonpollutant gas such as N2. There are various ways to control and reduce NOx emissions from anthropogenic sources in order to meet the legislation; the two broad categories are (i) combustion modifications (i.e., temperature reduction, reduction of nitrogen in fuels, creation of a combustion environment that restrains NOx formation) (Pershing and Wendt, Citation1977; Siddiqi and Tenini, Citation1981; Benitez, Citation1992; Perry and Green, Citation1997); and (ii) flue gas treatment. Although a significant reduction of NOx can be achieved by means of combustion modifications, generally up to 50% as the sum of different measures, this alone is often insufficient to comply with the stringent emission standards and/or cannot be applied in existing combustors. Additional abatement is required and is therefore achieved by the use of end-of-pipe flue gas treatment technologies.
Selective catalytic reduction (SCR)
It is the most advanced and effective method for reducing NOx emissions and can do so by up to 80–90%. SCR entails the reaction of NOx with NH3 within a heterogeneous catalytic bed in the presence of O2 at temperatures normally in the range of 250–400 °C (Radojevic, Citation1998). The formation of N2O on precious-metal catalysts has been well documented in previous studies of NOx reduction technologies. Madia et al. (Citation2002) observed that in urea SCR systems, N2O production is likely if the NO2/NO ratio is too high. In this case, the standard SCR reaction thermodynamically favors production of N2O from NO2 over the complete reduction to N2.
Selective noncatalytic reduction (SNCR)
It is a simple process, referred to as “thermal DeNOx,” and involves the reduction of NOx to N2 in the presence of oxygen by reaction with amine-based reagents (NH2-X) (Lucas and Brown, Citation1982; Lyon, Citation1987; Bowman, Citation1992; Rother, Citation1996; Muzio and Quartucy, Citation1997). The most common NH2-X agent is ammonia water of about 25% NH3 (Cembureau Working Group, Citation1999). The reaction has an optimum in a temperature window of about 800–1000 °C, and sufficient retention time must be provided for the injected agents to react with NO. Hwang et al. (Citation2009) underlined the importance of maintaining the temperature range: below this level, unconverted ammonia is emitted (so-called “NH3 slip”) and at significant higher temperatures the ammonia is oxidized to NOx. Emissions of carbon monoxide (CO) and nitrous oxide (N2O) may also occur (Kupper and Brentrup, Citation1992). There are opposing studies in the literature about the roles of these last two gases in the N2O formation/reduction: some laboratory studies show how at low temperature they could be the cause of N2O emissions (de Soete, Citation1993; Kramlich and Linak, Citation1994), but other field studies demonstrated their efficiency as reduction system (Takeshita et al., Citation1993). SNCR is better suited for applications with high levels of particulate matter in the waste gas stream than SCR, and it is applied in the cement industry.
Case study: The cement industry
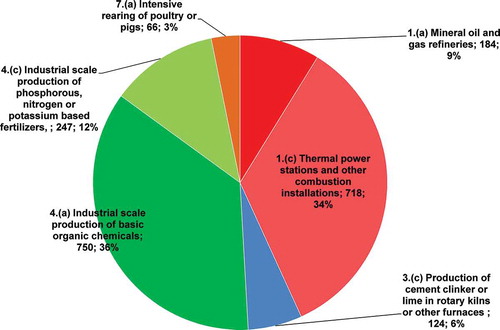
Emission inventories and release contribution estimates for the cement industry are usually based on two types of information, earlier literature data or real measurements, providing considerably different results. Atmospheric emissions from an industry could be evaluated only through the in situ verify of the limits listed in the specific legislation or, with a more integrated method, considering also the functional relations with the principal productive, management, and process aspects. E-PRTR (Citation2011) reports the N2O releases in air, expressed in tons in 2011 in Italy, from 38 facilities, belonging to different IPCC sectors, as shown in . Among these, the most important releases are from Sector 4—Chemical industry and Sector 1—Energy: 48% and 43%, respectively. Production of cement (subactivity of Sector 3—Mineral industry) is not a negligible sector, as it contributes 6% of the total releases with seven facilities, and it is comparable to mineral oil and gas refineries (9% with five facilities).
Figure 1. N2O releases in air (t yr−1) in 2011 in Italy, and contribution (%) of each subactivity of IPCC sectors: 1 = Energy sector; 3 = Mineral industry; 4 = Chemical industry; 7 = Intensive livestock production and aquaculture. Data from E-PRTR.
The cement industry is today distributed throughout the world, and global 2012 cement production is estimated at 3.6 billion tonnes, translating into a +3% increase compared with 2011 (Boston Consulting Group [BCG], Citation2012). On average, approximately 1 ton of concrete is produced each year for every human being in the world. Therefore, concrete (i.e., cement) is one of the world’s most significant manufactured materials. Because of its abundance in the world market, understanding the environmental implications of concrete and cement manufacturing is becoming increasingly important (van Oss and Padovani, Citation2002, Citation2003; Lippiat and Ahmad, Citation2004). The clinker burning process is the most important part of the process in terms of the key environmental issues for cement manufacture: energy use and emissions to air (NOx, SO2, and dust). The best available techniques (BAT) for reducing NOx emissions are a combination of general primary measures, staged combustion, and selective noncatalytic reduction (SNCR).
Aim of the work
The aim of the work was to evaluate the contribution of cement plant to air emission of N2O. In particular, data from eight Italian facilities were analyzed, in respect to each plant’s characteristic and installed abatement systems. The knowledge of real concentrations and flow rate of each plant made also possible an estimate of N2O emission to the Greenhouse effect.
In addition, the effect of the different measuring principles of the N2O analyzer concerning the results will be found with comparison measurements. In spot measurements, the reference nondispersive infrared (NDIR) technique will be measured in parallel with the in situ Fourier transform infrared (FTIR) technique.
Experimental Section
Cement plants
Air emission data from eight Italian cement plants were investigated. Data were gathered from the automatic flue gas monitoring system of each plant, installed both at the stack and at the boiler exit. Since the production of clinker (pyroprocessing step) is the most energy- and emission-intensive process in the manufacturing of cement, accounting for more than 80–85% of the overall environmental impact score (Hutzinger and Eatmon, Citation2009), data refer to the clinker burning emission point. The lines of the clinker burning adopt the latest best available techniques (BAT) for the sector. In particular, they consist of dry process rotary kilns with preheaters and multistage precalcinators. Within the preheater and kiln systems, particulate control devices are used to capture fine particulates of unburned and partially burned raw material that become entrained in the combustion gases (i.e., baghouse filters [BH], electrostatic precipitators [ESPs], and hybrid filters, in which ESP is combined in series to a BH). The lines of the clinker burning are also equipped with abatement systems for NOx, using the technique of SNCR with ammonia or urea as a reducing agent, and multistage combustion. In addition, in some plants the use of conventional fuels (petroleum coke) is combined with the use of the refuse-derived fuel (RDF). shows the characteristics of the facilities analyzed in this work.
Table 2. Characteristics of the cement plants analyzed
Flue gas analysis
The concentration of gaseous pollutants in the flue gas as well as plant characteristics were continuously measured by online instruments and data were provided by the manager of each plant. Concentration of NOx, N2O, CO, CO2, H2O, and NH3 were measured by a multicomponent analyzer using Fourier transform infrared (FTIR) spectrometer (measuring range: 0–100 mg Nm−3 and limit of detection [LOD]: 0.25 mg Nm−3 for N2O); O2 was measured by a zirconium oxide detector. Data (measured every minute by FTIR) were collected in 24 hr for each week of the year and presented as annual arithmetic average. The reference standard method for the measurement of N2O, ISO 21258 (2010), is based on nondispersive infrared (NDIR) instrument. A dual-beam-type NDIR analyzer (measuring range: 0–150 mg Nm−3 and LOD: 0.20 mg Nm−3 for N2O) was used in parallel spot measurements versus FTIR. All measured values related to dry gas under standard conditions: temperature 273 K, pressure 101.3 kPa, and oxygen content of 10%.
Results and Discussions
N2O emissions
shows the average concentration of punctual measurements of N2O, NOx, CO (expressed in mg Nm−3) and of CO2 (expressed in % v/v) on a monthly basis, collected by inline instruments installed on plants. In addition, NOx/N2O ratio is calculated (expressed in %).
Table 3. Average concentration of punctual measurements of N2O, NOx, CO, and CO2 on a monthly basis, collected by inline instruments installed on plants, and NOx/N2O ratio
It is interesting to observe that plants A and B emit the higher concentrations of NOx among all the facilities concerned. They have the same abatement systems (ESP for dust and SNCR with ammonia solution for NOx), and they both use RDF as an additional fuel. The replacement of the traditional fuel (petcoke) with RDF could be the cause of the higher emissions of NOx and, as a consequence, of N2O. From a detailed analysis of fuel data and N2O concentrations of the plants, however, no correlation has been found.
The concentration of N2O is around 1% of the emission of NOx () for the investigated plants. Since N2O is an unwanted by-product of de-NOx technology, unreacted ammonia could be found at stack emissions (Kupper and Brentrup, Citation1992). Concentrations of both gases (N2O and NH3) were analyzed for each plant. shows the profiles of N2O and NH3 for plants with the highest N2O/NOx ratios.
Figure 2. Profiles of N2O and NH3 (mg Nm−3) for plants with highest N2O/NOx ratio. (a) profile of plant E; (b) profile of plant F.
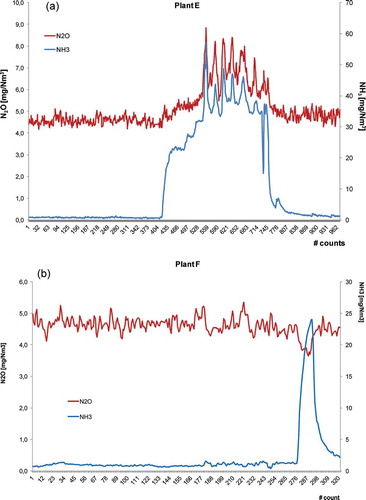
The difference in the trend stands out from . In both cases, there is a high “ammonia slip,” but in the first case (plant E) there is a simultaneous increase of N2O concentration. It could be explained considering that plant E is equipped with ammonia-based SNCR and plant F with urea-based SNCR, and the peak of NH3 at the stack can be explained as unreacted ammonia, added as a surplus.
Greenhouse effect gases
CO2 is the most important greenhouse gas emitted from cement industry. N2O, however, should not be underestimated as a greenhouse effect gas, as its GWP is 298 (IPCC, Citation2007). An easy way to evaluate the contribution to greenhouse effect is to consider the average emission rate of N2O from a cement plant. In this work, we analyzed data from eight Italian facilities, about one tenth of the Italian cement industry; by multiplying the average concentration of N2O (5 mg Nm−3) and the average flow rate (320,000 Nm3 hr−1), the emission rate of N2O is about 1.6 kg hr−1.
If we consider that the European Union (EU) cement industry consists of some 250 plants and 86 of these are in Italy (34%) (Wagner and Vassilopoulos, Citation2000), the importance of the control of the emission of N2O from cement plant is an issue to be considered by policy makers.
FTIR versus NDIR
Simultaneous measurements were made in three sampling campaigns at the eight cement plants under examination, in order to evaluate data from both in situ system (FTIR) and reference methods (NDIR). Data (measured every minute by each instrument) were collected in 8 hr for each sampling campaign and presented as annual arithmetic average. The international reference method for sampling and determination of N2O content in flue gas, ISO 21258 (2000), and the United Nations Framework Convention on Climate Change Clean Development Mechanism (UNFCCC CDM) methodology (Citation2010) specify the use of NDIR technique. However, the literature data suggest that grab samples containing NO, SO2, and condensed H2O produce N2O as an artifact (Muzio and Kramlich, Citation1988; Montgomery et al., Citation1989; Muzio et al., Citation1989). As a result, the N2O levels reported may be higher than the levels actually produced directly by combustion systems. N2O has strong infrared absorbances at 4.5, 7.8, and 17.0 μm, from which the main band of 4.5 μm is commonly being used in the NDIR analyzers. In this region, other oxides of nitrogen (NO, NO2) have no significant cross-interferences, but water vapor, carbon dioxide, and carbon monoxide have an effect on the N2O measurement. They have infrared absorbances in the same region as N2O; thus, they have an overlap with the N2O absorbance, as reported by Bruce (Citation1999).
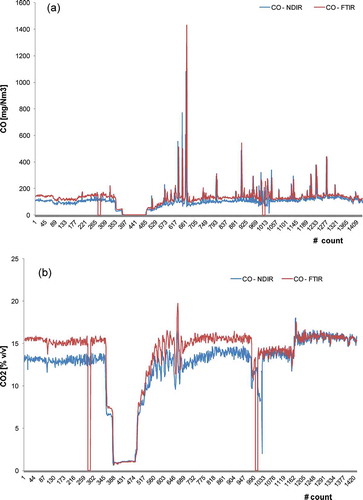
First of all, in accordance with the Italian Legislative Decree 152 (2006), a “Relative Accuracy Index” (Iar) for N2O and for the most interfering compounds (CO and CO2) was calculated. Data are presented in , together with mean, minimum, and maximum concentrations of these species analyzed with both systems.
In almost all the sampling campaigns, the Iar for CO and CO2 was >80%, meaning a good accordance between the two systems. As an example, shows these good accordance even with a high variability of the concentration of the gases.
Table 4. Mean, minimum, and maximum concentrations of CO, CO2, and N2O obtained with NDIR and FTIR techniques and relative accuracy index (Iar)
Figure 3. Profiles of (a) CO (mg Nm−3) and (b) CO2 (% v/v) obtained in a simultaneous sampling campaign with FTIR- and NDIR-based instruments in plant G.
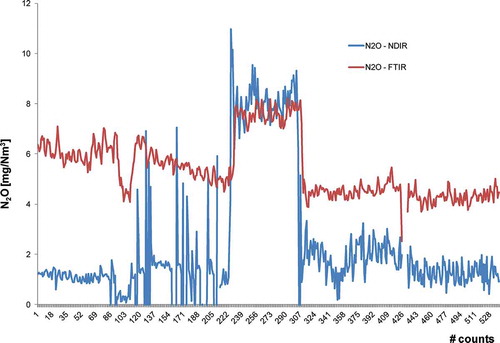
As for N2O, the Iar gave poor results (<50%), meaning that the two measurement systems cannot be equivalent. In and , two particular cases are reported. shows the profiles of N2O concentrations measured in plant G. It can be seen a good accordance as for the trend, but the concentration measured with NDIR is 7 times higher than that measured with FTIR.
Figure 4. Profiles of N2O (mg Nm−3) obtained in a simultaneous sampling campaign in plant G with FTIR- and NDIR-based instruments: good accordance in trend.
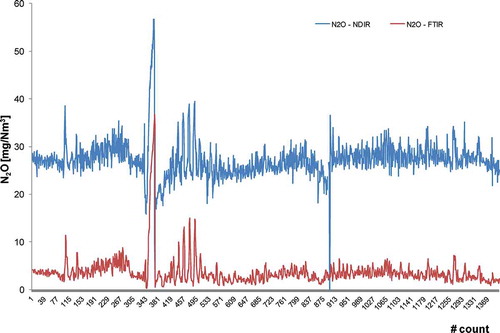
Figure 5. Profiles of N2O (mg Nm−3) obtained in a simultaneous sampling campaign in plant C with FTIR- and NDIR-based instruments.
shows the profiles of N2O concentrations measured in plant B. A different behavior can be observed: NDIR and FTIR are in good accordance as for the measured concentration when it is higher. It could be due to a reduced selectivity at low concentrations.
The two different analyzers are designed to avoid the interference problem on the N2O measurement due to the overlap or the IR absorption spectra of the other gases. The NDIR system introduces an additive and multiplicative compensation on the result of the measure of the single gas, eliminating the contribution associated with the presence of other interfering component such as CO, CO2, and H2O, in the case of N2O. The FTIR system, on the other hand, create an integrated combination of all the IR absorption spectra of the gases in the emission and, after that, eliminates the contribution of the interfering components, using the IR reference spectrum obtained during the calibration of the instrument. The NDIR analyzer seems to be more affected by the presence of interferences than the FTIR analyzer. This could be due to the lack of a very selective optic and detecting system.
Conclusion
The limited number of results available at present supports almost a preliminary evaluation of the importance of accurate N2O measurements in flue gas. In this regard, the Technical Committee ISO/TC 146, Air quality, Subcommittee SC 1, Stationary source emissions, is preparing a standard about quality assurance procedures for calibration and ongoing quality control needed to assure that automated measurement systems (AMS), installed to measure emissions of greenhouse gases to air. It means that measurement of greenhouse gas emissions (carbon dioxide, nitrous oxide, methane) in a framework of emission trading is important and requires an equal and known quality of data. Some significant results emerged from this preliminary work. First of all, the contribution of cement plant to global N2O emission (and to greenhouse gas effect) should not be neglected, in consideration of the number of cement industries present and their flow rate. Another important aspect that emerged from the analysis of data is the different unwanted production of N2O from urea- and NH3-based SNCR systems. Lastly, the reference method based on NDIR is highly affected by interfering compounds. It is important to underline that the reference method ISO 20258 has been tested on an industrial plant where the N2O concentration in the flue gas was up to about 200 mg Nm−3. In the cement plants investigated, however, the average concentration was 5 mg Nm−3. This strengthen previous considerations on lack of selectivity in NDIR techniques. The further reduction of NOx to values below 100 mg Nm−3, if done with the described technique (SNCR), can lead to significant levels of N2O. Apart from highlighting the presence of N2O from industrial sources (i.e., E-PRTR), there should be the need to understand if, at international level, a specific emission limit for N2O, or the inclusion of this gas to the total NOx (= NO + NO2 + N2O), should be established. In light of the above considerations, NOx and N2O should be put onto the scale: what is more advisable? The continuous reduction of NOx, a pollutant that has local implications, from industrial plants; with the improvement of abatement systems, which can cause the formation of N2O; or the control (even in a legal aspect) of N2O emissions, a pollutant that undergoes climate changing, sacrificing the reduction of NOx?
Supplemental Material
Supplemental data for this article can be accessed on the publisher’s website.
Supplemental_Material.pdf
Download PDF (90.1 KB)Additional information
Notes on contributors
Silvia Mosca
Mauro Rotatori is first researcher, Silvia Mosca and Ettore Guerriero are researchers, and Paolo Benedetti is associate researcher at CNR-IIA.
Paolo Benedetti
Mauro Rotatori is first researcher, Silvia Mosca and Ettore Guerriero are researchers, and Paolo Benedetti is associate researcher at CNR-IIA.
Ettore Guerriero
Mauro Rotatori is first researcher, Silvia Mosca and Ettore Guerriero are researchers, and Paolo Benedetti is associate researcher at CNR-IIA.
Mauro Rotatori
Mauro Rotatori is first researcher, Silvia Mosca and Ettore Guerriero are researchers, and Paolo Benedetti is associate researcher at CNR-IIA.
References
- Becker, K.H., J.C. Lörzer, R. Kurtenbach, P. Wiesen, T.E. Jensen, and T.J. Wallington. 1999. Nitrous oxide (N2O) emissions from vehicles. Environ. Sci. Technol. 33:4134–4139. doi:10.1021/es9903330
- Benitez, J. 1992. Process Engineering and Design for Air Pollution Control. Upper Saddle River, NJ: Prentice Hall.
- Boston Consulting Group. 2012. Cembureau 2012 Activity Report—The Cement Sector: A Strategic Contributor to Europe’s Future, Report D/2013/5457/May. Brussels, Belgium: CEMBUREAU The European Cement Association.http://www.cembureau.eu/sites/default/files/category_pictures/AR2012.pdf.
- Bowman, C.T. 1992. Control of combustion-generated nitrogen oxide emissions: Technology driven by regulation. Symp. Int. Combust. 24:859–878. doi:10.1016/S0082-0784(06)80104-9
- Brown, L., B. Syed, S.C. Jarvis, R.W. Sneath, V.R. Phillips, K.W.T. Goulding, and C. Li. 2002. Development and application of a mechanistic model to estimate emission of nitrous oxide from UK agriculture. Atmos. Environ. 36:917–928. doi:10.1016/S1352-2310(01)00512-X
- Bruce, S.H. 1999. The Big Three—On-line monitoring of greenhouse gases. In Proceedings of the International Conference on Emission Monitoring, The University of Warwick, Coventry, UK, September 6–8. London: IEA Coal Research, The Clean Coal Centre.
- Cembureau Working Group. 1999. Best available techniques for the cement industry. A contribution from the European Cement Industry to the exchange of information and preparation of the IPPC BAT Reference Document for the cement industry. http://www.ztch.umcs.lublin.pl/materialy/batcement.pdf ( accessed September 19, 2014).
- de Soete, G. 1993. Nitrous oxide from combustion and industry: Chemistry, emissions and control. In Proceedings of an International IPCC Workshop on Methane and Nitrous Oxide: Methods in National Emissions Inventories and Options for Control, ed. A.R. van Amstel, RIVM Report No. 481507003. Bilthoven, The Netherlands: National Institute for Public Health and Environmental Protection.
- Desloover, J., S.E. Vlaeminck, P. Clauwaert, W. Verstraete, and N. Boon. 2012. Strategies to mitigate N2O emissions from biological nitrogen removal systems. Curr. Opin. Biotechnol. 23:474–482. doi:10.1016/j.copbio.2011.12.030
- European Union. 2000. Commission decision 2000/479/EC of 17 July 2000 on the implementation of a European Pollutant Emission Register (EPER) according to Article 15 of Council Directive 96/61/EC concerning integrated pollution prevention and control (IPPC). Brussels: European Commission.
- European Pollutant Release and Transfer Register. 2011. http://prtr.ec.europa.eu/PollutantReleases.aspx ( accessed December 16, 2013).
- Hutzinger, D.H., and T.D. Eatmon. 2009. A life-cycle assessment of Portland cement manufacturing: Comparing the traditional process with alternative technologies. J. Clean. Prod. 17:668–675.
- Hwang, I.-H., H. Minoya, T. Matsuto, T. Matsuo, A. Matsumoto, and R. Sameshima. 2009. Removal of ammonium chloride generated by ammonia slip from the SNCR process in municipal solid waste incinerators. Chemosphere 74:1379–1384. doi:10.1016/j.chemosphere.2008.11.008
- Intergovernmental Panel on Climate Change. 2006. 2006 IPCC Guidelines for National Greenhouse Gas Inventories, Vol. 2. Energy, eds. H.S. Eggleston, L. Buendia, K. Miwa, T. Ngara, and K. Tanabe. Hayama, Japan: National Greenhouse Gas Inventories Programme, IGES, Japan.
- Intergovernmental Panel on Climate Change. 2007. Fourth assessment report: Climate change 2007. In Contribution of Working Group I to the Fourth Assessment Report of the Intergovernmental Panel on Climate Change, ed. S. Solomon, D. Qin, M. Manning, Z. Chen, M. Marquis, K.B. Averyt, M. Tignor, and H.L. Miller, 30–35. Cambridge, UK: Cambridge University Press.
- International Organization for Standardization (ISO). 2010. ISO 21258:2010. Stationary source emissions—Determination of the mass concentration of dinitrogen monoxide (N2O)—Reference method: Non-dispersive infrared method. http://www.iso.org/iso/catalogue_detail.htm?csnumber=40113 (accessed October 12, 2013).
- Italian Legislative Decree 152/06. 2006. Environmental Regulations—Part V—Rules on air protection and reduction of atmospheric emissions—Annex VI—Criteria for assessment of conformity of measured values with emission limit values [in Italian].
- Joint Research Centre/Netherlands Environmental Assessment Agency (JRC/PBL). 2012. EDGAR version 4.2 FT2010. http://edgar.jrc.ec.europa.eu/ ( accessed December 17, 2013).
- Kramlich, J., and W. Linak. 1994. Nitrous oxide behaviour in the atmosphere and in combustion and industrial systems. Prog. Energy Combust. 20:149–202. doi:10.1016/0360-1285(94)90009-4
- Kupper, D., and L. Brentrup. 1992. SNCR technology for NOx reduction in the cement industry. World Cement 103:4–8.
- Lipman, T.E., and M.A. Delucchi. 2002. Emissions of nitrous oxide and methane from conventional and alternative fuel motor vehicles. Climatic Change 53:477–516. doi:10.1023/A:1015235211266
- Lippiatt, B., and S. Ahmad. 2004. Measuring the life-cycle environmental and economic performance of concrete: The BEES approach. In Proceedings of the International Workshop on Sustainable Development and Concrete Technology, Beijing, China, May 20–21, 213–219. Ames, IA: Iowa State University.
- Lucas, D., and N.J. Brown. 1982. Characterization of the selective reduction of NO by NH3. Combust. Flame 47:219–234. doi:10.1016/0010-2180(82)90103-1
- Lyon, R.K., 1987. Thermal DeNOx. Environ. Sci. Technol. 21:231–236. doi:10.1021/es00157a002
- Madia, G., M. Koebel, M. Elsener, and A. Wokaun. 2002. Side reactions in the selective catalytic reduction of NOx with various NO2 fractions. J. Ind. Eng. Chem. 41:4008–4015. doi:10.1021/ie020054c
- Montgomery, T.A., G.S. Samuelsen, and L.J. Muzio. 1989. Continuous infrared analysis of N2O in combustion products. JAPCA 39:721–726. doi:10.1080/08940630.1989.10466559
- Muzio, L.J., and J.C. Kramlich. 1988. An artifact in the measurement of N2O from combustion sources. Geophys. Res. Lett. 15:1369–1372. doi:10.1029/GL015i012p01369
- Muzio, L.J., and G.C. Quartucy. 1997. Implementing NOx control: Research to application. Prog. Energy Combust. Sci. 23:233–266. doi:10.1016/S0360-1285(97)00002-6
- Muzio, L.J., M.E. Teague, J.C. Kramlich, J.A. Cole, J.M. McCarthy, and R.K. Lyon. 1989. Errors in grab sample measurements of N2O from combustion sources. JAPCA 39:287–293. doi:10.1080/08940630.1989.10466528
- Nol, L., P.H. Verburg, and E.J. Moors. 2012. Trends in future N2O emissions due to land use change. J. Environ. Manage. 94:78–90. doi:10.1016/j.jenvman.2011.06.053
- Olivier, J.G.J., A.F. Bouwman, K.W. Van der Hoek, J.J.M. Berdowski, 1998. Global air emission inventories for anthropogenic sources of NOx, NH3 and N2O in 1990. Environ. Pollut. 102:135–148. doi:10.1016/S0269-7491(98)80026-2
- Osada, T., K. Kuroda, and M. Yonaga. 1995. Reducing nitrous oxide gas emission from fill-and-draw type activated sludge process. Water Res. 29:1607–1608. doi:10.1016/0043-1354(94)00246-4
- Pearman, G.I., D. Etheridge, F. Desilva, and P.J. Fraser. 1986. Evidence of changing concentrations of atmospheric CO2, N2O and CH4 from air bubbles in Antarctic ice. Nature 320:248–250. doi:10.1038/320248a0
- Perry, R.H., and D.W. Green, 1997. Perry’s Chemical Engineering Handbook, 7th ed. New York: McGraw Hill Professional.
- Pershing, D.W., and J.O.L. Wendt. 1977. Pulverized coal combustion: The influence of flame temperature and coal composition on thermal and fuel NOx. Combust. Sci. Technol. 16:111–121. doi:10.1016/S0082-0784(77)80339-1
- Radojevic, M. 1998. Reduction of nitrogen oxides in flue gases. Environ. Pollut. 102:685–689. doi:10.1016/S0269-7491(98)80099-7
- Ravishankara, A.R., J.S. Daniel, and R.W. Portmann. 2009. Nitrous oxide (N2O): The dominant ozone-depleting substance emitted in the 21st century. Science 326:123–125. doi:10.1126/science.1176985
- Rother, W. 1996. Exhaust gas emissions. Available control technology for gaseous emissions in cement plants. Int. Cement Rev. 1:39–43.
- Seitzinger, S.P., C. Kroeze, and R.V. Styles. 2000. Global distribution of N2O emissions from aquatic systems: Natural emissions and anthropogenic effects. Chemosphere 2:267–279. doi:10.1016/S1465-9972(00)00015-5
- Siddiqi, A.A., and J.W. Tenini, 1981. NOx controls in review. Hydrocarb. Process. 60:115–124.
- Takeshita, M., L. Sloss, and I. Smith. 1993. N2O Emissions from Coal Use, Vol. 6 of Perspectives. London: IEA Coal Research.
- Tsai, W.-T., and J.-M. Chyan. 2006. Estimation and projection of nitrous oxide (N2O) emissions from anthropogenic sources in Taiwan. Chemosphere 63:22–30. doi:10.1016/j.chemosphere.2005.07.071
- United Nations Framework Convention on Climate Change Clean Development Mechanism (UNFCCC CDM). 2010. AM0034: Catalytic reduction of N2O inside the ammonia burner of nitric acid plants, version 5.1.1. http://cdm.unfccc.int/methodologies/DB/993RRDBB2WJI9TAD2XCKPK5YATQXY6 ( accessed January 13, 2014).
- van Oss, H.G., and A.C. Padovani. 2002. Cement manufacture and the environment, Part I: Chemistry and technology. J. Ind. Ecol. 6:89–105. doi:10.1162/108819802320971650
- van Oss, H.G., and A.C. Padovani. 2003. Cement manufacture and the environment, Part II: Environmental challenges and opportunities. J. Ind. Ecol. 7: 93–125. doi:10.1162/108819803766729212
- Wagner, K., and M. Vassilopoulos. 2000. The European cement industry background assessment for the IPTS BAT-Competitiveness Project. http://ftp.jrc.es/EURdoc/AppendixC1.pdf ( accessed January 13, 2014).
- Wallington, T.J., J.L. Sullivan, and M.D. Hurley, 2008. Emissions of CO2, CO, NOx, HC, PM, HFC-134a, N2O and CH4 from the global light duty vehicle fleet. Meteorol. Z. 17:109–116. doi:10.1127/0941-2948/2008/0275
- Wang, J., L.M. Cardenas, T.H. Misselbrook, and S. Gilhespy. 2011. Development and application of a detailed inventory framework for estimating nitrous oxide and methane emissions from agriculture. Atmos. Environ. 45:1454–1463. doi:10.1016/j.atmosenv.2010.12.014
- Wartmann, S., J. Harnisch, D. Phylipsen, and A. Gilbert, 2006. Inclusion of additional activities and gases into the EU-emissions trading scheme. Ecofys. http://ec.europa.eu/clima/policies/ets/docs/ecofys_review_en.pdf ( accessed January 20, 2014).