
Abstract
PM2.5 (particulate matter with an aerodynamic diameter <2.5 μm) samples (n = 58) collected every sixth day in Xi’an, China, from 5 July 2008 to 27 June 2009 are analyzed for levoglucosan (1,6-anhydro-β-d-glucopyranose) to evaluate the impacts of biomass combustion on ambient concentrations. Twenty-four-hour levoglucosan concentrations displayed clear summer minima and winter maxima that ranged from 46 to 1889 ng m−3, with an average of 428 ± 399 ng m−3. Besides agricultural burning, biomass/biofuel combustion for household heating with straws and branches appears to be of regional importance during the heating season in northwestern China. Good correlations (0.70 < R < 0.91) were found between levoglucosan relative to water-soluble K+, Cl−, organic carbon (OC), elemental carbon (EC), and glyoxal. The highest levoglucosan/OC ratio of 2.3% was found in winter, followed by autumn (1.5%). Biomass burning contributed to 5.1–43.8% of OC (with an average of 17.6 ± 8.4%).
Implications: PM2.5 levoglucosan concentrations and the correlation between levoglucosan relative to other compounds during four seasons in Xi’an showed that the influence of biomass burning is maximum during the residential heating season (winter), although some important influences may be detected in spring (field preparation burnings) and autumn (corn stalks and wheat straw burning, fallen dead leaves burning) at Xi’an and surrounding areas. Household heating with biomass during winter was quite widespread in Guanzhong Plain. Therefore, the control of biomass/biofuel combustion could be an effective method to reduce pollutant emission on a regional scale.
Introduction
Biomass combustion, such as domestic biofuel combustion (stoves for cooking and heating etc.), agricultural burning (crop residues, leaves), and wildfires (Fine et al., Citation2001; Schauer et al., Citation2001; Venkataraman et al., Citation2005; Wang et al., Citation2006a; Lee et al., Citation2008), is an important source of carbonaceous aerosols that scatter and absorb incident solar radiation, thereby affecting the Earth’s albedo as well as causing visibility impairment (Chow et al., Citation2002; Watson, Citation2002). Biomass burning is also an important primary source of many trace substances (HCN, CH3CN) that are reactants in atmospheric chemistry and that can affect biogeochemical nitrogen cycle of ecosystems (Lobert et al., Citation1990; Simoneit et al., Citation1999). Polysaccharide cellulose and hemicellulose are the dominated constituents in biomass burning (Lee et al., Citation2008). As the major molecular marker for biomass/biofuel burning processes, levoglucosan (1,6-anhydro-β-d-glucopyranose) originates from the pyrolysis of cellulose (Rogge et al., Citation1998; Simoneit et al., Citation1999) and mainly presents in fine aerosol fraction (Maenhaut et al., Citation1996; Liu et al., Citation2000; Lara et al., Citation2005; Sullivan et al., Citation2008). It is chemically stable in the atmosphere, showing no decay over 8-hr exposures to ambient conditions and sunlight (Locker, Citation1988). With the biomass combustion increasingly being identified as a major contributor to air pollution, a series of studies has appeared investigating the PM levoglucosan in many East Asian countries, and specifically in China (Abas et al., Citation2004; Wang and Kawaruma, Citation2005; Wang et al., Citation2007a; Bi et al., Citation2008; Lee et al., Citation2008; Zhang et al., Citation2008; Sang et al., Citation2011).
Xi’an, the capital city of Shaanxi Province in northeast China, is located in the Guanzhong Plain area with a topographic basin surrounded by Qinling Mountains to the south and the Loess Plateau to the north. Guanzhong Plain is one of the major agricultural production areas for wheat and corn. With a population of about 8.47 million, Xi’an is the largest city in northwestern China, where air pollution is significant, especially in winter due to drastic enhancement of coal and biomass burning for house heating. In addition, biomass burning practices in other seasons include a large variety of burning activities, such as field burning in preparation from agriculture planting (spring), postharvest burning of crop residues (summer, autumn), fallen leaves burning (autumn), and so on. Several studies about levoglucosan in PM2.5 (particles with an aerodynamic diameter ≤2.5 μm) have been conducted in China’s well-developed cities, such as Beijing, Nanjing, Guangzhou, and Hong Kong (Wang and Kawaruma, Citation2005; Wang et al., Citation2007a; Zhang et al., Citation2008; Sang et al., Citation2011), with concentration ranged from 30 to 950 ng m−3. But few measurements for PM2.5 levoglucosan are available in northwestern China.
The objectives of this study are to (1) examine the seasonal variations of PM2.5 levoglucosan, (2) investigate the relationship between levoglucosan and other chemical composition, and (3) estimate the biomass burning contribution to organic carbon (OC).
Experiments and Methods
Field sampling
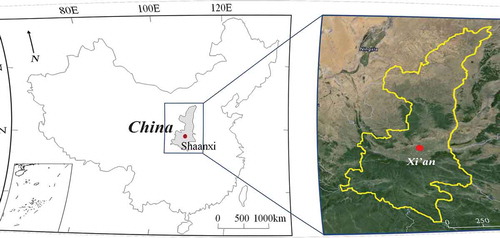
The sampling station (34.23°N, 108.88°E) was located in Xi’an High-Tech Zone (see ), where there are no major industrial activities, or local fugitive dust sources. A more detailed description of this site can be found in Zhang et al. (Citation2011). The air sampler was deployed on the rooftop of the Institute of Earth Environment, Chinese Academy of Sciences (IEECAS), at ˜10 m above ground level.
Figure 1. Geographical location of Xi’an sampling site in Shaanxi Province, China.
Twenty-four-hour PM2.5 sampling was performed every sixth day (from 10:00 a.m. to 10:00 a.m. the next day, local standard time [LST]) using TE-6070MFC hi-vol PM2.5 air sampler (Tisch, Cleveland, OH, USA) at a flow rate of 1.0 m3 min−1 from 5 July 2008 to 27 June 2009 (Dai et al., Citation2012). Samples were collected on 203 mm × 254 mm quartz-fiber filters (Whatman QM/A, Clifton, NJ, USA), which were prefired at 800 °C for 3 hr before sampling in order to remove contaminants. After sampling, the filters were wrapped in prefired aluminum foils and stored in the freezer (less than −10 °C). Also, field blank filters were collected to subtract the positive artifacts due to adsorption of gas-phase organic components onto the filter during and/or after sampling.
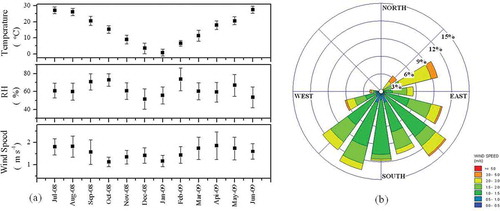
Continuous hourly average temperature, relative humidity (RH), wind speed, and wind direction were obtained from a local weather station (15 km north of the sampling site) (http://www.weather.com.cn). The monthly mean temperature (°C), RH (%), and wind speed (m sec−1) are presented in . Summertime is hot and humid, with an average ambient temperature of 26 °C and relative humidity (RH) of 70%. Wintertime is cold and dry, with an average ambient temperature of −1.3 °C and RH of 50%. A typical wind rose is shown in . From the figure, it can be deduced that over 90% of the time the wind blows to the northeast-southwest at average speed of 1.5 m sec−1, maximum speed of 3.6 m sec−1.
Figure 2. (a) Monthly average ambient temperatures, relative humidity (RH), and wind speeds and (b) wind rose in Xi’an.
Based on the meteorological characteristics and the typical residential heating period (mid-November through mid-March), the period from 15 November to 14 March was designated as winter, with allocated spring (15 March to 31 May), summer (1 June to 31 August), and autumn (1 September to 14 November) periods.
Analytical methods
PM2.5 chemical species, including water-soluble inorganic ions (K+, NH4+, Ca2+, Cl−, NO3−, and SO42−), carbonaceous species (OC and elemental carbon [EC]), stable carbon isotope (δ13COC and δ13CEC), and levoglucosan (LG), were measured.
Ion chromatographic analyses
A portion of quartz-fiber filter (10.8 cm2) was extracted with 10 mL of distilled deionized water. Typical extraction efficiencies for levoglucosan were 100% based on spiked standards followed by ultrasonic agitation/extraction. The extracts were filtered through 0.45-μm pore size microporous membranes to remove insoluble material. Levoglucosan were quantified by high-performance anion-exchange chromatography with pulsed amperometric detector (HPAEC-PAD) on a Dionex DX-600 ion chromatograph (Dionex Inc., Sunnyvale, CA, USA). The separation was carried on a Dionex CarboPac MA1 analytical column (4 × 250 mm) and a Dionex CarboPac MA1 guard column with sodium hydroxide solution (612 mM) as eluent at the flow rate of 0.4 mL min−1 (Engling et al., Citation2006; Iinuma et al., Citation2009). Aliquots of 100 μL of each extract were injected into the system, and the chromatographic run time was 1 hr for each measurement. Authentic standards were used for identifying and obtaining response factors of the individual anhydrosugars. The minimum detection limit (MDL) was estimated as the concentration visible in the chromatogram with the peak height at least 3 times the signal-to-noise ratio, which was found to be 1.3 ng mL−1. Measurement precision for levoglucosan was 2.3% (1 relative standard deviation), based on replicate analyses of sample extracts (n = 10).
The major ionic species, including water-soluble potassium (K+), ammonium (NH4+), calcium (Ca2+), chloride (Cl−), nitrate (NO3−), and sulfate (SO42−), were also measured in the same extracts using a Dionex DX-600 ion chromatograph. IonPac CS12A and AS14A columns were used for the separation of cations and anions, respectively. For anion separation, an eluent of 8 mM Na2CO3 and 1 mM NaHCO3 was used with a flow rate of 1 mL min−1, whereas 20 mM methanesulfonic acid with a flow rate of 1 mL min−1 was utilized as eluent for cation separation. The MDLs were as follows: 0.001 μg mL−1 each for NH4+, K+, and Ca2+, 0.008 μg mL−1 for Cl−, 0.025 μg mL−1 for NO3−, and 0.027 μg mL−1 for SO42−. Data reported are the field blank corrected. Quality assurance/quality control (QA/QC) procedures are as described by Zhang et al. (Citation2011).
Carbon and stable isotope analyses
A punch (0.526 cm2) of quartz-fiber filter was analyzed for organic carbon (OC) and elemental carbon (EC) by the IMPROVE_A thermal/optical reflectance (TOR) protocol (Chow and Watson, Citation2002) using a Desert Research Institute (DRI, Reno, NV, USA) model 2001 thermal/optical carbon analyzer (Atmoslytic Inc., Calabasas, CA, USA). Detailed information on carbon analysis and required quality assurance and quality control are documented in Chow et al. (Citation2011).
The stable carbon isotope composition (δ13COC and δ13CEC) was determined by combusting quartz-fiber filters using a Finnigan MAT-251 ratio mass spectrometer (Thermo Electron Corporation, Burlington, ON, Canada) (Ho et al., Citation2006a; Cao et al., Citation2011). Prior to isotopic analysis, carbonate was removed by treatment with hydrochloric acid. The carbon remaining on the substrates, which included both OC and EC, was then oxidized to CO2 by dry combustion at 375 °C for 3 hr. A series of cold traps was used to collect the CO2 produced from OC, and the CO2 was quantified by manometry. The stable carbon isotopic composition of the CO2 was determined as δ13COC. The carbon that remained on the filters was combusted at 850 °C for 5 hr and quantified as δ13CEC. Samples were analyzed at least in duplicate, with a maximum difference in carbon isotopes of 0.3‰ between replicates.
δ13C values, based on the international standard Vienna Pee Dee Belemnite (V-PDB), were calculated as follows:
Fire count map from satellite observations
Fire count maps, displaying the active burning hot spots, were derived from MODIS (Moderate Resolution Imaging Spectroradiometer) satellite images. Data were analyzed using a standard MODIS MOD14 Fire and Thermal Anomalies Product algorithm (http://earthdata.nasa.gov/data/near-real-time-data/firms).
Results and Discussion
Characteristics of levoglucosan
shows the temporal variation of PM2.5 levoglucosan concentrations, with 24-hr average ranging from 46 to 1889 ng m−3 and the average concentration of 428 ng m−3 from 5 July 2008 to 27 June 2009 (). Average levoglucosan concentration in winter (935 ± 443 ng m−3) was 11 times higher than summer (85 ± 24 ng m−3), with 370 ± 325 and 178 ± 125 ng m−3 for autumn and spring, respectively. The summer minima and winter maxima phenomena were also found in Chongqing, Wuhan, and Guangzhou (Wang et al., Citation2006a). The seasonal variations of PM2.5 chemical compositions are shown in , the concentrations and fractions of different constituents varied during the different seasons. The difference may be ascribed to (1) the change of emission sources (i.e., residential and commercial coal combustion, biomass burning, motor vehicle exhaust, soil dust, and so on); (2) chemical conversions of different compositions; and (3) different chemical compositions removal rates by deposition. Chemical conversions and deposition are all influenced by meteorological conditions (such as temperature, RH, wind speed, rainfall, and so on).
Figure 3. Temporal variation of levoglucosan mass concentrations (ng m−3) from July 2008 to June 2009. The blue lines show the monthly average concentrations and red line shows the annual average concentration.
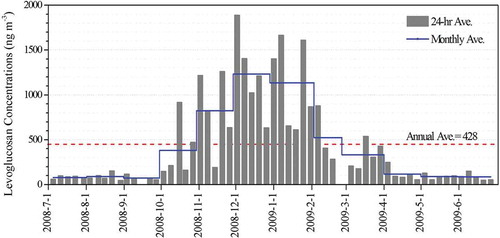
Table 1. Statistical summary of 24-hr PM2.5 chemical composition for samples acquired over spring, summer, autumn, and winter periods in Xi’an, China
The main energy source for cooking and heating in rural China are biofuels, including crop residues and fuel wood (Wang et al., Citation2006a; Yan et al., Citation2006). Biomass burning started after agriculture harvest in Xi’an and its surrounding areas, and household heating with straw and branch burning took place from November to March the following year. Meteorological conditions during winter were characterized by stagnation with a low inversion layer, which intensify levoglucosan levels through accumulation of air pollutants.
Besides, several episodic events with dramatic increases were clearly observed in spring. Elevated levoglucosan concentrations reached 538 and 429 ng m−3 on 17 and 29 March 2009, respectively, accompanied by substantial increase in OC (34 and 25 μg m−3) and K+ (2 μg m−3) concentrations. This might have been affected by agricultural burning activities and dry weather. In spring, field preparation burnings occurred at Xi’an and surrounding areas, with monthly average RH of 60% (March), 59% (April), and 66% (May).
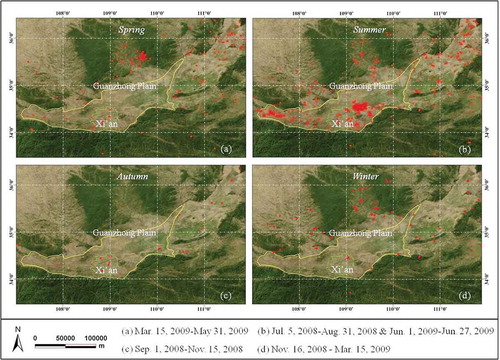
Biomass burning activities were apparent in Guanzhong Plain, as shown by satellite-derived fire counts (). Extensive biomass burning activities occurred in summer as compared with winter. Farmers in Guanzhong Plain started field preparation during June and July and burned crop residues (e.g., corn and wheat), resulting in sporadic emissions of biomass burning smoke. However, the meteorological conditions were favorable for dilution and diffusion of pollutants in summer. Summer monsoons from the southeast carried an abundance of rainfall to Xi’an, leading to high precipitation in summer (Shen et al., Citation2012). The average wind speed was also relatively high (1.8 m sec−1). Although the fire counts were relatively low in winter, average levoglucosan concentrations were the highest, suggesting that larger domestic biofuel burning sources (not shown in the MODIS fire counts map) during the winter coupled with a more stagnant air mass led to the elevated levoglucosan levels.
Figure 4. Fire counts (red points) during the period of 5 July 2008 to 27 June 2009.
Correlation of levoglucosan with other compounds
shows that relatively high correlation coefficients (0.70 < R < 0.92) were found between levoglucosan and K+, Cl−, OC, EC, and glyoxal, indicative of biomass burning.
Table 2. The correlation coefficientsa between levoglucosan and other parameters
Elevated K+ have been found in biomass burning emission and has been applied in several source apportionment studies (Cachier et al., Citation1991; Chow, Citation1995; Duan et al., Citation2004). However, K+ was also reported in fireworks (Wang et al., Citation2007b; Chang et al., Citation2011). In addition to, it suffers from the fact that it has also contributions from sea salt, meat cooking, refuse incinerators, and, particularly, all combustion (Hildemann et al., Citation1991; Sheffield et al., Citation1994; Zhang et al., Citation2008). shows that the correlation between levoglucosan and K+ was highest in spring (R = 0.77), followed by winter (R = 0.75; excluding Chinese New Year’s firework events), and low in other seasons.
Figure 5. Correlations between levoglucosan and (a) K+, (b) OC, (c) glyoxal, and (d) Cl−. Green: spring; red: summer; yellow: autumn; blue: winter. The encircled components demonstrate fireworks during the Chinese New Year’s firework events.
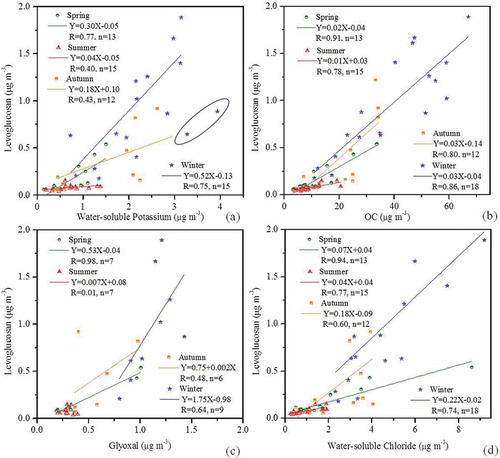
Good OC/EC correlations with levoglucosan (0.70 < R < 0.91) were found, suggesting impacts from a combination of coal combustion (mostly residential), motor vehicle exhaust, and biomass burning (Streets et al., Citation2001; Zhang et al., Citation2001; Cao et al., Citation2005). Sullivan et al. (Citation2008) suggest that the levoglucosan/OC ratio varies by fuel component, with the highest ratio found in branches, followed by straw, needles, and leaves. In this study, the highest levoglucosan/OC ratio of 2.3% was found in winter (the intercept of autumn was larger than winter) compared with other seasons, suggesting more straw was burned in winter. As can be seen in , the correlation between levoglucosan and OC was high in spring (R = 0.91), summer (R = 0.73), autumn (R = 0.80), and winter (R = 0.86). These good correlations suggest that biomass burning in spring and winter is an important source of organic carbon.
Glyoxal is produced during the oxidation of many anthropogenic and biogenic volatile organic compounds (VOCs) (Ho et al., Citation2006b; Fu et al., Citation2008; Myriokefalitakis et al., Citation2008). Even if there is only a small fraction of glyoxal partitioning onto particles, it can still affect the global secondary organic aerosol (SOA) budget significantly. Dai et al. (Citation2012) reported an average PM2.5 glyoxal concentration of 0.7 ± 0.4 ng m−3 during same sampling period at Xi’an, with the highest concentration of 1.1 ng m−3 in winter. As shown in , there was a strong correlation between levoglucosan and glyoxal (R = 0.80) concentrations. The results are consistent with other studies and are suggestive of biomass burning being a glyoxal source (Fu et al., Citation2008; Akagi et al., Citation2011). shows the relationship between levoglucosan and glyoxal during four seasons, with the relatively high correlation in spring (R = 0.98) and winter (R = 0.64). There was no correlation between levoglucosan and glyoxal in summer and autumn, which may due to the limited measurement and very low concentrations. In addition, the correlations between levoglucosan and other carbonyls were very low.
As Xi’an is far inland, marine influences on the urban aerosol particles should be minimal. Previous studies showed that Cl− is also associated with the vegetative and coal burning activities during the cold seasons (Wang et al., Citation2006b; Deshmukh et al., Citation2011). Shen et al. (Citation2009) reported that the high Cl− is more likely from straw combustion emission in Xi’an. Therefore, levoglucosan is well correlated with Cl− (R = 0.79), as shown in , implying its association with biomass burning.
Relationship between δ13CEC and the EC/TC ratio
Cachier et al. (Citation1989) uses the relationship between isotopic composition (δ13C) and CEC/CTC ratio to discriminate among combustion sources. TC (total carbon) was calculated as the sum of OC plus EC. The distributions of δ13CEC and EC/TC ratio during different seasons are shown in (δ13C is replaced with δ13CEC because EC retains the isotopic information of the original emission sources whereas OC does not [Cao et al., Citation2011]).
Figure 6. Scatterplot of δ13CEC versus EC/TC ratio in PM2.5.
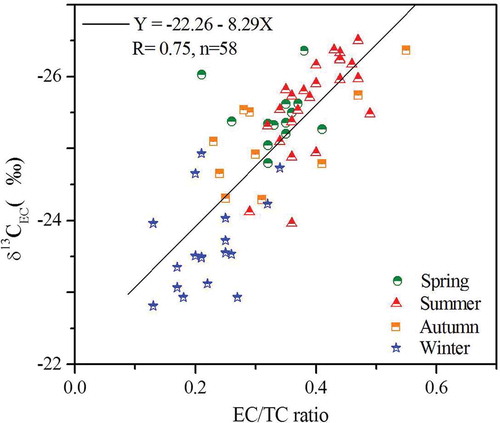
Reasonable correlation (R = 0.75) was found between δ13CEC and EC/TC ratio, consistent with the association (R = 0.70) between levoglucosan and EC. As seen in , δ13CEC was relatively light with increasing EC/TC ratios, it means biomass burning activities were relatively weak in summer. In contrast, when the δ13CEC was relatively heavy, the ratios of EC to TC decreased, this indicates that biomass burning was most active in winter. This result is consistent with the above dates.
Impact of biomass burning on air quality
Levoglucosan to OC or PM2.5 ratios have been used to estimate the effects of biomass burning (Zdrahal et al., Citation2002; Puxbaum et al., Citation2007; Wang et al., Citation2007a; Zhang et al., Citation2010, 2012; Sang et al., Citation2011). Sullivan et al. (Citation2008) reported that the levoglucosan content in OC was 7.6% for rice straw burning in Taiwan. Zhang et al. (Citation2007) reported an average of 8.2% (with a range of 5.4–11.8%) of levoglucosan in OC with cereal straw (corn, wheat, and rice) in China. Therefore, the contributions of biomass burning to OC (based on enrichment factor reception modeling approach) can be inferred as follows:
These characteristics mean that levoglucosan could be the tracer compound to separate biomass burnings from other sources, but could not distinguish different biomass combustion sources from each other. Due to the lack of source profiles for constituent ratio of different types biomass in different seasons under realistic ambient conditions, an average levoglucosan to OC ratios of 8.2% from combustion chamber study (Zhang et al., Citation2007) was adopted. shows that the contributions of biomass burning to OC were highest during January (30.2 ± 7.8%), with 26.4–30.2% for the remaining winter months, and lowest during June (7.6 ± 2.0%). These values are higher than those of 6.5–11% and 16–28% reported in Hong Kong (Sang et al., Citation2011) and Hainan (Zhang et al., Citation2012), respectively, but are closer to the upper range of 18–38% reported in Beijing (Zhang et al., Citation2008).
Figure 7. Monthly average contribution of biomass burning to OC.
Comparison with other studies
Levoglucosan concentrations and levoglucosan/OC ratios acquired from rural, suburban, and urban areas in China are summarized in . Average concentrations of levoglucosan in Xi’an were similar to those in northern cities such as Beijing (Zhang et al., Citation2008) and Baoji (Xie et al., Citation2010). The seasonal tendency of levoglucosan concentrations between Xi’an and Beijing was also similar, with winter maxima and summer minima. In southern cities, levoglucosan levels were lower, such as Nanjing (Wang and Kawaruma, Citation2005), Guangzhou (Wang et al., Citation2007a), and Hong Kong (Sang et al., Citation2011). Levoglucosan concentrations were low in the range of 30–95 ng m−3 at the rural sites (e.g., Hok Tsui, Hong Kong; Jianfengling, Hainan; Mt. Hua, Shaanxi). Average levoglucosan concentrations in winter generally were around 2–5 times higher than these in summer. Emissions from biomass/biofuel combustion for domestic cooking and heating, together with wintertime stagnation and low inversion layers, most likely resulted in elevated levoglucosan, especially in the northern cities. The ratios of levoglucosan/OC were relatively high in northern cities and relatively low in southern cities. Moreover, the ratios were higher in winter than those in summer, which was attributed to winter/summer ratio of levoglucosan extremely higher than winter/summer ratio of OC. Compared with the data of levoglucosan and OC from previous literature, similar tendency could be found (Cao et al., Citation2007; Wang et al., 2006). We also compared the concentrations of levoglucosan measured in other countries available in the literature (). The concentrations of levoglucosan reported for different sampling locations ranged between hundreds and thousands of ng m−3 in winter and tens of ng m−3 in summer in various urban and rural locations.
Table 3. Comparison of average levoglucosan concentrations and levoglucosan/OC ratios for different locations
Conclusion
Biomass burning is an important source of aerosol particles affecting local and regional air quality, but it was not recognized in western China. Annual average PM2.5 levoglucosan concentration was 428 ± 399 ng m−3 from 7 July 2008 to 27 June 2009 in Xi’an. Average seasonal levoglucosan concentrations were highest during winter (934 ± 443 ng m−3) and autumn (370 ± 325 ng m−3) and low in spring (178 ± 125 ng m−3) and summer (85 ± 24 ng m−3), reflecting changes in biomass burning activities in the surrounding areas of Xi’an. The influence of biomass burning is maximum during the residential heating season (winter), with impacts during autumn field burning (corn stalks, wheat straw, dead leaves) and spring field burning in preparation for agriculture planting. Domestic biomass burning in northwestern China cannot be explored through the satellite fire counts. Reasonably good correlations were found between levoglucosan and water-soluble K+ (R = 0.75), Cl− (R = 0.79), OC (R = 0.91), EC (R = 0.70), and glyoxal (R = 0.80). Using a simplified receptor-based enrichment factor approach, biomass burning contributed to 5.1–43.8% of OC. Household heating with biomass during winter in Guanzhong Plain needs to be further investigated. Therefore, the control of biomass/biofuel combustion could be an effective method to reduce pollutant emissions on a regional scale in northwestern China.
Funding
This study was supported by the “Strategic Priority Research Program” of the Chinese Academy of Sciences (grant XDA05100401), Ministry of Science and Technology (grants 2012BAH31B03 and 201209007), and Shaanxi Province Government (grants 2012KTZB03-01-01 and 2011KTCQ03-04).
Additional information
Notes on contributors
Ting Zhang
Ting Zhang and Sui-Xin Liu are engineers, and Jun-Ji Cao, Steven Sai Hang Ho, Yong-Ming Han, and Ge-Hui Wang are professors for the SKLLQG, Institute of Earth Environment, Chinese Academy of Sciences, Xi’an, People’s Republic of China.
Jun-Ji Cao
Ting Zhang and Sui-Xin Liu are engineers, and Jun-Ji Cao, Steven Sai Hang Ho, Yong-Ming Han, and Ge-Hui Wang are professors for the SKLLQG, Institute of Earth Environment, Chinese Academy of Sciences, Xi’an, People’s Republic of China.
Judith C. Chow
Judith C. Chow and John G. Watson are research professors in Division of Atmospheric Sciences, Desert Research Institute, Reno, NV, USA.
Zhen-Xing Shen
Zhen-Xing Shen is a professor at the Department of Environmental Science and Engineering, Xi’an Jiaotong University, Xi’an, People’s Republic of China.
Kin-Fai Ho
Kin-Fai Ho is a professor at the Jockey Club School of Public Health and Primary Care, the Chinese University of Hong Kong, Hong Kong SAR, People’s Republic of China.
Steven Sai Hang Ho
Ting Zhang and Sui-Xin Liu are engineers, and Jun-Ji Cao, Steven Sai Hang Ho, Yong-Ming Han, and Ge-Hui Wang are professors for the SKLLQG, Institute of Earth Environment, Chinese Academy of Sciences, Xi’an, People’s Republic of China.
Sui-Xin Liu
Ting Zhang and Sui-Xin Liu are engineers, and Jun-Ji Cao, Steven Sai Hang Ho, Yong-Ming Han, and Ge-Hui Wang are professors for the SKLLQG, Institute of Earth Environment, Chinese Academy of Sciences, Xi’an, People’s Republic of China.
Yong-Ming Han
Ting Zhang and Sui-Xin Liu are engineers, and Jun-Ji Cao, Steven Sai Hang Ho, Yong-Ming Han, and Ge-Hui Wang are professors for the SKLLQG, Institute of Earth Environment, Chinese Academy of Sciences, Xi’an, People’s Republic of China.
John G. Watson
Judith C. Chow and John G. Watson are research professors in Division of Atmospheric Sciences, Desert Research Institute, Reno, NV, USA.
Ge-Hui Wang
Ting Zhang and Sui-Xin Liu are engineers, and Jun-Ji Cao, Steven Sai Hang Ho, Yong-Ming Han, and Ge-Hui Wang are professors for the SKLLQG, Institute of Earth Environment, Chinese Academy of Sciences, Xi’an, People’s Republic of China.
Ru-Jin Huang
Ru-Jin Huang is a scientist at Laboratory of Atmospheric Chemistry, Paul Scherrer Institute, Villigen, Switzerland.
References
- Abas, M.R., D.R. Oros, and B.R.T. Simoneit 2004. Biomass burning as the main source of organic aerosol particulate matter in Malaysia during haze episodes. Chemosphere 55:1089–1095.
- Akagi, S.K., R.J. Yokelson, C. Wiedinmyer, M.J. Alvarado, J.S. Reid, T. Karl, J.D. Crounse, and P.O. Wennberg. 2011. Emission factors for open and domestic biomass burning for use in atmospheric models. Atmos. Chem. Phys. 11:4039–4072. doi:10.5194/acp-11-4039-2011
- Bi, X.H., B.R.T. Simoneit, G.Y. Sheng, S.X. Ma, and J.M. Fu. 2008. Composition and major sources of organic compounds in urban aerosols. Atmos. Res. 88:256–265. doi:10.1016/j.atmosres.2007.11.017
- Cachier, H., M.P. Brémond, and P. Buat-Ménard. 1989. Carbonaceous aerosols from different tropical biomass burning sources. Nature 340:371–373. doi:10.1038/340371a0
- Cachier, H., J. Ducret, M.P. Brémond, A. Gaudichet, J.P. Lacaux, V. Yoboue, and J. Baudet. 1991. Characterization of biomass burning aerosols in a Savannah Region of the Ivory Coast. In Global Biomass Burning: Atmospheric, Climatic and Biospheric Implications, ed. J.S. Levine, 174–180. Cambridge, MA: MIT Press.
- Cao, J.J., J.C. Chow, J. Tao, S.C. Lee, J.G. Watson, K.F. Ho, G.H. Wang, C.S. Zhu, and Y.M. Han. 2011. Stable carbon isotopes in aerosols from Chinese cities: Influence of fossil fuels. Atmos. Environ. 45:1359–1363. doi:10.1016/j.atmosenv.2010.10.056
- Cao, J.J., S.C. Lee, J.C. Chow, J.G. Watson, K.F. Ho, R.J. Zhang, Z.D. Jin, Z.X. Shen, G.C. Chen, Y.M. Kang, S.C. Zou, L.Z. Zhang, S.H. Qi, M.H. Dai, Y. Cheng, and K. Hu. 2007. Spatial and seasonal distributions of carbonaceous aerosols over China. J. Geophys. Res. 112:D22S11. doi:10.1029/2006jd008205
- Cao, J.J., F. Wu, J.C. Chow, S.C. Lee, Y. Li, S.W. Chen, Z.S. An, K.K. Fung, J.G. Watson, C.S. Zhu, and S.X. Liu. 2005. Characterization and source apportionment of atmospheric organic and elemental carbon during fall and winter of 2003 in Xi’an. China. Atmos. Chem. Phys. 5:3127–3137. doi:10.5194/acp-5-3127-2005
- Chang, S.C., T.H. Lin, C.Y. Young, and C.T. Lee. 2011. The impact of ground-level fireworks (13 km long) display on the air quality during the traditional Yanshui Lantern Festival in Taiwan. Environ. Monit. Assess. 172:463–479. doi:10.1007/s10661-010-1347-1
- Chow, J.C. 1995. Measurement methods to determine compliance with ambient air quality standards for suspended particles. J. Air Waste Manage. Assoc. 45:320–382. doi:10.1080/10473289.1995.10467369
- Chow, J.C., J.D. Bachmann, S.S.G. Wierman, C.V. Mathai, W.C. Malm, W.H. White, P.K. Mueller, N.K. Kumar, and J.G. Watson. 2002. Visibility: Science and regulation. J. Air Waste Manage. Assoc. 52:973–999. doi:10.1080/10473289.2002.10470844
- Chow, J.C., and J.G. Watson. 2002. PM2.5 carbonate concentrations at regionally representative Interagency Monitoring of Protected Visual Environment sites. J. Geophys. Res. 107(D21):8344. doi:10.1029/2001JD000574
- Chow, J.C., J.G. Watson, J. Robles, X.L. Wang, L.W.A. Chen, D.L. Trimble, S.D. Kohl, R.J. Tropp, and K.K. Fung. 2011. Quality assurance and quality control for thermal/optical analysis of aerosol samples for organic and elemental carbon. Anal. Bioanal. Chem. 401:3141–3152. doi:10.1007/s00216-011-5103-3
- Dai, W.T., S.S.H. Ho, K.F. Ho, and J.J. Cao. 2012. Characterization of particulate-phase high molecular weight mono-carbonyls (C# > 5) and dicarbonyls in urban atmosphere of Xi’an, China. Aerosol Air Qual. Res. 12:892–901. doi:10.4209/aaqr.2011.12.0228
- Deshmukh, D.K., M.K. Deb, Y. Tsai, and S.L. Mkoma. 2011. Water soluble ions in PM2.5 and PM1 aerosols in Durg City, Chhattisgarh, India. Aerosol Air Qual. Res. 11:696–708. doi:10.4209/aaqr.2011.03.0023
- Duan, F.K., X.D. Liu, T. Yu, and H. Cachier. 2004. Identification and estimate of biomass burning contribution to the urban aerosol organic carbon concentrations in Beijing. Atmos. Environ. 38:1275–1282. doi:10.1016/j.atmosenv.2003.11.037
- Engling, G., C.M. Carrico, S.M. Kreidenweis, J.L. Collett, D.E. Day, W.C. Malm, E. Lincoln, W.M. Hao, Y. Iinuma, and H. Herrmann. 2006. Determination of levoglucosan in biomass combustion aerosol by high-performance anion-exchange chromatography with pulsed amperometric detection. Atmos. Environ. 40:S299–S311. doi:10.1016/j.atmosenv.2005.12.069
- Fine, P.M., G.R. Cass, and B.R.T. Simoneit. 2001. Chemical characterization of fine particle emissions from fireplace combustion of woods grown in the northeastern United States. Environ. Sci. Technol. 35:2665–2675. doi:10.1021/es001466k
- Fu, T.-M., D.J. Jacob, F. Wittrock, J.P. Burrows, M. Vrekoussis, and D.K. Henze. 2008. Global budgets of atmospheric glyoxal and methylglyoxal, and implications for formation of secondary organic aerosols. J. Geophys. Res. 113:D15303. doi:10.1029/2007JD009505
- Giannoni, M., T. Martellini, M.D. Bubba, A. Gambaro, R. Zangrando, M. Chiari, L. Lepri, and A. Cincinelli. 2012. The use of levoglucosan for tracing biomass burning in PM2.5 samples in Tuscany (Italy). Environ. Pollut. 167:7–15. doi:10.1016/j.envpol.2012.03.016
- Ho, K.F., S.C. Lee, J.J. Cao, Y.S. Li, J.C. Chow, J.G. Watson, and K. Fung. 2006a. Variability of organic and elemental carbon, water soluble organic carbon, and isotopes in Hong Kong. Atmos. Chem. Phys. 6:4569–4576. doi:10.5194/acp-6-4569-2006
- Ho, S.S.H., J.Z. Yu, K.W. Chu, and L.L. Yeung. 2006b. Carbonyl emissions from commercial cooking sources in Hong Kong. J. Air Waste Manage. Assoc. 56:1091–1098. doi:10.1080/10473289.2006.10464532
- Hildemann, L.M., G.R. Markowski, and G.R. Cass. 1991. Chemical-composition of emissions from urban sources of fine organic aerosol. Environ. Sci. Technol. 25:744–759. doi:10.1021/es00016a021
- Iinuma, Y., G. Engling, H. Puxbaum, and H. Herrmann. 2009. A highly resolved anion-exchange chromatographic method for determination of saccharidic tracers for biomass combustion and primary bio-particles in atmospheric aerosol. Atmos. Environ. 43:1367–1371. doi:10.1016/j.atmosenv.2008.11.020
- Krumal, K., P. Mikuska, M. Vojtesek, and Z. Vecera. 2010. Seasonal variations of monosaccharide anhydrides in PM1 and PM2.5 aerosol in urban areas. Atmos. Environ. 44:5148–5155. doi:10.1016/j.atmosenv.2010.08.057
- Lara, L.L., P. Artaxo, L.A. Martinelli, P.B. Camargo, R.L. Victoria, and E.S.B. Ferraz. 2005. Properties of aerosols from sugar-cane burning emissions in Southeastern Brazil. Atmos. Environ. 39:4627–4637. doi:10.1016/j.atmosenv.2005.04.026
- Lee, J.J., G. Engling, S.C.C. Lung, and K.Y. Lee. 2008. Particle size characteristics of levoglucosan in ambient aerosols from rice straw burning. Atmos. Environ. 42:8300–8308. doi:10.1016/j.atmosenv.2008.07.047
- Li, J.J., G.H. Wang, B.H. Zhou, C.L. Cheng, J.J. Cao, Z.X. Shen, and Z.S. An. 2012. Airborne particulate organics at the summit (2060 m, a.s.l.) of Mt. Hua in central China during winter: Implications for biofuel and coal combustion. Atmos. Res. 106:108–119. doi:10.1016/j.atmosres.2011.11.012
- Liu, X.D., P. Van Espen, F. Adams, J. Cafmeyer, and W. Maenhaut. 2000. Biomass burning in southern Africa: Individual particle characterization of atmospheric aerosols and savanna fire samples in southern Africa. J. Atmos. Chem. 36:135–155. doi:10.1016/S0021-8502(00)90193-9
- Lobert, J.M., D.H. Scharffe, W.M. Hao, and P.J. Crutzen, 1990. Importance of biomass burning in the atmospheric budgets of nitrogen-containing gases. Nature 346:552–554. doi:10.1038/346552a0
- Locker, H.B. 1988. The use of levoglucosan to assess the environmental impact of residential wood-burning on air quality. Ph.D. dissertation, Dartmouth College, Hanover, New Hampshire, 137 pp.
- Maenhaut, W., I. Salma, J. Cafmeyer, H.J. Annegarn, and M.O. Andreae. 1996. Regional atmospheric aerosol composition and sources in the eastern Transvaal, South Africa, and impact of biomass burning. J. Geophys. Res. 101:23631–23650. doi:10.1029/95JD02930
- Myriokefalitakis, S., M. Vrekoussis, K. Tsigaridis, F. Wittrock, A. Richter, C. Bruehl, R., Volkamer, J.P. Burrows, and M. Kanakidou. 2008. The influence of natural and anthropogenic secondary sources on the glyoxal global distribution. Atmos. Chem. Phys. 8:4965–4981. doi:10.5194/acp-8-4965-2008
- Puxbaum, H., A. Caseiro, A. Sanchez-Ochoa, A. Kasper-Giebl, M. Claeys, A. Gelencser, M. Legrand, S. Preunkert, and C. Pio. 2007. Levoglucosan levels at background sites in Europe for assessing the impact of biomass combustion on the European aerosol background. J. Geophys. Res. 112:D23S05. doi:10.1029/2006jd008114
- Rogge, W.F., L.M. Hildemann, M.A. Mazurek, G.R. Cass, and B.R.T. Simoneit. 1998. Sources of fine organic aerosol. 9. Pine, oak and synthetic log combustion in residential fireplaces. Environ. Sci. Technol. 32:13–22. doi:10.1021/es960930b
- Sang, X.F., C.Y. Chan, G. Engling, L.Y. Chan, X.M. Wang, Y.N. Zhang, S. Shi, Z.S. Zhang, T. Zhang, and M. Hu. 2011. Levoglucosan enhancement in ambient aerosol during springtime transport events of biomass burning smoke to Southeast China. Tellus. 63B:129–139. doi:10.1111/teb.2011.63.issue-1
- Schauer, J.J., M.J. Kleeman, G.R. Cass, and B.R.T. Simoneit. 2001. Measurement of emissions from air pollution sources. 3. Cl–C29 organic compounds from fireplace combustion of wood. Environ. Sci. Technol. 39:1716–1728. doi:10.1021/es001331e
- Sheffield, A.E., G.E. Gordon, L.A. Currie, and G.E. Riederer. 1994. Organic, elemental, and isotopic tracers of air pollution sources in Albuquerque, NM. Atmos. Environ. 28:1371–1384. doi:10.1016/1352-2310(94)90200-3
- Shen, Z.X., J.J. Cao, R. Arimoto, Z.W. Han, R.J. Zhang, Y.M. Han, S.X. Liu, T. Okuda, S. Nakao, and S. Tanaka. 2009. Ionic composition of TSP and PM2.5 during dust storms and air pollution episodes at Xi’an, China. Atmos Environ. 43:2911–2918. doi:10.1016/j.atmosenv.2009.03.005
- Shen, Z.X., L.M. Zhang, J.J. Cao, J. Tian, L. Liu, G.H. Wang, Z.Z. Zhao, X. Wang, R.J. Zhang, and S.X. Liu. 2012. Chemical composition, sources, and deposition fluxes of water-soluble inorganic ions obtained from precipitation chemistry measurements collected at an urban site in northwest China. J. Environ. Monit. 14:3000–3008. doi:10.1039/c2em30457k
- Simoneit, B.R.T., J.J. Schauer, C.G. Nolte, D.R. Oros, V.O. Elias, M.P. Fraser, W.F. Rogge, and G.R. Cass. 1999. Levoglucosan, a tracer for cellulose in biomass burning and atmospheric particles. Atmos. Environ. 33:173–182. doi:10.1016/S1352-2310(98)00145-9
- Streets, D.G., S. Gupta, S.T. Waldhoff, M.Q. Wang, T.C. Bond, and Y.Y. Bo. 2001. Black carbon emissions in China. Atmos. Environ. 35:4281–4296. doi:10.1016/S1352-2310(01)00179-0
- Sullivan, A.P., A.S. Holden, L.A. Patterson, G.R. McMeeking, S.M. Kreidenweis, W.C. Malm, W.M. Hao, C.E. Wold, and J.L. Collett. 2008. A method for smoke marker measurements and its potential application for determining the contribution of biomass burning from wildfires and prescribed fires to ambient PM2.5 organic carbon. J. Geophys. Res. 113:D22302. doi:10.1029/2008jd010216
- Venkataraman, C., G. Habib, A. Eiguren-Fernandez, A.H. Miguel, and S.K. Friedlander. 2005. Residential biofuels in south Asia: Carbonaceous aerosol emissions and climate impacts. Science 307:1454–1456. doi:10.1126/science.1104359
- Wang, G.H., and K. Kawamura. 2005. Molecular characteristics of urban organic aerosols from Nanjing: A case study of a mega-city in China. Environ. Sci. Technol. 39:7430–7438. doi:10.1021/es051055+
- Wang, G.H., K. Kawamura, S.C. Lee, K.F. Ho, and J.J. Cao. 2006a. Molecular, seasonal and spatial distributions of organic aerosols from fourteen Chinese cities. Environ. Sci. Technol. 40:4619–4625. doi:10.1021/es060291x
- Wang, Q.Q., M. Shao, Y. Liu, W. Kuster, P. Goldan, X.H. Li, Y.A. Liu, and S.H. Lu. 2007a. Impact of biomass burning on urban air quality estimated by organic tracers: Guangzhou and Beijing as cases. Atmos. Environ. 41:8380–8390. doi:10.1016/j.atmosenv.2007.06.048
- Wang, Y., G.S. Zhuang, C. Xu, and Z.S. An. 2007b. The air pollution caused by the burning of fireworks during the lantern festival in Beijing. Atmos. Environ. 41:417–431. doi:10.1016/j.atmosenv.2006.07.043
- Wang, Y., G.S. Zhuang, X.Y. Zhang, K. Huang, C. Xu, A. Tang, J.M. Chen, and Z.S. An. 2006b. The ion chemistry, seasonal cycle and sources of PM2.5 and TSP aerosol in Shanghai. Atmos. Environ. 40:2935–2952. doi:10.1016/j.atmosenv.2005.12.051
- Watson, J.G. 2002. Visibility: Science and regulation. J. Air Waste Manage. Assoc. 52:628–713. doi:10.1080/10473289.2002.10470813
- Xie, M., G. Wang, S. Hu, S. Gao, Q. Han, Y. Xu, and J. Feng. 2010. Polar organic and inorganic markers in PM10 aerosols from an inland city of China—Seasonal trends and sources. Sci. Total Environ. 408:5452–5460. doi:10.1016/j.scitotenv.2010.07.029
- Yan, X., T. Ohara, and H. Akimoto. 2006. Bottom-up estimate of biomass burning in mainland China. Atmos. Environ. 40:5262–5273. doi:10.1016/j.atmosenv.2006.04.040
- Yttri, K.E., C. Dye, L.H. Slørdal, and O.-A. Braathen. 2005. Quantification of monosaccharide anhydrides by liquid chromatography combined with mass spectrometry: Application to aerosol samples from an urban and a suburban site influenced by small-scale wood burning. J. Air Waste Manage. Assoc. 55:1169–1177. doi:10.1080/10473289.2005.10464720
- Zdrahal, Z., J. Oliveira, R. Vermeylen, M. Claeys, and W. Maenhaut. 2002. Improved method for quantifying levoglucosan and related monosaccharide anhydrides in atmospheric aerosols and application to samples from urban and tropical locations. Environ. Sci. Technol. 36:747–753. doi:10.1021/es015619v
- Zhang, T., J.J. Cao, X.X. Tie, Z.X. Shen, S.X. Liu, H. Ding, Y.M. Han, G.H. Wang, K.F. Ho, J. Qiang, and W.T. Li. 2011. Water-soluble ions in atmospheric aerosols measured in Xi’an, China: Seasonal variations and sources. Atmos. Res. 102:110–119. doi:10.1016/j.atmosres.2011.06.014
- Zhang, T., M. Claeys, H. Cachier, S. Dong, W. Wang, W. Maenhaut, and X. Liu. 2008. Identification and estimation of the biomass burning contribution to Beijing aerosol using levoglucosan as a molecular marker. Atmos. Environ. 42:7013–7021. doi:10.1016/j.atmosenv.2008.04.050
- Zhang, X.Y., J.J. Cao, and H. Su. 2001. Particulate pollution control in Xi’an. In Urban Air Pollution Control in China, 222–293. United Nations Development Program and China International Center of Economic and Technology Exchange. Beijing: China Science & Technology Press.
- Zhang, Y.X., M. Shao, Y.H. Zhang, L.M. Zeng, L.Y. He, B. Zhu, Y.J. Wei, and X.L. Zhu. 2007. Source profiles of particulate organic matters emitted from cereal straw burnings. J. Environ. Sci. 19:167–175. doi:10.1016/S1001-0742(07)60027-8
- Zhang, Y.N., Z.S. Zhang, C.Y. Chan, G. Engling, X.F. Sang, S. Shi, and X.M. Wang. 2012. Levoglucosan and carbonaceous species in the background aerosol of coastal southeast China: Case study on transport of biomass burning smoke from the Philippines. Environ. Sci. Pollut. Res. 19:244–255. doi:10.1007/s11356-011-0548-7
- Zhang, Z., G. Engling, C.Y. Lin, C.C.K. Chou, S.C. Lung, S.Y. Chang, S. Fan, C.Y. Chan, and Y.H. Zhang. 2010. Chemical speciation, transport and contribution of biomass burning smoke to ambient aerosol in Guangzhou, a mega city of China. Atmos. Environ. 44:3187–3195. doi:10.1016/j.atmosenv.2010.05.024