
Abstract
The level of particulate matter of less than 10 μm diameter (PM10) at subway platforms can be significantly reduced by installing a platform screen-door system. However, both workers and passengers might be exposed to higher PM10 levels while the cars are within the tunnel because it is a more confined environment. This study determined the PM10 levels in a subway tunnel, and identified the sources of PM10 using elemental analysis and receptor modeling. Forty-four PM10 samples were collected in the tunnel between the Gireum and Mia stations on Line 4 in metropolitan Seoul and analyzed using inductively coupled plasma–atomic emission spectrometry and ion chromatography. The major PM10 sources were identified using positive matrix factorization (PMF). The average PM10 concentration in the tunnels was 200.8 ± 22.0 μg/m3. Elemental analysis indicated that the PM10 consisted of 40.4% inorganic species, 9.1% anions, 4.9% cations, and 45.6% other materials. Iron was the most abundant element, with an average concentration of 72.5 ± 10.4 μg/m3. The PM10 sources characterized by PMF included rail, wheel, and brake wear (59.6%), soil combustion (17.0%), secondary aerosols (10.0%), electric cable wear (8.1%), and soil and road dust (5.4%). Internal sources comprising rail, wheel, brake, and electric cable wear made the greatest contribution to the PM10 (67.7%) in tunnel air.
Implications
With installation of a platform screen door, PM10 levels in subway tunnels were higher than those on platforms. Tunnel PM10 levels exceeded 150 μg/m3 of the Korean standard for subway platform. Elemental analysis of PM10 in a tunnel showed that Fe was the most abundant element. Five PM10 sources in tunnel were identified by positive matrix factorization. Railroad-related sources contributed 68% of PM10 in the subway tunnel.
Introduction
In urban areas, the subway system is the most efficient and convenient mode of commuter transportation. In Seoul, the subway system is a major form of transportation and accounts for ˜36.2% of the total transportation in the city (Seoul, 2010). Seoul is served by nine subway lines with a total of 358 stations and transports 6.7 million passengers daily (Jung et al., Citation2010). Subway passengers and workers can develop air pollution problems because the subway system is typically a confined space exposed to pollution from various sources. The health of subway passengers and employees is of great concern, considering the potentially high levels of air pollution combined with prolonged exposure times (Kim et al., Citation2006).
Particulate matter with an aerodynamic diameter less than 10 μm (PM10) is one of the major pollutants in subway environments. Many studies have reported that the PM concentrations in subway systems were significantly higher than those measured in ambient air (Aarnio et al., Citation2005; Kim et al., Citation2008; Salma et al., Citation2007, 2009; Ripanucci et al., 2009; Jung et al., Citation2010; Kam et al., Citation2011; Querol et al., Citation2012). Studies show that the PM in tunnels can move into the cabin of a train travelling on the subway (Seaton et al., Citation2005; Gustavsson et al., Citation2008). Particulate matter in a subway originates mainly from the movement of trains and passengers and accumulates in the closed environment (Park et al., Citation2013).
Recently, a platform screen door (PSD) system has been installed in many metropolitan subway systems worldwide to reduce the risk of passenger accidents and to improve safety in the event of a train fire (Yang et al., Citation2011). In addition, the PSD could improve the air quality on indoor platforms by blocking the train-induced airflow in subway tunnels. The average PM10 levels at the subway platform were reduced significantly after installing a PSD in Seoul, Korea (Lee et al., Citation2010; Kim et al., Citation2012). However, the tunnel air quality after installation of the PSD has not been investigated. Since the subway tunnel becomes a more enclosed environment as a consequence, both subway workers and passengers might be exposed to more airborne particulate matter in the tunnel and inside the subway passenger cabins. This study measured the PM10 levels in the tunnel of Seoul Metropolitan Subway Line 4 for 12 days and identified the sources. The chemical properties of the PM10 samples were determined by elemental analysis and the local particulate sources were identified using receptor modeling.
Materials and Methods
Seoul Metropolitan Subway Line 4 was selected for evaluation of tunnel air quality. Line 4 has a total length of 31.7 km between Sadang and Danggogae, an average depth of ˜14.0 m, and 25 stations. Travel from one end of the line to the other takes 53 min. In total, 47 trains with 470 cabins operate on the line. The travel time between stations ranges from 2.5 to 5.5 min. As of 2012, the line carried ˜306 million passengers annually and an average of 840,000 passengers daily (Seoul Metro, 2012).
Forty-eight PM10 samples were collected in the tunnel between the Gireum, Miasageori, and Mia stations on Line 4 in metropolitan Seoul from October 12 to 24, 2012, by sampling for 24 hr on each of the 12 days at four points in the tunnel. However, four samples were damaged, leaving 44 for analysis. The tunnel is a single wide tunnel with two tracks. The total length from Gireum to Mia was 1,440 m at an average depth of ˜25 m. PSDs had been installed in all of the stations. The PM10 samples were collected on 47-mm quartz filters (QMA filter 47 mm, Whatman) using a mini-volume air sampler (model PAS 201, Air Metrics). The flow rate was adjusted to 5 L min−1 based on the ambient temperature and pressure in each 24-hr period. All of the filters were weighed before and after sampling with an analytical balance (A&D, model HM-202) with 0.01 mg sensitivity after stabilizing the filter under a constant temperature and humidity for 3 days in an electronic desiccator (model Oyin 09678BN, Sanplatec).
The filter paper was cut in half using ceramic scissors. Each half of the filter paper was preprocessed for analysis of the inorganic components and iron content. Preprocessing for the inorganic component (IC) analysis complied with the preprocessing standard of the US Clean Water Act. We used the nitric acid/hydrochloric acid preprocessing method with a microwave (model MARS5, CEM). The sample was put in a perfluoroalkoxy polymer resin (PFA) liner and mixed with 7 mL of 61% nitric acid and 3 mL of 35% hydrochloric acid. This mixture was maintained at 150 psi for 10 min to extract the inorganic components. The extracted solution was filtered using filter paper (number 5B, 110 mm, Advance MFS), diluted with 50 mL of ultrapure water, and then refrigerated at 4°C until analysis. The solution was analyzed for 13 inorganic components, namely Mg, Al, Si, Ti, V, Cr, Mn, Fe, Ni, Cu, Zn, Ba, and Pb, using inductively coupled plasma–atomic emission spectrometry (ICP-AES; DRE ICP, Leeman Labs).
Preprocessing for analysis of the water-soluble ion content involved soaking the filter paper in 30 mL of ultrapure water and extracting it with an ultrasonic extractor (Model 5210R-DTH, Branson Ultrasonics). To prevent the column from clogging during the IC analysis, the extracted solution was filtered using sterile 47-mm-diameter membrane filter paper (Whatman) with 0.45-μm pores; the filtered solution was refrigerated in a 60-mL narrow mouth bottle (Nalgene) at 4°C. We used ion chromatography (model DX-400, Dionex) to evaluate the extracted water-soluble ion content. Three anions (NO3−, SO42–, and Cl−) were analyzed using an AS12A column.
Prior to use of ICP-AES and IC, several standard solutions with similar level of sample concentration were injected to examine quality assurance. An accuracy check was performed by calculating a relative error (RE) resulting from standard solutions, and a precision check was performed by obtaining relative standard deviation and a coefficient of variation (CV) based on three repetitive measurements.
For positive matrix factorization (PMF), the calculated factor loading is always positive and does not depend on the correlation matrix data, but instead on the least-square minimization of the individual data value. Therefore, PMF depends on the error estimation of the individual data value. DOS version PMF2 software was applied to identify the sources. The PMF model equation can be expressed as
In a PMF model, the values of the G and F series are always positive and can be obtained by minimizing the Q value. The Q value is useful for determining the optimal number of factors (Paatero, Citation1997) and can be calculated with
An important variable in PMF analysis is the nondimensional explained variation (EV). The EV of the jth chemical species of the kth element can be calculated with
To evaluate the PM10 pollution sources in subway passenger cabins quantitatively using PMF, the raw data must be reorganized and input into the model. Here, the data for PMF modeling were organized into a 30 × 16 matrix composed of 13 inorganic components (Mg, Al, Si, Ti, V, Cr, Mn, Fe, Ni, Cu, Zn, Ba, and Pb) and three anions (Cl−, NO3−, and SO42–). Q-mode was used to organize the samples, with the samples given in the rows and the concentration of each sample in the columns. When there are incomplete data sets containing data below detection limit or missing data, there are several methods to substitute by approximated values. For this study, values below the detection limit were replaced by ½ of the detection limit, while unmeasured values were replaced by the geographical average of the particular chemical species described in the previous reports (Polissar et al., Citation1998; Lee et al., Citation2002). This individual data point weighting permits the influence of the values to be related to the level of confidence the analyst has in the data.
To perform PMF modeling, the uncertainty of the measurements, in addition to the values discussed already, is required. The uncertainty Sij (error) can be calculated using eq 4 (Polissar et al., Citation1998):
Results and Discussion
lists the PM10 and concentrations of 18 elements in the tunnel of the Seoul Metropolitan Subway Line 4. The average PM10 concentration in the subway tunnel was 200.75 ± 21.99 (range 153.4–252.1) μg/m3. The PM10 concentrations in the tunnel were 2.6- and 2.9-fold higher than the levels on the subway platform (77.4 μg/m3) and in the cabins (68.4 μg/m3), respectively (Park et al., Citation2012; Park et al., Citation2013). The levels in the subway tunnel always exceeded the 150 μg/m3 Korean standard for subway platforms.
Table 1. Summary of the PM10 concentration and elemental composition in the subway tunnel
Of the inorganic components, iron was present at the highest concentration, with an average of 72.51 ± 10.37 (range 49.14–97.66) μg/m3. The average concentrations of the other inorganic components in μg/m3 were Si 3.03 ± 1.18, Cu 2.35 ± 0.38, Ba 1.19 ± 0.25, Mn 0.60 ± 0.12, Zn 0.51 ± 0.34, Al 0.36 ± 0.11, Pb 0.23 ± 0.13, Cr 0.22 ± 0.30, Ni 0.15 ± 0.15, and Ti 0.04 ± 0.01. The average concentrations of the ions in μg/m3were NO3− 10.17 ± 7.68, SO42– 6.54 ± 2.07, Ca2+ 6.15 ± 3.03, Cl− 1.45 ± 1.47, K+ 1.40 ± 1.33, Na+ 1.32 ± 1.67, and Mg2+ 0.95 ± 0.54. The proportion (%) of each species in inorganic component was Fe 89.3, Si 3.7, Cu 2.9, Ba 1.5, Mn 0.75, Zn 0.63, Al 0.44, Pb 0.29, Cr 0.27, Ni 0.19, and Ti 0.05. The proportion (%) of each species in ion components was NO3− 36.3, SO42– 23.4, Ca2+ 30.0, Cl− 5.2, K+ 5.0, Na+ 4.73, and Mg2+ 3.4. The analysis indicated that the PM10 consists of 40.4% inorganic species, ions 13.9%, and 45.6% other materials, including organic and inorganic carbons and other unmeasured components. By the result of other studies, the chemical composition of subway tunnel particles by the XRD method is the oxidation form, SiO2, CaCO3, TiO2, FeOx, and so on (Jung et al., Citation2010).
At 36.1%, the iron content comprised the greatest fraction of the PM10 in the subway tunnel. A large Fe fraction was also reported in PM10 near urban railways. The Fe content in PM10 at above1ground platforms, underground platforms, and electric cabins ranged from 64–71% (Colombi et al., Citation2013; Park et al., Citation2013). Fe-containing subway particles are generated mainly by mechanical wear and friction processes at the rail-wheel brake interfaces, and at the interface between the catenaries providing electricity to the subway trains. The major source of Fe particles is the movement of the train on the rails (Jung et al., Citation2010).
shows the correlation analysis of 18 elements. Fe was significantly correlated with Mn (r = 0.86), Cu (r = 0.62), Al (r = 0.45), and Ba (r = 0.44). Ba was also correlated with Cu (r = 0.78) and Ti (r = 0.64). Fe, Ba, and Mn are present in the materials used to manufacture rails and wheels (Chan and Stachowiak, Citation2004), and iron and manganese dust accounted for the measurable, albeit small, increases in PM concentrations observed near railway lines (Gehrig et al., Citation2007; Bukowiecki et al., Citation2007).
Table 2. Correlation analysis of the elemental species and ions in PM10
The Fe/Mn ratio was used to evaluate the impact of a railroad on atmospheric PM10 (Bukowiecki et al., Citation2007). In this study, the mean Fe/Mn concentration ratio was 121, which was similar to the ratio of 122 determined on a platform (Park et al., Citation2013). The Fe/Mn ratio is comparable to the ratios of 107 obtained for New York (Chillrud et al., Citation2004), 92 for Helsinki (Aarnio et al., Citation2005), and 108 for Budapest (Salma et al., Citation2007). These ratios are similar to the typical elemental compositions of the rails and electric sliding collectors (Salma et al., Citation2007). This suggests that the contributions of railroad sources in subways are similar in most countries.
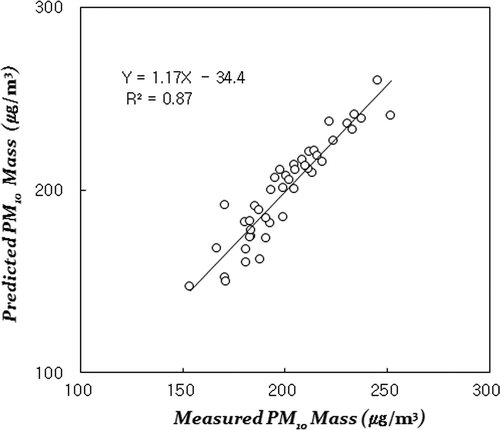
The PMF analysis identified five factors as sources of PM10 pollution in the subway tunnel. A method to find out the number of optimal factor is using the Q value described in eq 2. This step minimizes the difference between true measured value and theoretical value. After choosing the number of factors, modeling was conducted by repeatedly increasing 0.1 of FPEAK between –1.0 and 1.0. The parameter FPEAK was used to control rotations. The rotational matrix explaining uncertainty of factor rotation is used as a criterion by determining degree of freedom. Generally, optimum degree of rotational freedom can be determined with preserving a certain limit of Q values (Han et al., Citation2006; Kim et al., Citation2003). Optimum modeling conditions for FPEAK and Q value used in our study are 0.2 and 427.9. shows the correlation between the measured PM10 mass concentration and the PM10 concentration predicted by standardization after PMF modeling. The coefficient of determination (R2) between the PM10 mass concentrations was 0.87, indicating that the model accurately predicted the measurements.
Figure 1. Comparison of the measured PM10 concentrations and the values predicted by PMF.
shows the subway tunnel PM10 pollution source profile and EV calculated using PMF modeling. For the first pollution source, the Ni, Cr, SO42–, and Ca2+ EV values were high, and the Cr and Ni EV were 0.7 and 0.5 respectively. The first source could be identified as various types of oil combustion. Cr and Ni are markers of oil combustion in the fine fraction (Lee et al., Citation2002; Morawska and Zhang, Citation2002). These markers are emitted mainly from diesel oil or residual oil combustion. In the profiles, Ca2+ and SO42– were present at high mass fractions. Calcium is generally emitted by the wear of brake linings, tires, and clutch plates and by asphalt road surfaces, mainly in the coarse mode (Monte and Rossi, Citation2000; Kupiainen et al., Citation2005). These elements can be generated by the diesel vehicles used to repair the subway rails at night and can enter underground subway tunnels through vents. The contribution of oil combustion to the PM10 level in the subway tunnel was 17.0% (33.8 μg/m3). This is similar to the contributions of outdoor-related sources, including oil combustion and vehicles (4.0% and 6.0%, respectively) reported for PM10 in the subway tunnel (Park et al., Citation2013).
Figure 2. The source profile and EV calculated using PMF modeling.
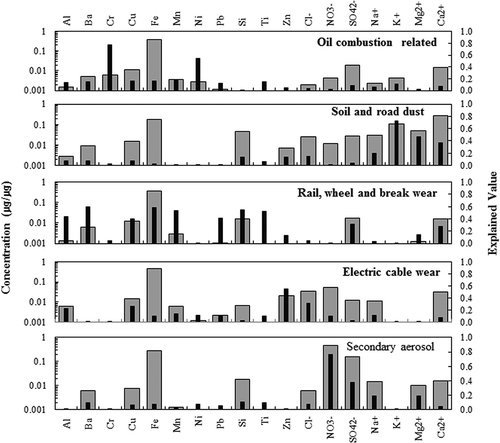
The second source, soil and road dust, included Ca2+, K+, Mg2+, Si, and SO42–, which had EV > 0.5. Si was reported to be present as a fraction >10% of a typical soil source for coarse particles (Chow, Citation1995; Watson and Chow, Citation1994; Watson et al., Citation2002). These elements in outdoor soil and road dust can enter a subway tunnel through vents. The crustal particles originate from unpaved roads, construction sites, and windblown soil dust. As shown in , soil and road dust contributed 5.4% (10.7 μg/m3) of the PM10. A previous PMF study (Jung et al., Citation2010) reported a 7.2–10.6% contribution to the PM10 mass concentration in subway tunnels.
The third source was rail, wheel, and brake wear, originating mostly from indoor emissions due to the movement of trains. Fe, Mn, Si, Ba, and Ca2+ are markers of railroad operations and are generated by the abrasion of the railroad tracks and brakes during subway operation. Pollution related to rail, wheel, and brake wear accounted for 59.6% (118.9 μg/m3) of the PM10 in the subway tunnel, which was the highest of all sources identified in this study. Rail-, wheel-, and brake-related sources have been reported to contribute to the PM10 detected in subway tunnels and on platforms (Gehrig et al., Citation2007; Jung et al., Citation2010; Lee et al., Citation2010; Colombi et al., Citation2013; Park et al., Citation2013).
Zn, Cu, Cl−, and Ca2+ accounted for a large proportion of the fourth source profile. Zn and Cu were present at relatively high levels and were classified as being related to electric cables. Zn and Cu are markers of subway operations and are generated by abrasion of the power supply lines during subway operation (Park et al., Citation2012). Pollution related to electric cable wear accounted for 8.1% (16.2 μg/m3) of the PM10 in the subway tunnel.
The fifth factor was characterized as secondary aerosols based on presence of NO3− and SO42+. This source might include local and regional sources because formation of particulate SO42–, NO3−, and NH4+ from gaseous SO2, NO2, and NH3 requires time. In this study, the NH4+ content was not measured, but it is likely that the NO3− and SO42+ ions bonded with NH4+, resulting in formation of nitrate and sulfate particles. Once released to the ambient atmosphere, these are converted predominantly to NH4NO3 and (NH4)xSO4 (x = 0 to 2) via homogeneous or heterogeneous photochemical processes (Watson and Chow, Citation1994; Khoder, Citation2002; Wilson et al., Citation2002). Nitrate and sulfate aerosols were also present in significant amounts in subway aerosol samples, and contributed 10.0% (19.9 μg/m3) of the PM10. These secondary aerosols containing nitrates and sulfates must originate from the outdoor environment, because they are abundant in samples taken outdoors (Jung et al., Citation2010; Lee et al., Citation2010; Park et al., Citation2013).
PMF analysis of PM in the subway tunnel was used to determine the importance of internal sources. The sources can be apportioned by comparing outdoor and tunnel PM. In further studies, outdoor aerosols should be collected near the subway stations to compare the composition of indoor and outdoor aerosols. To understand subway tunnel emission sources in more detail, it is necessary to investigate additional chemicals, such as carbon compounds and other inorganic elements, and to develop more marker species for specific sources. Although we identified five sources of PM10 in the subway tunnel using PMF modeling, this was based on measurements made during the fall, not the other three seasons. As the primary sources of PM10 might differ seasonally, further research on the sources of PM10 in the tunnel according to season is needed.
Conclusion
The average PM10 concentration in the tunnels of Seoul Metropolitan Subway was significantly higher than on the subway platform. The PM10 in the tunnel consisted of 40.4% inorganic species, 9.1% anions, 4.9% cations, and 45.6% other materials. The iron fraction was the highest, contributing 36.1% of the PM10 concentration in the subway tunnel. Major contributors in the subway tunnel were rail, wheel, and brake wear (59.6%), oil combustion (17.0%), secondary aerosols (10.0%), electric cable wear (8.1%), and soil and road dust (5.4%). The internal sources, that is, rail, wheel, brake, and electric cable wear, were the major contributors of PM10 in the subway tunnel, at 67.7%. To reduce PM levels, it is important to manage internal sources in subway tunnels. The source apportionment study based on PMF was useful to control specific emission sources in subway tunnel to provide recommendations for reducing PM10 levels in the subway tunnels so as to meet the Korean standard for subway platforms.
Funding
The work described in this paper was supported by research grants on the Basic Research Project of Korea by Ministry of Science, ICT, and Future Planning, and Railway Technology Research Project by Minister of Land, Infrastructure and Transport (14RTRP-B081249-01).
Additional information
Notes on contributors
Duckshin Park
Duckshin Park is a principal researcher and Doyeon Hwang, Wonseok Jung, and Yongil Lee are researchers at Korea Railroad Research Institute, Uiwang, Korea.
Taejeong Lee
Taejeong Lee is a research assistant professor and Dongsool Kim is a professor at Kyung Hee University, Yongin, Korea.
Doyeon Hwang
Duckshin Park is a principal researcher and Doyeon Hwang, Wonseok Jung, and Yongil Lee are researchers at Korea Railroad Research Institute, Uiwang, Korea.
Wonseok Jung
Duckshin Park is a principal researcher and Doyeon Hwang, Wonseok Jung, and Yongil Lee are researchers at Korea Railroad Research Institute, Uiwang, Korea.
Yongil Lee
Duckshin Park is a principal researcher and Doyeon Hwang, Wonseok Jung, and Yongil Lee are researchers at Korea Railroad Research Institute, Uiwang, Korea.
KiChul Cho
KiChul Cho is an associate professor at Dongnam Health College, Suwon, Korea.
Dongsool Kim
Taejeong Lee is a research assistant professor and Dongsool Kim is a professor at Kyung Hee University, Yongin, Korea.
Kiyoung Lee
Kiyoung Lee is a professor at Seoul National University, Seoul, Korea.
References
- Aarnio, P., T. Yli-Tuomi, A. Kousa, T. Mäkela, A. Hirsikko, K. Hämeri, M. Räisänen, R. Hilamo, T. Koskentalo, and M. Jantunen. 2005. The concentration and composition of and exposure to fine particles (PM2.5) in the Helsinki subway system. Atmos. Environ. 39:5059–5066. doi:10.1016/j.atmosenv.2005.05.012
- Bukowiecki, N., G. Robert, H. Matthias, L. Peter, N.Z. Christoph, B. Brigitte, W. Ernest, and B. Urs. 2007. Iron, manganese and copper emitted by cargo and passenger trains in Zurich (Switzerland): Size-segregated mass concentrations in ambient air. Atmos. Environ. 41:878–889. doi:10.1016/j.atmosenv.2006.07.045
- Chan, D., and G.W. Stachowiak. 2004. Review of automotive brake friction materials. Proc. Inst Mech. Eng. Part D J. Automobile Eng. 218:953–966. doi:10.1243/0954407041856773
- Chillrud, S.N., E. David, M.R. James, N.S. Sonja, P. Dee, D.S. John, and L.K. Patrick. 2004. Elevated airborne exposures of teenagers to manganese, chromium, and iron from steel dust and New York City’s subway system. Environ. Sci. Technol. 38(3): 732–737. doi:10.1021/es034734y
- Chow, J.C. 1995. Measurement methods to determine compliance with ambient air quality standards for suspended particles. J. Air Waste Manage. Assoc. 45:320–382. doi:10.1080/10473289.1995.10467369
- Colombi, C., S. Angius, V. Gianelle, and M. Lazzarini. 2013. Particulate matter concentrations, physical characteristics and elemental composition in the Milan underground transport system. Atmos. Environ. 70:166–178. doi:10.1016/j.atmosenv.2013.01.035
- Gehrig, R., M. Hill, P. Lienemann, C.N. Zwicky, N. Bukowiecki, E. Weingartner, U. Baltensperger, and B. Buchmann. 2007. Contribution of railway traffic to local PM10 concentrations in Switzerland. Atmos. Environ. 41:923–933. doi:10.1016/j.atmosenv.2006.09.021
- Gustavsson, P., C. Bigert, and M. Pollán. 2008. Incidence of lung cancer among subway drivers in Stockholm. Am. J. Ind. Med. 51(7): 545–547. doi:10.1002/(ISSN)1097-0274
- Han, J.S., K.J. Moon, S.J. Lee, Y.J. Kim, S.Y. Ryu, S.S. Cliff, and S.M. Yi. 2006. Size-resolved source apportionment of ambient particles by positive matrix factorization at Gosan background site in East Asia. Atmos. Chem. Physics 6:211–223. doi:10.5194/acp-6-211-2006
- Jung, H.J., B.W. Kim, J.Y. Ryu, S. Maskey, J.C. Kim, J. Sohn, and C.U. Ro. 2010. Source identification of particulate matter collected at underground subway stations in Seoul, Korea using quantitative single-particle analysis. Atmos. Environ. 44:2287–2293. doi:10.1016/j.atmosenv.2010.04.003
- Kam, W., K. Cheung, N. Daher, and C. Sioutas. 2011. Particulate matter (PM) concentrations in underground and ground-level rail systems of the Los Angeles Metro. Atmos. Environ. 45:1506–1516. doi:10.1016/j.atmosenv.2010.12.049
- Khoder, M.I. 2002. Atmospheric conversion of sulfur dioxide to particulate sulfate and nitrogen nitric acid in an urban area. Chemosphere 49:675–684. doi:10.1016/S0045-6535(02)00391-0
- Kim, E., T.V. Larson, P.K. Hopke, C. Slaughter, L.E. Sheppard, and C. Claibom. 2003. Source identification of PM2.5 in an arid northwest U.S. city by positive matrix factorization. Atmos. Research 66:291–305. doi:10.1016/S0169-8095(03)00025-5
- Kim, K.Y., D.X. Ho, J.S. Jeon, and J.C. Kim. 2012. A noticeable shift in particulate matter levels after platform screen door installation in a Korean subway station. Atmos. Environ. 49:219–223. doi:10.1016/j.atmosenv.2011.11.058
- Kim, K.Y., Y.S. Kim, Y.M. Roh, C.M. Lee, and C.N. Kim. 2008. Spatial distribution of particulate matter (PM10 and PM2.5) in Seoul Metropolitan Subway stations. J. Hazard. Mater. 154:440–443. doi:10.1016/j.jhazmat.2007.10.042
- Kupiainen, K.J., H. Tervahattu, M. Raisanen, T. Makela, M. Aurela, and R. Hillamo. 2005. Size and composition of airborne particles from pavement wear, tires, and traction sanding. Environ. Sci. Technol. 39:699–706. doi:10.1021/es035419e
- Lee, J.H., Y. Yoshida, B.J. Turpin, P.K. Hopke, R.L. Poirot, R.J. Lioy, and J.C. Oxley. 2002. Identification of sources contributing to Mid-Atlantic regional aerosol. J. Air Waste Manage. Assoc. 52(10): 1186–1205. doi:10.1080/10473289.2002.10470850
- Lee, T.J., J.S. Jeon, S.D. Kim, and D.S. Kim. 2010. A comparative study on PM10 source contributions in a Seoul metropolitan subway station before/after installing platform screen doors. J. Kor. Soc. Atmos. Environ. 26(5): 543–553. doi:10.5572/KOSAE.2010.26.5.543
- Monte, M.D., and P. Rossi. 2000. Aerosol Chemical Processes in the Environment, ed. K.R. Spurny. New York, NY: Lewis.
- Morawska, L., and J. Zhang. 2002. Combustion sources of particles. 1. Health relevance and source signatures. Chemosphere 49:1045–1058. doi:10.1016/S0045-6535(02)00241-2
- Paatero, P., and U. Tapper. 1994. Positive matrix factorization: A nonnegative factor model with optimal utilization of error estimates of data values. Environmetrics 5:111–126. doi:10.1002/(ISSN)1099-095X
- Paatero, P. 1997. Least squares formulation of robust non-negative factor analysis. Chemom. Intell. Lab. Syst. 37:23e–35. doi:10.1016/S0169-7439(96)00044-5
- Park, D., M. Oh, Y. Yoon, E. Park, and K. Lee. 2012. Source identification of PM10 pollution in subway passenger cabins using positive matrix factorization. Atmos. Environ. 49:180–185. doi:10.1016/j.atmosenv.2011.11.064
- Park, S.B., S.N. Lee, T.J. Ko, H.K. Bae, S.J. Kim, S.D. Park, D. Sohn, and D.S. Kim. 2013. Identification of PM10 chemical characteristics and sources and estimation of their contributions in a Seoul metropolitan subway station. J. Kor. Soc. Atmos. Environ. 29(1): 74–85. doi:10.5572/KOSAE.2013.29.1.74
- Polissar, A.V., P.K. Hopke, and P. Paatero. 1998. Atmospheric aerosol over Alaska, 2. Elemental composition and sources. J. Geophysic. Res. Atmos. 103(D15): 19045–19057. doi:10.1029/98JD01212
- Polissar, A.V., P.K. Hopke, R.D., and Poirot. 2001. Atmospheric aerosol over Vermont: Chemical composition and sources. Environ. Sci. Technol. 35: 4604–4621. doi:10.1021/es0105865
- Querol, X., T. Moreno, A. Karanasiou, C. Reche, A. Alastuey, M. Viana, O. Font, J. Gil, E. De Miguel, and M. Capdevila. 2012. Variability of levels and composition of PM10 and PM2.5 in the Barcelona metro system. Atmos. Chem. Phys. 12:5055–5076. doi:10.5194/acp-12-5055-2012
- Ripanucci, G., M. Grana, L. Vicentini, A. Magrini, and A. Bergamaschi. 2006. Dust in the underground Railway Tunnels of an Italian town. J. Occup. Environ. Hyg. 3:16–25. doi:10.1080/15459620500444004
- Salma, I., M. Pósfai, K. Kovács, E. Kuzmann, Z. Homonnay, and J. Posta. 2009. Properties and sources of individual particles and some chemical species in the aerosol of a metropolitan underground railway station. Atmos. Environ. 43:3460–3466. doi:10.1016/j.atmosenv.2009.04.042
- Salma, I., T. Weidinger, and W. Maenhaut. 2007. Time-resolved mass concentration, composition and sources of aerosol particles in a metropolitan underground railway station. Atmos. Environ. 41:8391–8405. doi:10.1016/j.atmosenv.2007.06.017
- Seaton, A., J. Cherrie, M. Dennekamp, K. Donaldson, J.F. Hurley, and C.L. Tran. 2005. The London underground: dust and hazards to health. Occup. Environ. Med. 62:355–362. doi:10.1136/oem.2004.014332
- Seoul. 2012. http://stat.seoul.go.kr ( accessed April 2, 2014).
- Song, X.H., A.V. Polissar, and P.K. Hopke. 2001. Source of fine particle composition in the northeastern US. Atmos. Environ. 35(31): 5277–5286. doi:10.1016/S1352-2310(01)00338-7
- Watson, J.G., and J.C. Chow. 1994. Ammonium nitrate, nitric acid and ammonia equilibrium in wintertime phoenix Arizona. J. Air Waste Manage. Assoc. 44:405–412. doi:10.1080/1073161X.1994.10467262
- Watson, J.G., T. Zhu, J.C. Chow, E.J. Engelbrecht, E.M. Fujita, and W.E. Wilson. 2002. Receptor modeling application framework for particle source apportionment. Chemosphere 49:1093–1136. doi:10.1016/S0045-6535(02)00243-6
- Wilson, W.E., J.C. Chow, C. Claiborn, W. Fusheng, E.J. Engelbrecht, and J.G. Watson. 2002. Monitoring of particulate matter outdoors. Chemosphere 49:1009–1043. doi:10.1016/S0045-6535(02)00270-9
- Yang, J., Y. Yang, H.L. Wang, and L. Shi. 2011. Effect of the open ways of screen doors on fire smoke in a subway platform. Procedia Engineering 11: 416–423. doi:10.1016/j.proeng.2011.04.677