
Introduction
The 2014 Critical Review (CR) (Grahame et al., Citation2014) follows several previous Air and Waste Management Assocation (A&WMA) CRs of relationships between air pollution and human health (Chow et al., Citation2006; Ferris, Citation1978; Goldstein, Citation1983; Mukerjee, Citation1998; Pope and Dockery, Citation2006; Vedal, Citation1997; Watson et al., Citation1997), with an emphasis on an important component of regulated PM2.5 and PM10 exposure: elemental or “black” carbon (EC and BC). The CR summarizes past and recent epidemiological and toxicological studies relating various health outcomes to BC exposures, usually as part of a mixture of pollutants from incomplete combustion processes. The CR emphasizes studies of BC from engine exhaust, especially near roadways, observing that diesel engine exhaust is still the major source of this component in the United States, Canada, Japan, and Western Europe. Exposures to and effects from domestic biomass- and coal-burning emissions are examined primarily for developing countries where solid fuels are used for cooking and heating, creating much higher exposures than those observed in more developed countries. Since BC is a primary pollutant that often accumulates near its emitters (e.g., highly trafficked roadways), the CR observes that human exposure error is large when urban-scale monitors (Chow et al., Citation2002; U.S. Environmental Protection Agency [EPA], Citation1997) are used to establish relationships between BC concentrations and exposure, probably underestimating the true effects on public health. The CR concludes that the evidence for BC effects on health meets the EPA criteria for health risk with respect to: (1) consistency of observed associations; (2) coherence between epidemiology and other studies; (3) biological plausibility; (4) biological gradient for a dose-response function; and (5) experimental evidence of changes in exposure and health effects. The CR advocates for going beyond PM2.5 and PM10 mass as indicators of adverse health effects in future air quality regulations, with a special emphasis on the BC component.
As with all A&WMA CRs, expert discussants have provided different views on Grahame et al. (Citation2014). Each of the discussants feels that the 2014 CR is a useful contribution to the topic of relating air pollution to health effects, but that there are some omissions and limitations. They note their agreements and disagreements with its content and conclusions, provide additional information and perspective, and suggest additional resources for more in-depth study of the topic in the following subsections. The appearance of these discussants as co-authors does not necessarily indicate their agreement with the opinions of other discussants.
Comments by Daniel S. Greenbaum
The extent to which some components or sources of PM air pollution are more toxic than others is of public health and policy importance as society attempts to reduce PM population exposures. The CR correctly notes the importance of reviewing the means of assessing exposure in each study mentioned. The Health Effects Institute’s (HEI, Citation2010) recent review of exposure and health effects for traffic-related air pollution found that incorrect exposure estimation can be an important error source. The CR also notes recent improvements in emission performance by diesel engines (an important BC source in the developed world), but it could have better examined recent improvements made by new engine technologies that are rapidly replacing older diesels and that now constitute more than 30% of U.S. on-road trucks and buses. The extensive and rigorous testing by the Advanced Collaborative Emissions Study (Khalek et al., Citation2011) found a 98% reduction in particle mass for 2007 heavy-duty vehicles (when compared to relatively new 2004 engines), a 90–99% reduction in total particle number, the near-absence of carbonaceous particulate matter (PM), and a large number of polycyclic aromatic hydrocarbons (PAHs) below detection limits. Despite these emission reductions, which are likely to result in major exposure reductions in North America, Japan, and Europe where diesel exhaust has been estimated as the largest BC contributor in the past (Bond et al., Citation2013), the CR’s focus on diesel as the major cause of worldwide BC exposure is incorrect.
Public health and policy discussions about the benefits of addressing PM exposure has been driven by benefit estimates based on studies of long-term effects (EPA, Citation2011). Although the CR includes a few broader studies of such effects (e.g., Brunekreef et al., Citation2009; Lipfert et al., Citation2006a, Citation2006b), its conclusions seem to be based on short-term exposure studies. Given that the associations found in the long-term studies are larger than those in short-term studies, there is a strong possibility that different biological mechanisms are involved. Relying only on short-term studies to determine the relative toxicity (and health causality) of BC and other PM components is incomplete.
Two recent systematic efforts (not included in the CR) have addressed the effects of different PM components in long-term cohort studies completed as part of the HEI National Particle Component Toxicity (NPACT) program (Lippmann et al., Citation2013; Vedal et al., Citation2013). These studies conducted PM-component and source analyses with three major populations—the American Cancer Society (ACS), Women’s Health Initiative (WHI), and Multi-ethnic Study of Atherosclerosis (MESA) cohorts—for which such analyses had not previously been done. Some evidence of BC and traffic effects was found in the ACS cohort (Lippmann et al., Citation2013), but not in the WHI or MESA cohorts (Vedal et al., Citation2013), where organic carbon (OC) was more consistently associated with adverse effects. The Lippmann et al. (Citation2013) analyses used central monitor exposure estimates, which the CR identifies as a major source of exposure error. The Vedal et al. (Citation2013) analyses used detailed component measurements both at central sites and at a sample of participant homes, land use regression, and dispersion modeling to better estimate exposure. The NPACT studies also included extensive toxicological testing with 50-day and 6-month exposures of mice prone to develop cardiovascular disease with a mix of responses that did not consistently point to a causative relationship with BC. Based on the results, the HEI NPACT Review Panel (HEI, Citation2013) concluded that “the studies do not provide compelling evidence that any specific source, component, or size class of PM may be excluded as a possible contributor to PM toxicity.”
The CR correctly observes that the identification of causality for any particular exposure requires a systematic approach to appraise the literature and its consistency with the EPA causality principles (cited above). However, the CR does not recognize the EPA’s own conclusion at the last systematic review (EPA, Citation2009a) of the evidence regarding different PM components: “Overall, the results … indicate that many constituents of PM can be linked with differing health effects and the evidence is not yet sufficient to allow differentiation of those constituents or sources that are more closely related to specific health outcomes” (emphasis added).
Although the CR examines many health studies and identifies important questions about the best means to estimate BC exposure as part of systematically assessing causality, it does not make a compelling case that BC by itself has toxicity and effects that are significantly different from the other PM components and sources.
Comments by Ronald E. Wyzga
The CR does not address, possibly owing to a lack of sufficient evidence, the extent to which BC by itself is responsible for observed health effects or whether it is a surrogate for other pollutants with which it is present in the ambient environment. There are related questions, some of which have been partially addressed by the CR: (1) How important is BC as a PM component compared to other PM components? (2) Do other components relate to the same health effects as BC? (3) To what extent does BC interact with other pollutants to cause adverse health effects? (4) Is BC the correct metric to represent carbonaceous particles in the environment? The following comments address questions 1 and 2.
BC versus other PM components
Rohr and Wyzga (Citation2012) reviewed about 70 published studies that examined associations of health effects with PM2.5 mass and at least two components other than mass. These studies were conducted throughout the world, but largely focused on urban areas. Published study results were accepted at face value and no judgments were made regarding methodology, measurements, or locations. The results from single PM component models showed that sulfate, nitrate, ammonium, OC, BC, and crustal material (e.g., silicon) were each associated with some health effects in at least one of the studies. Given that each study addressed variable components, and that many of them did not use multipollutant models or methods to identify those components with the strongest associations with health, it is difficult to draw definitive conclusions about the relative potency of an individual component. This is also true of many studies that looked at chronic health responses. Identifying the most potent components is further complicated because different components have different human exposure errors; that is, the difference between personal exposures and ambient measurements differs across components. This difference has consequences for exposure/response factors that were not addressed by any of the studies examined by Rohr and Wyzga (Citation2012). By and large, those components with the smallest measurement and exposure error will preferentially demonstrate greater association with health effects.
Among components, carbon-containing particles showed more associations with health responses than PM2.5 mass or any PM2.5 component. Of the 28 epidemiological studies that considered cardiovascular disease (CVD) response to carbonaceous PM, 24 found a significant association. For respiratory outcomes, 15 of 26 studies found significant associations, and for asthma, 7 of 10 studies found significant associations. Fewer significant associations were found for the other PM2.5 components. The results for toxicological studies were similar to those of the epidemiological studies.
Is BC the best metric?
BC is defined by its measurement method. Historically, this method has been the degree of darkening of PM collected on a filter, usually determined by the attenuation of light transmitted through or reflected from the filter and deposit. More recently, EC from quartz-fiber filter samples is determined by thermal/optical methods, which assign the non-EC portion to OC. As noted in the CR, BC and EC are not always equivalent, but the terms are often used interchangeably. Among epidemiological studies, Rohr and Wyzga (Citation2012) found 25 studies that considered both BC (or EC) and OC. Of these, 12 studies reported significant associations for both BC and OC, 3 for BC only, and 5 for OC only. Results were similar for the toxicological studies. This suggests that it is important to consider OC as well as BC/EC. As OC and BC are often highly correlated, it is unclear which, if either, of the two is of greater consequence for potential health concerns. Consideration of BC alone may miss some potential health associations; even more important, risk management strategies aimed solely at BC could be misguided.
The issue is even more complicated since there are thousands of organic compounds (Grabowsky et al., Citation2011; Saraji-Bozorgzad et al., Citation2010) that constitute the BC/OC mixture, and only a small fraction of them has been quantified. Using a broad metric, such as BC or OC, does not allow discrimination among these diverse compounds. Kioumourtzoglou et al. (Citation2013) related PAHs, n-alkane, hopane, sterane, iso-/anteiso-alkanes, and cyclohexane groupings of organic compounds with emergency-department visits among the elderly in Atlanta, GA, Birmingham, AL, and Dallas, TX. Only the cyclohexane grouping was highly associated with health endpoints; the other organic groups showed little or no significant association with health endpoints. This result suggests that consideration of a broad “catchall” definition of carbonaceous particles, such as BC or OC, could underestimate the relationship between health and organic particles, as the broader indices may include many organic compounds that are potentially innocuous. This also has important implications for risk management strategies, which should ideally target those compounds most highly associated with health effects.
As with most National Ambient Air Quality Standard (NAAQS) indicators, including PM2.5, any of the measurements studied could serve as a marker or surrogate for some other agents, many of which are unmeasured. There are many organic gases that are rarely measured and are not included in air pollution health studies. Since many of these gases come from the same sources as carbonaceous PM, it could be that PM BC and OC serve as markers for such gases in health studies. It is also possible that carbonaceous (and other) particles may be agents that help deliver these gases into the deeper regions of the lung.
As the CR points out, the relationship between air pollution exposure and human health is complex, and carbonaceous particles appear to have a role in this relationship. It is not clear whether they per se are of health concern or if they are serving as indicators for other agent(s). There are many different types of particles in the ambient air; at present it is unclear how best to characterize these particles in describing their relationship to human health.
Comments by Michael T. Kleinman
Carbonaceous PM consists of a mix of liquid, oily droplets, aggregated particles made mostly of carbon, and aggregated particles coated with organic and inorganic constituents. There is much imprecision in the way these classifications are described, which makes it difficult to compare the results between different experiments and studies. While the classical definition of soot is the black substance formed by incomplete combustion that sticks to the sides of chimneys and ductwork, freshly emitted atmospheric soot consists of sphere-like aggregate structures made of graphene layers consisting mostly of pure carbon with minor amounts of hydrogen and oxygen.
PM OC concentrations, with which BC is often correlated, may play a larger role in promoting atherosclerosis than BC by itself. Delfino et al. (Citation2009) found that OC associated with particles in the quasi-ultrafine particles (UFP ≤ 180 nm) were more strongly related to increased levels of circulating biomarkers of coronary artery diseases. Araujo et al. (Citation2008) found that genetically modified mice (apoE–/–) developed atherosclerosis at an accelerated rate when exposed to ambient UFP near highly trafficked roads. Verma et al. (Citation2011) tested the hypothesis that removal of the OC from the particle would leave only the BC component and would mitigate the toxicity and adverse cardiac effects of PM inhalation. This was accomplished by concentrating southern California air and heating the sample to 50, 100, and 200°C to remove a portion of the OC and other volatile compounds. Denuding the particles reduced the particle mass and particle number concentration, with most of the mass lost composed of OC. The EC concentration remained the same for the denuded and non-denuded aerosol. The thermally denuded PM contained lower amounts of OC in general, with large reductions for high-molecular-weight PAHs that cause dysfunction when they are incubated with cardiac and arterial cells. The denuded particles had reduced potential for producing free radicals in a cell-free in vitro dithiothreitol (DTT) assay system (Verma et al., Citation2011). In a separate experiment, apoE–/– mice were exposed to non-denuded southern California PM. These mice showed progressive changes in heart-rate variability, increased plaque buildup in arteries, and increased peroxidation of circulating lipids as compared to mice exposed to purified air or particles that had been heated to 120°C.
The CR states that “Using the EPA rubric for judging causality, we conclude that there is a causal relationship between BC/EC for all cause and various CVD mortality and morbidity endpoints.” The controlled studies with southern California PM indicate that the OC component of the OC/BC mixture may be more associated with disease causality than the BC by itself. The CR also states that “in rapidly developing countries having high levels of air pollution, it is clear that concentrations of BC and PAHs are considerably higher than in the United States and Western Europe, and that adverse health outcomes are also highly elevated in these countries.” The potential causal role of certain organic components suggests that more specific metrics of air quality should be considered as opposed to “bulk” metrics such as PM mass, number, or BC content.
Comments by George M. Hidy
The CR is organized along the lines of a conventional presentation for this type of review within the framework embodied by regulatory rationalization supporting pollution standards: i.e., a list of descriptions from various studies with different exposures, populations, and health end-points. The CR falls short as a critical assessment of the literature, as do most pollution/health reviews, by not evaluating the strengths and weaknesses of studies reported (mainly since the 1990s). Some of the limitations in the BC health-related research may be the result of an inherent academic “silo” phenomenon. The health risk associated with any air pollutant derives from its physicochemical nature, measures of short-term and long-term exposures, and measures of toxicological responses to the airborne mixture. The scientific communities representing these areas tend to minimize the complexities of their respective knowledge relative to their own interests. There is substantial overlap between the sciences of air chemistry and exposure characterization. While this overlap is well known, the much weaker overlap among air chemistry, exposure science, and health science is less well appreciated, especially by the latter community. The health science community continues to rely on the simplest macroscopic picture of a single atmospheric species as a marker for adverse health effects. Their experimental designs for PM carbon exposure lack the means of sampling and analysis that would add insight into the varying size characterization and potential toxicity of EC as a carrier of species that may change with aging of the mixture between source and receptor.
There has been much progress in the last 25 years in understanding the nature and complexity of light-absorbing particles, which involve BC in various forms, but which may also include non-BC absorbers (Andreae and Gelencser, Citation2006; Bond and Bergstrom, Citation2006; Horvath, Citation1993; Moosmüller et al., Citation2009; Redmond et al., Citation2010; Watson, Citation2002). Nominal measurement of BC depends on instrumentation and on the ambiguities associated with brown carbon versus BC (Andreae and Gelencser, Citation2006). Atmospheric scientists recognize that BC is simply an index for a complex physicochemical mixture of which health scientists should be aware, and they should take this concept into account in design and interpretation of epidemiological and toxicological studies. At least two ambiguities are important for BC: (1) ill-defined particle size distributions, and (2) temporal and spatial variability in chemical interactions with other particles and reactive gases.
The characterization of BC-containing PM from combustion sources (soot) has taken place through various means. Microscopic images of fresh soot particles illustrate that the nanoparticles can be agglomerated into loose aggregates or chains falling into the accumulation mode, 0.1 to ˜2 μm diameter (e.g., Figure 13.11 in Friedlander, Citation2000). It is unclear how these agglomerates behave when they are inhaled into the lungs—whether they remain intact or break up and act as nanoparticles. Friedlander’s Figure 13.11 also shows an image illustrating the presence of BC in larger particles of surrounding liquid. The measurement of BC in such cases would be confounded by the external mixing of the liquid layer, which could contain the toxic species of concern.
BC resides in a multipollutant (Chow et al., Citation2010a; Hidy and Pennell, Citation2010) atmosphere with a variety of modifying processes taking place after they are emitted from sources (e.g., Jathar et al., Citation2014). In the case of the OC component emitted with BC, many species are identified that readily change with aging of the particles in the atmosphere (Robinson et al., Citation2010). Recent examples include the interaction of O3 with BC to form adsorbed species including free radicals and organic peroxides (e.g., Li et al., Citation2013) and the identification of sulfate, nitrate, and oxidized organics on BC (Zhang et al., Citation2014). The presence of particle-bound PAHs is noted in the CR, and it is further identified from samples of engine exhaust and ambient particles (e.g., Polidori et al., Citation2008).
The CR recognizes the importance of characterizing human exposure to BC and other pollutants. The exposure science community has shown appreciation for the complexity of BC and its measurement, and it has attempted to account for heterogeneities in spatial and temporal concentration variations in urban areas, including proximity to roadways or other sources. The community also has attempted to account for the differences in outdoor and indoor exposures by taking into account combustion sources. Accounting for differences in outdoor BC levels has largely relied on proximity to sources like highly traveled roadways, or association of sources and exposure through receptor modeling or air mass trajectory analysis. The latter is sometimes segregated by so-called regional levels compared with identified local sources. Modeling has assisted in accounting for outdoor–indoor differences in the United States and Europe, though this approach is hindered by heterogeneity of indoor combustion conditions throughout the rest of the world. Characterization of outdoor–indoor exposures including activity patterns of a healthy, normal population continues to lag behind relative to other measures (Clausen et al., Citation2011; Diapouli et al., Citation2013; Kim et al., Citation2011; Mercier et al., Citation2011).
A major gap in epidemiological studies is lack of recognition of, and accounting for, major changes in outdoor exposure from declining PM and gas concentrations in the United States and Europe with emission reductions. Major BC decreases have been recorded in the United States in both nonurban (Bahadur et al., Citation2011; Chen et al., Citation2012a; Hand et al., Citation2013; Husain et al., Citation2008; Murphy et al., Citation2011) and urban (Hidy et al., Citation2014; Hodgson et al., Citation2009; Kirchstetter et al., Citation2008; Kuwayama et al., Citation2013) areas with long-term BC measurements. A reduction in BC and associated pollutants, including adsorbed species, is expected to continue, especially for diesel engines. Such changes will shift concern to other sources, including open burning, residential heating, poorly maintained engines, and cooking (e.g., outdoor barbeque grills).
Seemingly “farther away” from advances in atmospheric chemistry are the growing number of similar health and risk studies, several of which are cited by the CR. Epidemiological studies follow a narrow design protocol based on available mortality or morbidity data for selected populations and commonly identified physiological endpoints, combined with the most basic air-monitoring exposure data without qualification of measurement methods and their limitations. The CR cites studies that include distance from sources, mostly motor vehicle pathways, and indoor exposures, to reduce exposure error. Results of these designs continue to be reported (e.g., Buonanno et al., Citation2013; Habre et al., Citation2014; Janssen et al., Citation2001; Yamazaki et al., Citation2014) without developing new insight into health risks. Only a few studies, such as the Detroit Exposure and Aerosol Research Study (DEARS) (e.g., Hammond et al., Citation2014), have added personal monitoring to their design to account for population mobility. Future epidemiological studies should include a broader outlook on non-motor-vehicle sources and measurements near and far from sources. These should apply methods that characterize particle aging in ambient and indoor air, specifying adsorbed chemicals on freshly emitted BC. The CR rightly points out that a distinction is needed between regionally representative PM that has aged by a day or more versus freshly emitted PM.
Animal and human exposures in the laboratory can evaluate the potential toxicity of BC with varying co-mixtures of reactive gases and particles. Studies beyond laboratory exposure to single pollutants are relatively rare, but there are useful examples (Ayala et al., Citation2012; Campen et al., Citation2010; Ljubimova et al., Citation2013; Mauderly et al., Citation2010; Seilkop et al., Citation2012). The linkage between air chemistry and exposure could be exploited with study designs that take advantage of advanced aerosol generation and analytical methods to provide aged mixtures to in vitro or in vivo procedures.
The experience of past debates over PM by size, number, and composition and the current knowledge of BC as an indicator for combustion-related exposures indicate that added BC regulation would be at least premature. This seems to be the case even with the CR assertion that the health risk data on BC are sufficient by the EPA stated criteria to consider an ambient standard. This is supported by the fact that there is already a hazardous air pollutant standard for diesel-emitted particles, which have contained large fractions of BC in the past.
Comments by John G. Watson and Judith C. Chow
People who have spent time downwind of a campfire or on the sidewalk waiting for an old city bus know that BC is bad for them. William Kent introduced the smoke chart developed by Maximilien Ringelmann of the French National Institute of Agricultural to U.S. smoke management agencies in 1897 (Griebling, Citation1952), and some variation of this opacity measurement is still used today as a regulatory tool (EPA, Citation2009b). British Smoke (Hill, Citation1936), a measure of PM filter darkening with reflected light, has been used to assess exposure since the 1920s, and health-related studies using this measure are even reported today (Beverland et al., Citation2014). The use of these BC measures, however, was always treated as an indicator of the pollutant mixture, and not as a separate quantity that was the major cause of adverse effects. The CR recognizes this in certain passages, but its overall tenor is that BC by itself is the major toxic component.
The CR makes much of the Janssen et al. (Citation2011) conclusion that “reducing a unit of BC might prolong life by 4 to 9 times more than reducing a unit of PM2.5” (CR, pp. 623 and 642) without examining the flaws of that meta-analysis. summarizes consistently measured PM2.5, OC, and EC from major U.S. cities, with EC/PM2.5 ratios of 6 to 14%. More detailed examination of these data confirms the comments of other discussants that OC and EC are highly correlated (when a few outliers associated with wildfires and secondary organic aerosol are excluded), and that BC or EC is often moderately to highly correlated with PM2.5, especially during winter at some sites. This implies that if BC is substituted for PM2.5 in a single-pollutant regression model, then the PM2.5 effect should be 7 to 17 times the effect of BC, not a mere 4 to 9 times. Furthermore, EC averages have been on the order of ˜1 μg/m3 in the past, and are rapidly decreasing as shown in the trends studies cited by G. Hidy. OC, however, is not decreasing as rapidly, even though it is still correlated with EC. Many studies (e.g., Baumgardner et al., Citation2002; Gordon et al., Citation2012; Han et al., Citation2011; Watson et al., Citation2002; Watson and Chow, Citation2002) show ambient- and near-source correlations between BC and carbon monoxide, nitrogen dioxide, PAHs, and other pollutants, as would be expected from incomplete combustion sources.
Table 1. Average concentrations and EC/PM2.5 ratios for several U.S. cities
Diesel engine exhaust takes a bad rap in the CR. Hesterberg et al. (Citation2011) make a convincing argument that modern engines, fuels, and exhaust treatment make the smoke-belching exhaust pipe a thing of the past, consistent with D. Greenbaum’s observations. Emission reductions are so large that it seems the gravimetric analysis used for engine emission certification standards (DieselNet, Citation2013) is not sensitive enough to quantify mass emissions. This has resulted in the European Union’s proposed standard test method (Mamakos et al., Citation2013) for particle number that would thermally denude the emissions at 250°C prior to quantification (Wang et al., Citation2010). Of course, this procedure would remove most of the potentially toxic (see M. Kleinman’s comments) semivolatile OC components, emphasizing the fact that certification emissions should not be confused with the real-world emissions (Watson et al., Citation2012) that are likely to affect public health. The California Air Resources Board (CARB, Citation2011) is evaluating its engine certification methods while recognizing that nearly two-thirds of the PM mass is removed by denuding (Dwyer et al., Citation2010). As well-maintained on-road diesel engines improve, it will become more important to characterize and control nonroad engines (e.g., generators, farm implements, trains, boats and ships, construction equipment, and military hardware) that tend to have longer lifetimes and don’t necessarily use low-sulfur fuels. Poorly maintained engines, transient operations (rapid accelerations), and cold starts are likely to become a larger, and poorly inventoried, fraction of carbonaceous PM emissions.
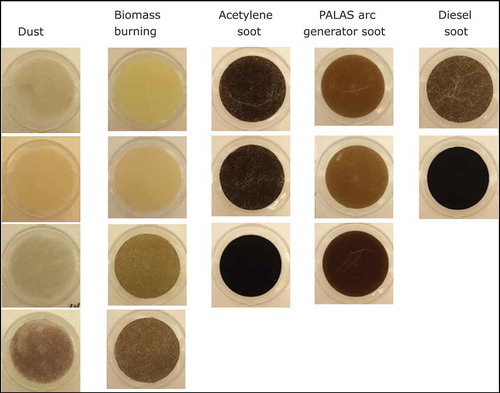
There is still much confusion concerning what is meant by BC and EC, though the CR makes an attempt with its definition that “EC is non-volatile carbon in graphite-like form, found in mainly nanometer size fractions.” Pure EC crystals in the form of graphite or diamond are not found in the atmosphere. The mineral graphite is highly reflective of incident light, as can be seen in a pencil lead or powdered graphite lubricant, and diamonds are nearly completely transparent. Akhter et al. (Citation1985a, Citation1985b) provide the best illustration of BC in “soot,” showing it to consist of small groups of hexagonal graphite- and polynuclear-like clusters that are loosely connected by different C-, O-, and H-bonds with ample reactive edges. shows the appearances of aerosol deposits from several different emitters and demonstrates that light absorbing aerosol isn’t always black, and it isn’t necessary composed of carbon. Neither is “brown carbon” a more descriptive term, as various colors are evident for these emissions. BC is derived from an optical measurement, while EC is derived from a thermal measurement, and there is a wide range of differences in how these are applied (Watson et al., Citation2005), even though the various BC and EC flavors are treated as equivalent in most health studies. Most of the BC/EC measures are highly correlated (Chow et al., Citation2010b; Watson and Chow, Citation2002), but their absolute values differ, by up to a factor of 7 for some comparisons (Currie et al., Citation2002; Schmid et al., Citation2001), and this is probably one of the causes of divergence in relative risk calculations in BC epidemiology. While fresh emissions are somewhat long and lacy, as described previously, these soon collapse into more compact forms with aging and reaction/adsorption in the atmosphere (Hallett et al., Citation1989). After passing through a diurnal cycle in the presence of atmospheric oxidants, some of the adsorbed OC evaporates, oxidizes to other substances with lower vapor pressures, and recondenses on the original particles and those from other sources (Donahue et al., Citation2011, Citation2012), some of which may or may not contain BC. Only initial steps are being taken to incorporate these mechanisms into air quality models (Ahmadov et al., Citation2012; Barsanti et al., Citation2013) that might be used to forecast excessive exposures.
Figure 1. PM deposits on Teflon-membrane filters, indicating an array of different colors. Dust samples were dried, sieved, and sampled onto filters through size-selective inlets (Chow et al., 1994). Acetylene and PALAS soot generators have been developed for BC standardization and exposure studies (Evans et al., Citation2003; Frenklach et al., Citation1986; Mendiara et al., Citation2005). Filters were retrieved from DRI sample archive.
More detailed exposure and epidemiological studies summarized in the CR’s supplemental section show that most of these emphasize cities on the East Coast and West Coast, Atlanta, GA, and the Midwest. Most of the exposure studies cited were near roadways, and there are dozens of other uncited (by the CR) roadside studies that show similar zones of influence and pollutant correlations. It seems that the Intermountain West has been largely left out in detailed air quality/health assessments except at the coarsest level, where dozens of areas are analyzed. Complex terrain, cold winters, range of altitude, and different emission sources affect the ˜20% of the U.S. population living between the Western coastal ranges and the Western Rockies from the Canadian to Mexican borders. Poorly inventoried emission sources characteristic of intermountain population centers such as residential wood combustion, wildfires, engine cold starts, allergens (pollen and spores), deicing materials, fugitive dust, and new energy extraction methods have not been addressed with respect to health effects. Several of these emissions contain large fractions of carbonaceous PM, and others contain light-absorbing material that can be misclassified as carbonaceous (see ). The relative importance of these sources is likely to increase as emissions from on-road engines and industrial sources continue to decrease, as a changing climate modifies land cover, and as Western urban areas expand. Wintertime stagnations persist in Western valleys (Baker et al., Citation2011) and result in large exposure differences over short distances, as illustrated in . Only a few Canadian studies (Larson et al., Citation2007; Citation2009; Smargiassi et al., Citation2012) have attempted to examine exposure error under stagnant “cold pool” conditions. Less precipitation creates more potential for windblown dust storms (Yin et al., Citation2005; Citation2007) and allergens from drought-resistant foliage (Cahill, Citation2013). The frequency and intensity of wildfires are likely to increase as the climate changes (Fried et al., Citation2004; Littell et al., Citation2009; Liu et al., Citation2013), with documented adverse health consequences (Henderson and Johnston, Citation2012; Moeltner et al., Citation2013; Noonan and Balmes, Citation2010).
Figure 2. Hourly average PM2.5 measured at urban- and neighborhood-scale monitors separated by 5.5 km in Nevada’s Truckee Meadows from 1/1/2012 through 2/13/2013. The neighborhood-scale site is surrounded by residences, many of which use wood for heating, while the urban-scale site is in a commercial district (Chen et al., Citation2012b).
The CR-cited studies seem limited in terms of population characteristics: children, the elderly, pregnant women, those with preexisting conditions, and sick mice. More detailed population descriptors (ESRI, Citation2014), typically developed for marketing, emergency management, and other purposes, are becoming available that might allow for control of a larger number of nonpollution variables than is possible with simple mortality/morbidity statistics. The Utah Population Data Base (Smith, Citation2014), for example, has detailed genealogical and health outcome information that has been used to determine hereditary inclinations for respiratory and cardiovascular disease (Horne et al., Citation2006; Scholand et al., Citation2013; Teerlink et al., Citation2007), but it has not yet been exploited for air quality assessments. More detailed information on health outcomes is to be expected as part of the Affordable Care Act. While these data sets may open opportunities to better separate the effects of pollutant mixtures from other causes, new safeguards on privacy will also complicate access to relevant health data.
The CR is fairly technical, and casual readers may first want to orient themselves with more general overviews such as EPA (Citation2012) and WHO (Citation2012), both cited in the CR. Nichols et al. (Citation2013) take another look at studies focused on populations with preexisting conditions, with much the same conclusions as the CR. A large number of reviews document the adverse effects of solid fuel use in developing countries (Kodgule and Salvi, Citation2012; Lam et al., Citation2012; Noonan and Balmes, Citation2010; Po et al., Citation2011; Sumpter and Chandramohan, Citation2013). Some of the approaches to reducing exposure error are summarized by Baxter et al. (Citation2013).
Additional information
Notes on contributors
A. Gwen Eklund
A. Gwen Eklund is the Austin Public Sector Business Development Leader/Principal Scientist at URS Corporation, current chair of the Critical Review Committee, and a past president of the A&WMA.
Judith C. Chow
Judith C. Chow holds the Nazir and Mary Ansari Chair in Entrepreneurialism and Science and is a Research Professor at the University of Nevada’s Desert Research Institute. She authored A&WMA’s 1995 critical review.
Daniel S. Greenbaum
Daniel S. Greenbaum is President and Chief Executive Officer of the Health Effects Institute and a former Commissioner of the Massachusetts Department of Environmental Protection.
George M. Hidy
George M. Hidy is a principal of Envair/Aerochem, a former editor of the Journal of the Air & Waste Management Association, and author of A&WMA’s 1984 and 2010 critical reviews.
Michael T. Kleinman
Michael T. Kleinman is Professor of Environmental Toxicology and Co-Director of the Air Pollution Health Effects Laboratory in the Department of Community and Environmental Medicine and an Adjunct Professor in College of Medicine at UC Irvine.
John G. Watson
John G. Watson is a Research Professor at the Desert Research Institute and authored A&WMA’s 2002 critical review.
Ronald E. Wyzga
Ronald E. Wyzga is a senior technical executive and biostatistician at the Electric Power Research Institute.
References
- Ahmadov, R., A.A. McKeen, A.L.Robinson, R.Bahreini, A.M.Middlebrook, J.A. de Gouw, J. Meagher, E.Y. Hsie, E. Edgerton, S. Shaw, and M. Trainer. 2012. A volatility basis set model for summertime secondary organic aerosols over the eastern United States in 2006. J. Geophys Res. Atmos. 117 (D06301): 1–19. doi:10.1029/2011JD016831
- Akhter, M.S., A.R. Chughtai, and D.M. Smith. 1985a. The structure of hexane soot I. Spectroscopic studies. Appl. Spectrosc. 39(1): 143–153. doi:10.1366/0003702854249114
- Akhter, M.S., A.R. Chughtai, and D.M. Smith. 1985b. The structure of hexane soot II. Extraction studies. Appl. Spectrosc. 39(1): 154–167. doi:10.1366/0003702854249204
- Andreae, M.O., and A. Gelencser. 2006. Black carbon or brown carbon? The nature of light-absorbing carbonaceous aerosols. Atmos. Chem. Phys. 6:3131–3148. doi:10.5194/acp-6-3131-2006
- Araujo, J.A., B. Barajas, M. Kleinman, X.P. Wang, B.J. Bennett, K.W. Gong, M. Navab, J. Harkema, C. Sioutas, A.J. Lusis, and A.E. Nel. 2008. Ambient particulate pollutants in the ultrafine range promote early atherosclerosis and systemic oxidative stress. Circulation Res. 102(5): 589–596. doi:10.1161/CIRCRESAHA.107.164970
- Ayala, A., M. Brauer, J.L. Mauderly, and J.M. Samet. 2012. Air pollutants and sources associated with health effects. Air Qual. Atmos. Health 5(2): 151–167. doi:10.1007/s11869-011-0155-2
- Bahadur, R., Y. Feng, L.M. Russell, and V. Ramanathan. 2011. Impact of California’s air pollution laws on black carbon and their implications for direct radiative forcing. Atmos. Environ. 45(5): 1162–1167. doi:10.1016/j.atmosenv.2010.10.054
- Baker, K.R., H. Simon, and J.T. Kelly. 2011. Challenges to modeling “cold pool” meteorology associated with high pollution episodes. Environ. Sci. Technol. 45(17): 7118–7119. doi:10.1021/es202705v
- Barsanti, K.C., A.G. Carlton, and S.H. Chung. 2013. Analyzing experimental data and model parameters: implications for predictions of SOA using chemical transport models. Atmos. Chem. Phys. 13(23): 12073–12088. http://www.atmos-chem-phys.net/13/12073/2013/acp-13-12073-2013.pdf doi:10.5194/acp-13-12073-2013
- Baumgardner, D., G. Raga, O. Peralta, I. Rosas, T. Castro, T. Kuhlbusch, A. John, and A. Petzold. 2002. Diagnosing black carbon trends in large urban areas using carbon monoxide measurements. J. Geophys. Res. 107(D21): ICC 4-1–ICC 4-9. doi:10.1029/2001JD000626.
- Baxter, L.K., K.L. Dionisio, J. Burke, S.E. Sarnat, J.A. Sarnat, N. Hodas, R.Q. Rich, B.J. Turpin, R.R. Jones, E. Mannshardt, N. Kumar, S.D. Beevers, and H. Ozkaynak. 2013. Exposure prediction approaches used in air pollution epidemiology studies: Key findings and future recommendations. J. Expos. Sci. Environ. Epidemiol. 23(6): 654–659. doi:10.1038/jes.2013.62
- Beverland, I.J., M. Carder, G.R. Cohen, M.R. Heal, and R.M. Agius. 2014. Associations between short/medium-term variations in black smoke air pollution and mortality in the Glasgow conurbation, UK. Environ. Int., 62: 126–132. doi:10.1016/j.envint.2013.01.001
- Bond, T.C., and R.W. Bergstrom. 2006. Light absorption by carbonaceous particles: An investigative review. Aerosol Sci. Technol. 40(1): 27–67. doi:10.1080/02786820500421521
- Bond, T.C., S.J. Doherty, D.W. Fahey, P.M. Forster, T. Berntsen, B.J. DeAngelo, M.G. Flanner, S. Ghan, B. Karcher, D. Koch, S. Kinne, Y. Kondo, P.K. Quinn, M.C. Sarofim, M.G. Schultz, M. Schulz, C. Venkataraman, H. Zhang, S. Zhang, N. Bellouin, S.K. Guttikunda, P.K. Hopke, M.Z. Jacobson, J.W. Kaiser, Z. Klimont, U. Lohmann, J.P. Schwarz, D. Shindell, T. Storelvmo, S.G. Warren, and C.S. Zende. 2013. Bounding the role of black carbon in the climate system: A scientific assessment. J. Geophys Res. Atmos. 118(11): 5380–5552. doi:10.1002/jgrd.50171
- Brunekreef, B., R. Beelen, G. Hoek, L. Schouten, S. Bausch-Goldbohm, P. Fischer, B. Armstrong, E. Hughes, M. Jerrett, and P. Van den Brandt 2009. Effects of long-term exposure to traffic-related air pollution on respiratory and cardiovascular mortality in the Netherlands: The NLCS-AIR study. 169. Boston, MA: Health Effects Institute. http://pubs.healtheffects.org/getfile.php?u=446
- Buonanno, G., L. Stabile, L. Morawska, and A. Russi. 2013. Children exposure assessment to ultrafine particles and black carbon: The role of transport and cooking activities. Atmos. Environ. 79:53–58. doi:10.1016/j.atmosenv.2013.06.041
- Cahill, T.M. 2013. Annual cycle of size-resolved organic aerosol characterization in an urbanized desert environment. Atmos. Environ. 71:226–233. doi:10.1016/j.atmosenv.2013.02.004
- California Air Resources Board. 2011. Appendix P: LEV III PM Technical support document-Development of particulate matter mass standards for future light duty vehicles. Sacramento, CA: California Air Resources Board. http://www.arb.ca.gov/regact/2012/leviiighg2012/levappp.pdf
- Campen, M.J., A.K. Lund, M.L. Doyle-Eisele, J.D. McDonald, T.L. Knuckles, A.C. Rohr, E.M. Knipping, and J.L. Mauderly. 2010. A comparison of vascular effects from complex and individual air pollutants indicates a role for monoxide gases and volatile hydrocarbons. Environ. Health Perspect. 118(7): 921–927. doi:10.1289/ehp.0901207
- Chen, L.-W.A., J.C. Chow, J.G. Watson, and B.A. Schichtel. 2012a. Consistency of long-term elemental carbon trends from thermal and optical measurements in the IMPROVE network. Atmos. Measure. Techniques 5:2329–2338. http://www.atmos-meas-tech.net/5/2329/2012/amt-5-2329-2012.pdf doi:10.5194/amt-5-2329-2012
- Chen, L.-W.A., J.G. Watson, J.C. Chow, M.C. Green, D. Inouye, and K. Dick. 2012b. Wintertime particulate pollution episodes in an urban valley of the western U.S.: A case study. Atmos. Chem. Phys. 12(21): 10051–10064. http://www.atmos-chem-phys.net/12/10051/2012/acp-12-10051-2012.pdf. doi:10.5194/acp-12-10051-2012
- Chow, J.C., J.D. Bachmann, J.D. Kinsman, A.H. Legge, J.G. Watson, G.M. Hidy, and W.R. Pennell. 2010a. Multipollutant air quality management: Critical review discussion. J. Air Waste Manage. Assoc. 60(10): 1151–1164. doi:10.3155/1047-3289.60.10.1154
- Chow, J.C., J.P. Engelbrecht, J.G. Watson, W.E. Wilson, N.H. Frank, and T. Zhu. 2002. Designing monitoring networks to represent outdoor human exposure. Chemosphere 49(9): 961–978. https://www.researchgate.net/publication/10982533_Designing_monitoring_networks_to_represent_outdoor_human_ exposure?ev=prf_pub doi:10.1016/S0045-6535(02)00239-4
- Chow, J.C., J.G. Watson, L.-W.A. Chen, M.-C.O. Chang, N.F. Robinson, D.L. Trimble, and S.D. Kohl. 2007. The IMPROVE_A temperature protocol for thermal/optical carbon analysis: Maintaining consistency with a long-term database. J. Air Waste Manage. Assoc. 57(9): 1014–1023. doi:10.3155/1047-3289.57.9.1014
- Chow, J.C., J.G. Watson, M.C. Green, and N.H. Frank. 2010b. Filter light attenuation as a surrogate for elemental carbon. J. Air Waste Manage. Assoc. 60(11):1365–1375. doi:10.3155/1047-3289.60.11.1365
- Chow, J.C., J.G. Watson, J.L. Mauderly, D.L. Costa, R.E. Wyzga, S. Vedal, G.M. Hidy, S.L. Altshuler, D. Marrack, J.M. Heuss, G.T. Wolff, C.A. Pope, and D.W. Dockery. 2006. 2006 critical review discussion - Health effects of fine particulate air pollution: Lines that connect. J. Air Waste Manage. Assoc. 56(10): 1368–1380. doi:10.1080/10473289.2006.10464545
- Chow, J.C., J.G. Watson, L.C. Pritchett, W.R. Pierson, C.A. Frazier, and R.G. Purcell. 1993. The DRI Thermal/Optical Reflectance carbon analysis system: Description, evaluation and applications in U.S. air quality studies. Atmos. Environ. 27A(8): 1185–1201. doi:10.1016/0960-1686(93)90245-T
- Chow, J.C., J.G. Watson, J. Robles, X.L. Wang, L.-W.A. Chen, D.L. Trimble, S.D. Kohl, R.J. Tropp, and K.K. Fung. 2011. Quality assurance and quality control for thermal/optical analysis of aerosol samples for organic and elemental carbon. Anal. Bioanal. Chem. 401(10): 3141–3152. doi:10.1007/s00216-011-5103-3
- CIRA. 2014. Federal Land Manager Environmental Database (FED). Fort Collins, CO: Colorado State University. http://views.cira.colostate.edu/fed
- Clausen, G., G. Beko, R.L. Corsi, L. Gunnarsen, W.W. Nazaroff, B.W. Olesen, T, Sigsgaard, J. Sundell, J. Toftum, and C.J. Weschler. 2011. Reflections on the state of research: indoor environmental quality. Indoor Air 21(3): 219–230. doi:10.1111/ina.2011.21.issue-3
- Currie, L.A., B.A. Benner, Jr., H. Cachier, R. Cary, J.C. Chow, E.R.M. Druffel, T.I. Eglinton, Ö. Gustafsson, P.C. Hartmann, J.I. Hedges, J.D. Kessler, T.W. Kirchstetter, D.B. Klinedinst, G.A. Klouda, J.V. Marolf, C.A. Masiello, T. Novakov, A. Pearson, K.M. Prentice, H. Puxbaum, J.G. Quinn, C.M. Reddy, H. Schmid, J.F. Slater, J.G. Watson, and S.A. Wise. 2002. A critical evaluation of interlaboratory data on total, elemental, and isotopic carbon in the carbonaceous particle reference material, NIST SRM 1649a. J. Res. National Bureau Standards 107(3): 279–298. doi:10.6028/jres
- Delfino, R.J., N. Staimer, T. Tjoa, D.L. Gillen, A. Polidori, M. Arhami, M.T. Kleinman, N.D. Vaziri, J. Longhurst, and C. Sioutas. 2009. Air pollution exposures and circulating biomarkers of effect in a susceptible population: Clues to potential causal component mixtures and mechanisms. Environ. Health Perspect. 117(8): 1232–1238. doi:10.1289/ehp.0800194
- Diapouli, E., A. Chaloulakou, and P. Koutrakis. 2013. Estimating the concentration of indoor particles of outdoor origin: A review. J. Air Waste Manage. Assoc. 63(10): 1113–1129. doi:10.1080/10962247.2013.791649
- DieselNet. 2013. Emission standards: Summary of worldwide diesel emission standards. Mississauga, ON, Canada: Ecopoint, Inc. http://www.dieselnet.com/standards/#na
- Donahue, N.M., S.A. Epstein, S.N. Pandis, and A.L. Robinson. 2011. A two-dimensional volatility basis set: Part 1: Organic-aerosol mixing thermodynamics. Atmos. Chem. Phys. 11(7): 3303-3318. http://www.atmos-chem-phys.net/11/3303/2011/acp-11-3303-2011.pdfdoi:10.5194/acp-11-3303-2011
- Donahue, N.M., J.H. Kroll, S.N. Pandis, and A.L. Robinson. 2012. A two-dimensional volatility basis set - Part 2: Diagnostics of organic-aerosol evolution. Atmos. Chem. Phys. 12(2): 615–634. http://www.atmos-chem-phys.net/12/615/2012/acp-12-615-2012.pdfdoi:10.5194/acp-12-615-2012
- Dwyer, H., A. Ayala, S. Zhang, J. Collins, T. Huai, J. Herner, and W. Chau, W. 2010. A study of emissions from a Euro 4 light duty diesel vehicle with the European particulate measurement programme. Atmos. Environ. 44(29):3469–3476. doi:10.1016/j.atmosenv.2010.06.028
- Eldred, R.A., T.A. Cahill, L.K. Wilkinson, P.J. Feeney, J.C. Chow, and W.C. Malm. 1990. Measurement of fine particles and their chemical components in the NPS/IMPROVE networks. In Transactions, Visibility and Fine Particles, 187–196. Pittsburgh, PA: Air & Waste Management Association.
- ESRI. 2014. ArcGIS maps, tools. Redlands, CA: ESRI. http://www.arcgis.com/home/search.html?q=ArcGIS%20Online&t=content
- Evans, D.E., R.M. Harrison, and J.G. Ayres. 2003. The generation and characterisation of elemental carbon aerosols for human challenge studies. J. Aerosol Sci. 34(8): 1023–1041. doi:10.1016/S0021-8502(03)00069-7
- Ferris, B.G., Jr. 1978. Critical review: Health effects of exposure to low levels of regulated air pollutants: A critical review. J. Air Pollut. Control Assoc. 28(5): 482–497. doi:10.1080/00022470.1978.10470621
- Frenklach, M., D.W. Clary, T. Yuan, W.C. Gardiner, and S.E. Stein. 1986. Mechanism of soot formation in acetylene-oxygen mixtures. Combust. Sci. Technol. 50(1–3): 79–115. doi:10.1080/00102208608923927
- Fried, J.S., M. Torn, and E. Mills. 2004. The impact of climate change on wildfire severity: A regional forecast for northern California. Climatic Change 64:169–191. doi:10.1023/B:CLIM.0000024667.89579.ed
- Friedlander, S.K. 2000. Smoke, Dust, and Haze. Fundamentals of Aerosol Dynamics, 2nd ed., New York, NY: Oxford University Press.
- Goldstein, B.D. 1983. Toxic substances in the atmospheric environment—A critical review. J. Air Pollut. Control Assoc. 33(5): 454–467. doi:10.1080/00022470.1983.10465593
- Gordon, M., R.M. Staebler, J. Liggio, S.M. Li, J. Wentzell, G. Lu, P. Lee, and J.R. Brook. 2012. Measured and modeled variation in pollutant concentration near roadways. Atmos. Environ. 57:138–145. doi:10.1016/j.atmosenv.2012.04.022
- Grabowsky, J., T. Streibel, M. Sklorz, J.C. Chow, A. Mamakos, and R. Zimmermann. 2011. Hyphenation of a carbon analyzer to photo-ionization mass spectrometry to unravel the organic composition of particulate matter on a molecular level. Anal. Bioanal. Chem. 401(10): 3153–3164. doi:10.1007/s00216-011-5425-1
- Grahame, T.J., R.J. Klemm, and R.B. Schlesinger. 2014. Public health and components of particulate matter: The changing assessment of black carbon: Critical review. J. Air Waste Manage. Assoc. 64(6): 620–660. doi:10.1080/10962247.2014.912692
- Griebling, R.T. 1952. Maximilien Ringelmann—Man of mystery. Air Repair 2(2):4–6.
- Habre, R., E. Moshier, W. Castro, A. Nath, A. Grunin, A.C. Rohr, J. Godbold, N. Schachter, M. Kattan, B. Coull, and P. Koutrakis. 2014. The effects of PM2.5 and its components from indoor and outdoor sources on cough and wheeze symptoms in asthmatic children. J. Expos. Sci. Environ. Epidemiol. 24(4): 380–387. doi:10.1038/jes.2014.21
- Hallett, J., J.G. Hudson, and C.F. Rogers. 1989. Characterization of combustion aerosols for haze and cloud formation. Aerosol Sci. Technol. 10(1): 70–83. doi:10.1080/02786828908959222
- Hammond, D., C. Croghan, H. Shin, R. Burnett, R. Bard, R.D. Brook, and R. Williams. 2014. Cardiovascular impacts and micro-environmental exposure factors associated with continuous personal PM2.5 monitoring. J. Expos. Sci. Environ. Epidemiol. 24(4): 337–345. doi:10.1038/jes.2013.46
- Han, I., J.P. Ramos-Bonilla, A.M. Rule, J.N. Mihalic, L.M. Polyak, P.N. Breysse, and A.S. Geyh. 2011. Comparison of spatial and temporal variations in p-PAH, BC, and p-PAH/BC ratio in six US counties. Atmos. Environ. 45(40): 7644–7652. doi:10.1016/j.atmosenv.2010.10.042
- Hand, J.L., B.A. Schichtel, W.C. Malm, and N.H. Frank. 2013. Spatial and temporal trends in PM2.5 organic and elemental carbon across the United States. Adv. Meteorol. 2013: 1–13. doi:10.1155/2013/367674
- Health Effects Institute. 2010. Traffic-Related Air Pollution: A Critical Review of the Literature on Emissions, Exposure, and Health Effects. 17. Boston, MA: Health Effects Institute. http://pubs.healtheffects.org/getfile.php?u=553
- Health Effects Institute. 2013. HEI’s National Particle Component Toxicity (NPACT) Initiative: Executive Summary, Research Reports 177 and 178. Boston, MA: Health Effects Institute. http://www.healtheffects.org/Pubs/NPACT-ExecutiveSummary.pdf
- Henderson, S.B., and F.H. Johnston. 2012. Measures of forest fire smoke exposure and their associations with respiratory health outcomes. Curr. Opin. Allergy Immunol. 12(3):221–227. doi:10.1097/ACI.0b013e328353351f
- Hesterberg, T.W., C.M. Long, S.N. Sax, C.A. Lapin, R.O. McClellan, W.B. Bunn, and P.A. Valberg. 2011. Particulate matter in new technology diesel exhaust (NTDE) is quantitatively and qualitatively very different from that found in traditional diesel exhaust (TDE). J. Air Waste Manage. Assoc. 61(9): 894–913. doi:10.1080/10473289.2011.599277
- Hidy, G.M., C.L. Blanchard, K. Baumann, E. Edgerton, S. Tannenbaum, S. Shaw, E. Knipping, I. Tombach, J. Jansen, and J. Walters. 2014. Chemical climatology of the southeastern United States. Atmos. Chem. Phys. Discuss. 14:1–59. http://www.atmos-chem-phys-discuss.net/14/17101/2014/acpd-14-17101-2014-print.pdfdoi:10.5194/acpd-14-17101-2014
- Hidy, G.M., and W.R. Pennell. 2010. Multipollutant air quality management: A critical review. J. Air Waste Manage. Assoc. 60(6): 645–674. doi:10.3155/1047-3289.60.10.1154; 10.3155/1047-3289.60.6.645
- Hill, A.S.G. 1936. Measurement of the optical densities of smokestains of filter papers. Trans. Faraday Soc. 32:1125–1131. doi:10.1039/tf9363201125
- Hodgson, S., F.M. Khaw, M.S. Pearce, and T. Pless-Mulloli. 2009. Predicting black smoke levels from deposit gauge and SO2 data to estimate long-term exposure in the United Kingdom, 1956–1961. Atmos. Environ. 43(21): 3356–3363. doi:10.1016/j.atmosenv.2009.03.059
- Horne, B.D., N.J. Camp, J.B. Muhlestein, and L.A. Cannon-Albright. 2006. Identification of excess clustering of coronary heart diseases among extended pedigrees in a genealogical population database. Am. Heart J. 152(2): 305–311. doi:10.1016/j.ahj.2005.12.028
- Horvath, H. 1993. Atmospheric light absorption—A review. Atmos. Environ. 27A(3):293-317. doi:10.1016/0960-1686(93)90104-7
- Husain, L., A.J. Khan, T. Ahmed, K. Swami, A. Bari, J.S. Webber, and J.J. Li. 2008. Trends in atmospheric elemental carbon concentrations from 1835 to 2005. J. Geophys Res. Atmos. 113(D13102): 1–10. doi:10.1029/2007JD009398
- Janssen, N.A.H., G. Hoek, M. Simic-Lawson, P. Fischer, L. van Bree, H. Ten Brink, M. Keuken, R.W. Atkinson, H.R. Anderson, B. Brunekreef, and F.R. Cassee. 2011. Black carbon as an additional indicator of the adverse health effects of airborne particles compared with PM10 and PM2.5. Environ. Health Perspect. 119(12): 1691–1699. http://openaccess.sgul.ac.uk/1316/1/ehp.1003369.pdfdoi:10.1289/ehp.1003369
- Janssen, N.A.H., P.H.N. Van Vliet, F. Aarts, H. Harssema, and B. Brunekreef. 2001. Assessment of exposure to traffic related air pollution of children attending schools near motorways. Atmos. Environ. 35(22): 3875–3884. doi:10.1016/S1352-2310(01)00144-3
- Jathar, S., T. Gordon, C. Hennigan, H. Pye, G. Pouliot, P. Adams, N. Donahue, and A. Robinson. 2014. Unspeciated organic emissions from combustion sources and their influence on the secondary organic aerosol budget in the United States. Proc. Natl. Acad. Sci. USA 111(29): 10473–10478. http://www.pnas.org/content/111/29/10473doi:10.1073/pnas.1323740111
- Khalek, I.A., T.L. Bougher, P.M. Merritt, and B. Zielinska. 2011. Regulated and unregulated emissions from highway heavy-duty diesel engines complying with U.S. Environmental Protection Agency 2007 emissions standards. J. Air Waste Manage. Assoc. 61(4): 447–442. doi:10.3155/1047-3289.61.4.427
- Kim, K.H., S.A. Jahan, and E. Kabir. 2011. A review of diseases associated with household air pollution due to the use of biomass fuels. J. Hazard. Mater. 192(2): 425–431. doi:10.1016/j.jhazmat.2011.05.087
- Kioumourtzoglou, M.A., A. Zanobetti, J.D. Schwartz, B.A. Coull, F. Dominici, and H.H. Suh. 2013. The effect of primary organic particles on emergency hospital admissions among the elderly in 3 US cities. Environ. Health 12(68): 1–10. doi:10.1186/1476-069X-12-68
- Kirchstetter, T.W., J. Agular, S. Tonse, D. Fairley, and T. Novakov. 2008. Black carbon concentrations and diesel vehicle emission factors derived from coefficient of haze measurements in California: 1967–2003. Atmos. Environ. 42(3): 480–491. doi:10.1016/j.atmosenv.2007.09.063
- Kodgule, R., and S. Salvi. 2012. Exposure to biomass smoke as a cause for airway disease in women and children. Curr. Opin. Allergy Immunol. 12(1): 82–90. doi:10.1097/ACI.0b013e32834ecb65
- Kuwayama, T., J.R. Schwartz, R.A. Harley, and M.J. Kleeman. 2013. Particulate matter emissions reductions due to adoption of clean diesel technology at a major shipping port. Aerosol Sci. Technol. 47(1): 29–36. doi:10.1080/02786826.2012.720049
- Lam, N.L., K.R. Smith, A. Gauthier, and M.N. Bates. 2012. Kerosene: A review of household uses and their hazards in low- and middle-income countries. J. Toxicol, Environ. Health B Crit. Rev. 15(6): 396–432. doi:10.1080/10937404.2012.710134
- Larson, T., S.B. Henderson, and M. Brauer, M. 2009. Mobile monitoring of particle light absorption coefficient in an urban area as a basis for land use regression. Environ. Sci. Technol. 43(13): 4672–4678. doi:10.1021/es803068e
- Larson, T., J. Su, A.M. Baribeau, M. Buzzelli, E. Setton, and M. Brauer. 2007. A spatial model of urban winter woodsmoke concentrations. Environ. Sci. Technol. 41(7): 2429–2436. doi:10.1021/es0614060
- Li, Q., J. Shang, and T. Zhu. 2013. Physicochemical characteristics and toxic effects of ozone-oxidized black carbon particles. Atmos. Environ. 81: 68–75. doi:10.1016/j.atmosenv.2013.08.043
- Lipfert, F.W., J.D. Baty, J.P. Miller, and R.E. Wyzga. 2006a. PM2.5 constituents and related air quality variables as predictors of survival in a cohort of U. S. military veterans. Inhal. Toxicol. 18(9): 645–657. doi:10.1080/08958370600742946
- Lipfert, F.W., R.E. Wyzga, J.D. Baty, and J.P. Miller. 2006b. Traffic density as a surrogate measure of environmental exposures in studies of air pollution health effects: Long-term mortality in a cohort of US veterans. Atmos. Environ. 40(1): 154–169. doi:10.1016/j.atmosenv.2005.09.027
- Lippmann, C., T. Gordon, K. Ito, and G.D. Thurston 2013. National Particle Component Toxicity (NPACT) Initiative: Integrated epidemiologic and toxicologic studies of the health effects of particulate matter components. 177. Boston, MA: Health Effects Institute. http://pubs.healtheffects.org/getfile.php?u=934
- Littell, J.S., D. McKenzie, D.L. Peterson, and A.L. Westerling. 2009. Climate and wildfire area burned in western U. S. ecoprovinces, 1916–2003. Ecol. Appl. 19(4): 1003–1021. http://ulmo.ucmerced.edu/pdffiles/09EA_Littelletal.pdfdoi:10.1890/07-1183.1
- Liu, Y.Q., S.L. Goodrick, and J.A. Stanturf. 2013. Future US wildfire potential trends projected using a dynamically downscaled climate change scenario. For. Ecol. Manage. 294:120–135. doi:10.1016/j.foreco.2012.06.049
- Ljubimova, J.Y., M.T. Kleinman, N.M. Karabalin, S. Inoue, B. Konda, P. Gangalum, J.L. Markman, A.V. Ljubimov, and K.L. Black. 2013. Gene expression changes in rat brain after short and long exposures to particulate matter in Los Angeles basin air: Comparison with human brain tumors. Exp. Toxicol. Pathol. 65(7–8): 1063–1071. doi:10.1016/j.etp.2013.04.002
- Mamakos, A., G. Martini, and U. Manfredi. 2013. Assessment of the legislated particle number measurement procedure for a Euro 5 and a Euro 6 compliant diesel passenger cars under regulated and unregulated conditions. J. Aerosol Sci. 55:31–47. doi:10.1016/j.jaerosci.2012.07.012
- Mauderly, J.L., R.T. Burnett, M. Castillejos, H. Ozkaynak, J.M. Samet, D.M. Stieb, S. Vedal, and R.E. Wyzga. 2010. Commentary: Is the air pollution health research community prepared to support a multipollutant air quality management framework? Inhal. Toxicol. 22(S1): 1–19. doi:10.3109/08958371003793846
- Mendiara, T., M.P. Domene, A. Millera, R. Bilbao, and M.U. Alzueta. 2005. An experimental study of the soot formed in the pyrolysis of acetylene. J. Anal. Appl. Pyrol. 74(1–2): 486–493. doi:10.1016/j.jaap.2004.11.019
- Mercier, F., P. Glorennec, O. Thomas, and B. Le Bot. 2011. Organic contamination of settled house dust, A review for exposure assessment purposes. Environ. Sci. Technol. 45(16): 6716–6727. doi:10.1021/es200925h
- Moeltner, K., M.K. Kim, E. Zhu, and W. Yang. 2013. Wildfire smoke and health impacts: A closer look at fire attributes and their marginal effects. J. Environ. Econ. Manage. 66(3): 476–496. doi:10.1016/j.jeem.2013.09.004
- Moosmüller, H., R.K. Chakrabarty, and W.P. Arnott, W.P. 2009. Aerosol light absorption and its measurement: A review. J. Quant. Spectrosc. Radiat. Transfer 110:844–878. doi:10.1016/j.jqsrt.2009.02.035
- Mukerjee, D. 1998. 1998 Critical review—Assessment of risk from multimedia exposures of children to environmental chemicals. J. Air Waste Manage. Assoc. 48(6): 483–501. doi:10.1080/10473289.1998.10463703
- Murphy, D.M., J.C. Chow, E.M. Leibensperger, W.C. Malm, M.L. Pitchford, B.A. Schichtel, J.G. Watson, and W.H. White. 2011. Decreases in elemental carbon and fine particle mass in the United States. Atmos. Chem. Phys. 11:4679–4686. http://www.atmos-chem-phys.net/11/4679/2011/acp-11-4679-2011.pdf. doi:10.5194/acp-11-4679-2011
- Nichols, J.L., E.O. Owens, S.J. Dutton, and T.J. Luben. 2013. Systematic review of the effects of black carbon on cardiovascular disease among individuals with pre-existing disease. Int. J. Public Health 58(5): 707–724. doi:10.1007/s00038-013-0492-z
- Noonan, C.W., and J.R. Balmes. 2010. Biomass smoke exposures: Health outcomes measures and study design. Inhal. Toxicol. 22(2): 108–112. doi:10.3109/08958370903008888
- Po, J.Y.T., J.M. FitzGerald, and C. Carlsten. 2011. Respiratory disease associated with solid biomass fuel exposure in rural women and children: Systematic review and meta-analysis. Thorax 66(3): 232–239. doi:10.1136/thx.2010.147884
- Polidori, A., S. Hu, S. Biswas, R.J. Delfino, and C. Sioutas. 2008. Real-time characterization of particle-bound polycyclic aromatic hydrocarbons in ambient aerosols and from motor-vehicle exhaust. Atmos. Chem. Phys. 8(5): 1277–1291. doi:10.5194/acp-8-1277-2008
- Pope, C.A.; and D.W. Dockery. 2006. Critical review: Health effects of fine particulate air pollution: Lines that connect. J. Air Waste Manage. Assoc. 56(6): 709–742. http://www.noaca.org/pmhealtheffects.pdfdoi:10.1080/10473289.2006.10464485
- Redmond, H.E., K.D. Dial, and J.E. Thompson. 2010. Light scattering and absorption by wind blown dust: Theory, measurement, and recent data. Aeolian Res. 2(1): 5–26. doi:10.1016/j.aeolia.2009.09.002
- Robinson, A.L., A.P. Grieshop, N.M. Donahue, and S.W. Hunt. 2010. Updating the conceptual model for fine particle mass emissions from combustion systems. J. Air Waste Manage. Assoc. 60(10): 1204–1222. doi:10.3155/1047-3289.60.10.1204
- Rohr, A.C., and R.E. Wyzga. 2012. Attributing health effects to individual particulate matter constituents. Atmos. Environ. 62:130–152. doi:10.1016/j.atmosenv.2012.07.036
- Saraji-Bozorgzad, M.R., M. Eschner, T.M. Groeger, T. Streibel, R. Geissler, E. Kaisersbeiger, T. Denner, R. Zimmermann. 2010. Highly resolved online organic-chemical speciation of evolved gases from thermal analysis devices by cryogenically modulated fast gas chromatography coupled to single photon ionization mass spectrometry. Anal. Chem. 82(23): 9644–9653. doi:10.1021/ac100745h
- Schmid, H.P., L. Laskus, H.J. Abraham, U. Baltensperger, V.M.H. Lavanchy, M. Bizjak, P. Burba, H. Cachier, D. Crow, J.C. Chow, T. Gnauk, A. Even, H.M. ten Brink, K.P. Giesen, R. Hitzenberger, C. Hueglin, W. Maenhaut, C.A. Pio, J. Puttock, J.P. Putaud, D. Toom-Sauntry, and H. Puxbaum. 2001. Results of the “Carbon Conference” international aerosol carbon round robin test: Stage 1. Atmos. Environ. 35(12): 2111–2121. doi:10.1016/S1352-2310(00)00493-3
- Scholand, M.B., H. Coon, R. Wolff, and L. Cannon-Albright. 2013. Use of a genealogical database demonstrates heritability of pulmonary fibrosis. Lung 191(5): 475–481. doi:10.1007/s00408-013-9484-2
- Seilkop, S.K., M.J. Campen, A.K. Lund, J.D. McDonald, and J.L. Mauderly. 2012. Identification of chemical components of combustion emissions that affect pro-atherosclerotic vascular responses in mice. Inhal. Toxicol. 24(5): 270–287. doi:10.3109/08958378.2012.667455
- Smargiassi, A., A. Brand, M. Fournier, F. Tessier, S. Goudreau, J. Rousseau, and M. Benjamin. 2012. A spatiotemporal land-use regression model of winter fine particulate levels in residential neighbourhoods. J. Expos. Sci. Environ. Epidemiol. 22(4): 331–338. doi:10.1038/jes.2012.26
- Smith, K.R. 2014. Utah population data base. Salt Lake City, UT: University of Utah. http://healthcare.utah.edu/huntsmancancerinstitute/research/updb
- Sumpter, C., and D. Chandramohan. 2013. Systematic review and meta-analysis of the associations between indoor air pollution and tuberculosis. Trop. Med. Int. Health 18(1): 101–108. doi:10.1111/tmi.12013
- Teerlink, C.C., M.J. Hegewald, and L.A. Cannon-Albright. 2007. A genealogical assessment of heritable predisposition to asthma mortality. Am. J. Respir. Crit. Care Med. 176(9): 865–870. doi:10.1164/rccm.200703-448OC
- U.S. Environmental Protection Agency. 1997. Guidance for Network Design and Optimum Site Exposure for PM2.5 and PM10. EPA-454/R-99-022. Research Triangle Park, NC: U.S. Environmental Protection Agency. http://www.epa.gov/ttn/amtic/pmstg.html
- U.S. Environmental Protection Agency. 2009a. Integrated Science Assessment for Particulate Matter (Final Report). EPA/600/R-08/139F. Washington, DC: U.S. Environmental Protection Agency. http://cfpub.epa.gov/ncea/cfm/recordisplay.cfm?deid=216546
- U.S. Environmental Protection Agency. 2009b. Method 9—Visual determination of the opacity of emissions from stationary sources. Research Triangle Park, NC: U.S. Environmental Protection Agency. http://www.epa.gov/ttn/emc/promgate/m-09.pdf
- U.S. Environmental Protection Agency. 2011. The Benefits and Costs of the Clean Air Act: 1990–2020. Washington, DC: U.S.Environmental Protection Agency. http://www.epa.gov/cpd/mac/compare.htm
- U.S. Environmental Protection Agency. 2012. Report to Congress on Black Carbon. EPA-450/D-12-001. Washington DC: U.S. Environmental Protection Agency. http://www.epa.gov/blackcarbon
- Vedal, S. 1997. Critical review—Ambient particles and health: Lines that divide. J. Air Waste Manage. Assoc. 47(5): 551–581. doi:10.1080/10473289.1997.10463922
- Vedal, S., M.J. Campen, J.D. McDonald, J.D. Kaufman, T.V. Larson, P.D. Sampson, L. Sheppard, C.D. Simpson, and A.A. Szpiro. 2013. National Particle Component Toxicity (NPACT) Initiative Report on Cardiovascular Effects. 76. Boston, MA: Health Effects Institute. http://pubs.healtheffects.org/getfile.php?u=946
- Verma, V., P. Pakbin, K.L. Cheung, A.K. Cho, J.J. Schauer, M.M. Shafer, M.T. Kleinman, and C. Sioutas. 2011. Physicochemical and oxidative characteristics of semi-volatile components of quasi-ultrafine particles in an urban atmosphere. Atmos. Environ. 45(4): 1025–1033. ISI:000287424600025. doi:10.1016/j.atmosenv.2010.10.044
- Wang, X.L., R. Caldow, G.J. Sem, N. Hama, and H. Sakurai. 2010. Evaluation of a condensation particle counter for vehicle emission measurement: Experimental procedure and effects of calibration aerosol material. J. Aerosol Sci. 41(3): 306–318. doi:10.1016/j.jaerosci.2010.01.001
- Watson, J.G. 2002. Visibility: Science and regulation—2002 Critical review. J. Air Waste Manage. Assoc. 52(6): 628–713. doi:10.1080/10473289.2002.10470813
- Watson, J.G., and J.C. Chow. 2002. Comparison and evaluation of in-situ and filter carbon measurements at the Fresno Supersite. J. Geophys Res. Atmos. 107(D21): ICC 3-1–ICC 3-15. doi:10.1029/2001JD000573
- Watson, J.G., J.C. Chow, and L.-W.A. Chen. 2005. Summary of organic and elemental carbon/black carbon analysis methods and intercomparisons. AAQR 5(1): 65–102. http://aaqr.org/VOL5_No1_June2005/6_AAQR-05-06-OA-0006_65-102.pdf
- Watson, J.G., J.C. Chow, D.H. Lowenthal, M.R. Stolzenburg, N.M. Kreisberg, and S.V. Hering. 2002. Particle size relationships at the Fresno supersite. J. Air Waste Manage. Assoc. 52(7): 822–827. doi:10.1080/10473289.2002.10470817
- Watson, J.G., J.C. Chow, X.L. Wang, S.D. Kohl, L.-W.A. Chen, and V. Etyemezian. 2012. Overview of real-world emission characterization methods. In Alberta Oil Sands: Energy, Industry, and the Environment, 145–170. Amsterdam, The Netherlands: Elsevier Press. https://www.researchgate.net/publication/235341867_Overview_of_real-world_emission_characterization_methods?ev= prf_pub
- Watson, J.G., R.E. Wyzga, R.T. Burnett, J.J. Vostal, I. Romieu, J.C. Chow, J.T. Holcombe, F.W. Lipfert, D. Marrack, R.J. Thompson, and S. Vedal. 1997. Ambient particles and health—Lines that divide: 1997 Critical review discussion. J. Air Waste Manage. Assoc. 47(9): 995–1008. doi:10.1080/10473289.1997.10463950
- World Health Organization. 2012. Health Effects of Black Carbon. Geneva, Switzerland: World Health Organization. http://www.euro.who.int/__data/assets/pdf_file/0004/162535/e96541.pdf
- Yamazaki, S., M. Shima, T. Nakadate, T. Ohara, T. Omori, M. Ono, T. Sato, and H. Nitta. 2014. Association between traffic-related air pollution and development of asthma in school children: Cohort study in Japan. J. Expos. Sci. Environ. Epidemiol. 24(4): 372–379. doi:10.1038/jes.2014.15
- Yin, D.Z., S. Nickovic, B. Barbaris, B. Chandy, and W.A. Sprigg. 2005. Modeling wind-blown desert dust in the southwestern United States for public health warning: A case study. Atmos. Environ. 39(33): 6243–6254. doi:10.1016/j.atmosenv.2005.07.009
- Yin, D.Z., S. Nickovic, and W.A. Sprigg. 2007. The impact of using different land cover data on wind-blown desert dust modeling results in the southwestern United States. Atmos. Environ. 41(10): 2214–2224. doi:10.1016/j.atmosenv.2006.10.061
- Zhang, G.H., X.H. Bi, J.J. He, D.H. Chen, L.Y. Chan, G.W. Xie, X.M. Wang, G.Y. Sheng, J. Fu, and Z. Zhou. 2014. Variation of secondary coatings associated with elemental carbon by single particle analysis. Atmos. Environ. 92:162–170. doi:10.1016/j.atmosenv.2014.04.018