
Abstract
Cement plants are responsible for particle and gaseous emissions into the atmosphere. With respect to particle emission, the greater part of is in the range from 0.05 to 5.0 µm in diameter. In the last years attention was paid to submicron particles, but there is a lack of available data on the emission from stationary sources. In this paper, concentration and size distribution of particles emitted from four cement kilns, in relationship to operational conditions (especially the use of alternative fuel to coal) of the clinker process are reported. Experimental campaigns were carried out by measuring particles concentration and size distribution at the stack of four cement plants through condensation particle counter (CPC) and scanning mobility particle sizer spectrometer (SMPS). Average total particle number concentrations were between 2000 and 4000 particles/cm3, about 8–10 times lower that those found in the corresponding surrounding areas. As for size distribution, for all the investigated plants it is stable with a unimodal distribution (120–150 nm), independent from the fuel used.
Implications: The study provides information on submicron particles emitted from cement kilns in different driving conditions. In particular, the total particle number is modest and considerably lower than that measured in ambient air, whereas the particle size distribution could be influenced by the operational conditions.
Introduction
Fine and ultrafine particles (UFPs) are products of combustion and secondary atmospheric transformations, and ambient UFPs have multiple sources. Few emission inventories have been created for UFPs, but although constructed using different approaches, they all concluded that the highest contribution comes from emissions of industrial combustion processes and traffic-related emissions (Cass et al., Citation2000; Kuhlbusch and Asbach, Citation2011; Kulmala et al., 2011; Buonanno et al., Citation2009). In cement industries, dust is emitted from stockpiles, quarrying, transportation of raw materials, kiln operation, clinker cooling, and milling (Abdul-Wahab, Citation2006; European Commission, Citation2010; Gupta et al., Citation2012). Particulates emitted from cement kiln mostly range from 0.05 to 5.0 µm in aerodynamic diameter (Kalacic, Citation1973; Meo et al., Citation2002). Literature data on experimental campaigns both at the stack of clinker lines and in the surrounding areas, in order to assess the impact of the cement plants, show that the contribution to ambient air PM10 and PM2.5 (particulate matter with aerodynamic diameters <2.5 and <10 μm, respectively) is to a small extent, probably on the order of 10% (Perrino et al., Citation2010; Abu-Allaban and Abu-Qudais, Citation2011; Gupta et al., Citation2012). In the last years, the attention was focused on the finer fraction of particles (particulate matter with aerodynamic diameter lower than 2.5 µm), although the epidemiological evidence for health effects is still more limited (Hoek et al., Citation2010; Terzano et al., Citation2010). The toxicity of UFPs may be attributed to their small diameters and vast number: surface area is directly proportional to the adsorption of toxic chemicals (Oberdörster et al., 1992; Donaldson et al., Citation2005; Maier et al., Citation2008; HEI, Citation2013).
Submicron (ultrafine and nano-) particles, for their microscopic size and the negligible contribution to the total mass of emissions, cannot be measured and characterized with the equipment typically used for the analysis of fine dust. Aitken et al. (Citation2004) and Luther (Citation2004) summarized various types of device that might be or have been used to provide measurement information on nanometer size aerosols. Burtscher (2005) described the two principal classes of methods to investigate aerosol particles: methods based on the analysis of filter samples and in situ methods. Literature data show that road vehicles can contribute up to 86% of total particle number concentration in the urban ambient atmosphere (Kumar et al., Citation2010; Pey et al., Citation2009; Morawska et al., Citation2008a). Charron and Harrison (Citation2003) observed about 71–95% of total particle number concentrations in London in the 11–100 nm size range.
Numerous studies have also been carried out in order to measure particle number emission from various non-vehicle-exhaust sources to urban airborne nanoparticles, as synthesized by Kumar et al. (Citation2013) in great detail, and partially summarized in .
Table 1. Summary of nanoparticle emissions (particles cm−3) from various sources to atmospheric environment (from Kumar et al., Citation2013; Wang et al., Citation2011)
This study provides novel data of on-line real-time measurements of the particle size distribution and concentration of cement kiln flue gas at different sites and during different operational conditions (especially with and without secondary waste fuel) of clinker process.
The use of secondary solid fuel (CSS) in cement kilns is on one hand a possibility of energy and cost savings for companies, and on the other hand a chance of saving natural resources and fossil fuels and for the reduction of greenhouse gases and, in general, of polluting compounds. All environmental considerations can only be based on a comparison of an existing cement plant operated only in fossil fuels and the same cement plant fed with a fuel mix that includes a portion of CSS (Conesa et al., Citation2008; Conesa et al., Citation2011; Garg et al., Citation2007; Genon and Brizio, Citation2008). The main objective considered within this study is the investigation of the impact of process control measures on particle concentration and size distribution in the range of 14–740 nm in the raw flue gas after bag filters.
Materials and Methods
Plant descriptions
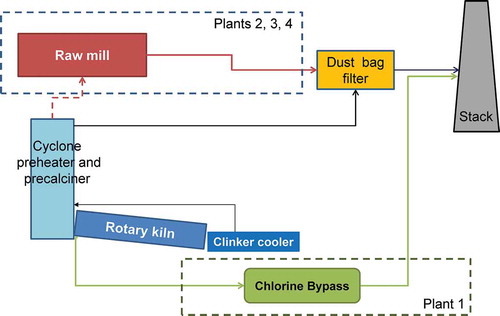
Experimental campaigns were performed at the stack of four Italian cement plants of Buzzi Unicem Group located in the provinces of Rome, Cuneo, Barletta, and Piacenza. All cement kilns are based on dry cooking process, in which the raw materials are ground and dried into a raw meal, which is fed to the multistage cyclone preheaters and precalciner. A schematic diagram of the entire cement manufacturing is presented in . In particular, a chloride bypass system, in order to reduce the internal circulation of gaseous HCl and the consequent kiln inner shell corrosion, is installed in Plant 1. The emissions from the kiln and the raw mill are convoyed to the same stack only in Plants 2, 3, and 4. The average concentration of oxygen (%) in the investigated plant is about 12–13%.
Figure 1. Schematic diagram of the cement plants considered in this study.
In , a summary of the main characteristics of the combustion flue gas treatment sections, on-line stack data measurements (provided by the manager of each plant, and provided in Supplemental Material), and alternative fuels used is reported. All the cement kilns are fed with pulverized coal (petcoke) as conventional fuel; Plants 1, 2, and 3 uses also alternative fuels, as described in . The obtained particle size distribution data were integrated with the on-line stack measurements, provided by the manager of each plant.
Table 2. Main characteristics of the combustion, flue gas treatment section, and average values of the investigated plants
Sampling and measurement equipment
Flue gas emitted from the kiln is hot (90–130 °C), highly concentrated, and made up of volatile gaseous compounds that tend to condense, leading to an under-/overestimation of emitted particles due to either nucleation or condensation during the cooling phase. In this work, a permeable membrane dryer is used to remove water vapor and other light, polar compounds from the flowing sample stream (Clarke and Bartle, Citation1998). The permeable membrane consists of Nafion tubing (E.I. Dupont de Nemours, Inc., Wilmington, DE, USA), a copolymer of tetrafluoroethylene and fluorosulfonyl monomer, that is coaxially mounted within larger tubing (Perma-Pure Products, Inc., NJ, USA). The sample stream is passed through the interior of the Nafion tubing; this allows water (and other light, polar compounds) to permeate through the walls into a dry air purge stream flowing in countercurrent through the annular space between the Nafion and the outer tubing. The configuration that proved most effective for this work was a tubular Nafion membrane with a 2.8 mm (0.110”) outer diameter [O.D.], a 2.2 mm (0.086”) inner diameter [I.D.], and a 60 cm (24”) length mounted in 6.4 mm (1/4”) O.D. purge tubing. These dryers can accommodate from 1 up to a 4 L min−1 sample flow, with a corresponding purge flow of about 3 or 4 times the sample flow one. In this work, an alternate configuration of pneumatics lines, in order to create a static low pressure of about 100–150 mb in the purge flow tubing, working at 1 L min−1 flow rate, was used. The sample flow rate to the measurement system, through tubular Nafion membrane, was 0.3 L min−1. The dried sample is sent to measurement system, a scanning mobility particle sizer (SMPS 3936; TSI Inc., Shoreview, MN, USA), for measuring the size distribution of the aerosols in the size range from 10 to 800 nm. SMPS is a combination of a differential mobility analyzer (DMA 3080; TSI Inc.), which discriminates charged particles according to their drift velocity under an electric field (Kousaka et al., Citation1985), and a condensation nucleus counters (CPC 3775; TSI Inc.), in which the particles are activated to droplets in a supersaturated atmosphere of alcohol, which can then be detected optically. The DMA classifier is able to select particles regarding their mobility equivalent diameter (Dp), whereas the CPC is able to detect particle diameter down to 4 nm and number concentration up to 107 particles cm−3. The instrument was calibrated with polystyrene latex (PSL) certified spheres in the working size range.
Experimental design
Measurements of total particle number concentrations and particle size distributions were performed at the stack of each selected plant, after the dust filter, in a suitable location, as required by UNI EN 15259 (European Commission, Italian Group, Citation2008). Experimental campaigns were carried out in stable operating conditions (see Supplemental Material), and the influence of alternative fuels and operational conditions were investigated. summarizes the experimental tests carried out in each plant. In particular, the influence of chloride bypass was investigated in Plant 1 and the contribution of emissions from raw mill was investigated in Plants 2 and 4, where the emissions of the raw mill and the rotary kiln are convoyed in a common stack.
Table 3. Experimental campaigns
All the results have been multiplied by a correction factor, calculated on each sampling site by comparing the count of nanoparticles in the ambient air with the sampling line (with and without the Nafion probe):
During these preliminary measurements, a leak test of the line, through the insertion of a HEPA (high-efficiency particulate air) filter, was also carried out.
Results and Discussion
In this section, results in terms of particle size distribution and total concentration measured at the clinker lines fed with conventional and alternative fuels, analyzed through a combination of electrostatic classifiers and condensation particle counters (SMPS), are discussed. In addition, the influence of chloride bypass system and the contribution of raw mill emissions are evaluated.
Particle size distributions and total concentration values
summarizes the total particle concentration (mean values and standard deviation) measured by CPC in each trial in the investigated plants.
Table 4. Summary of nanoparticle emissions measured in this study by CPC: Mean value and deviation (particles × 103 cm−3)
Both Plant 1 and Plant 2 use coal and CSS as secondary fuel, but they have different stack emission characteristics, such as flow rate, flue gas temperature, and humidity (). shows particle number concentration measured by CPC at both Plant 1 and Plant 2 with and without CSS as secondary fuel. It can be noticed in both graphs an unsteady emission of the plant almost every 4 min: it may be attributable to the rotation of the “rotary” kiln, during which external air enters or to the cleaning operation of fabric filters through pulse jet (Buonanno et al., Citation2012).
Figure 2. Comparison of total particle number concentration with conventional and alternative fuel. (a) Plant 1, coal; (b) Plant 1, coal + CSS; (c) Plant 2, coal; (d) Plant 2, coal + CSS.
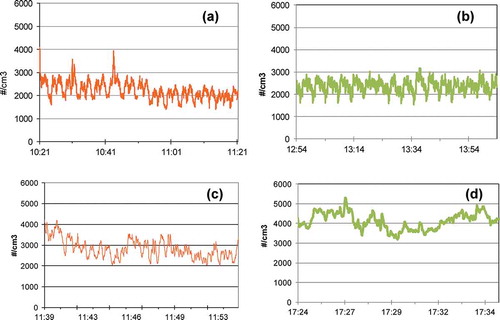
The comparison of the number of particles during the exercise of the cement kiln with coal and with coal + CSS in Plant 1 clearly demonstrates that there is no difference between the two fuel loadings. The average count of particles when the fuel is only coal is 2242 ± 333 (minimum = 1399, maximum = 3408), and with coal + CSS is 2408 ± 271 (minimum = 1543, maximum = 3228). In addition, F test was applied for both Plant 1 and Plant 2 in order to check homogenity of variance. The calculated F values (0.66 and 0.43 for Plants 1 and 2, respectively) were smaller than the F critical values for the 5% level (0.95 and 0.90 for Plants 1 and 2, respectively), meaning that there were no statistically significant differences between group means.
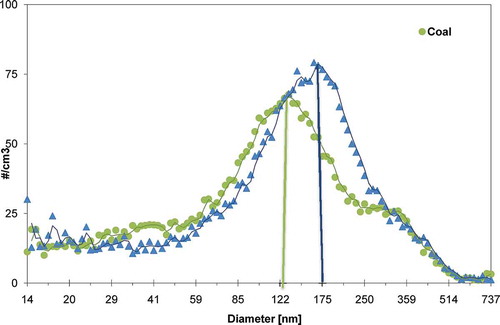
Flue gas average particle concentrations in Plants 1 and 2 resulted constantly about 8 times lower than corresponding levels measured in the ambient air surrounding the plants, where nearly 15,000 and 35,000 particles cm−3, respectively, were detected. These values are also lower than other anthropogenic sources (Glasius et al., Citation2008; Zhang et al., 2012; Morawska et al., Citation2008b; Buonanno et al., Citation2009; Pey et al., Citation2009). As for example, in , particle number size distributions (fitted by using log-normal distribution functions) measured through SMPS at the stack of Plant 1 during two experimental setups are reported. They both show a unimodal distribution, with the main maximum being at 129 nm (coal) and at about 175 nm (coal + CSS). Cofiring of CSS with coal slightly increases the particle size maximum, being both in the accumulation mode. It could be due to an interaction between species derived from both fuels.
Figure 3. Particle size distribution from Plant 1.
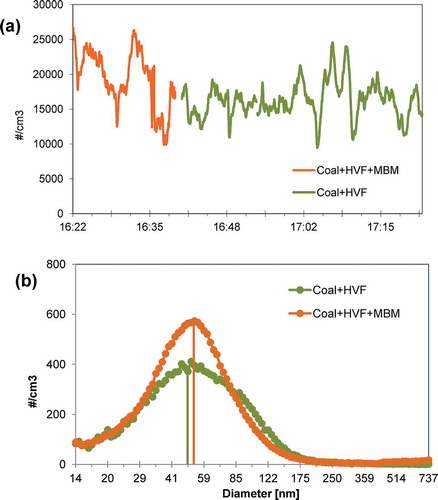
In the experimental campaign in Plant 3, an average particle concentration of 18000 cm−3 was observed in both trials (19387 ± 4037 and 16253 ± 2537 cm−3 in Trials 1 and 2, respectively). F test was applied, giving a calculated F value (0.66) smaller than the critical F value (0.73), meaning that data came from the same population and they were not statistically different. The plant uses high-viscosity fuel (HVF) as a secondary fuel and animal meal (MBM) as an alternative fuel in the head. shows total particle concentration and particle size distribution. It can be observed that the size distribution is unimodal, with a maximum about 50 nm (nucleation mode). The higher concentration of fine particles in Plant 3, with respect to the other investigated plants (), could be due to a different configuration and characteristics of the flue gas treatment and to the use of high-viscosity fuel: Lee (1992) has shown that the particulate emission rate when burning fuel oil increases with the aromatics content and viscosity of the fuel oil.
Figure 4. Total particle number concentration and particle size distribution from Plant 3.
During each experimental campaign, preliminary trials were performed in order to evaluate the correction factor due to the Nafion tubing and the leak test. In that occasion, the total concentration of particles was measured in the ambient air surrounding each plant. shows a summary of the findings of this study, of both particles emitted from the stack and in ambient air.
The particles emitted by the studied cement kilns are up to 4 orders of magnitude smaller than those generally measured from road vehicles (~107 cm−3) and from other industrial sources (power plants, boilers), as summarized in , presumably due to the efficient flue gas treatment used. The ambient air concentration is of the same order of magnitude of literature data (Pey et al., Citation2009).
Influence of chloride bypass system
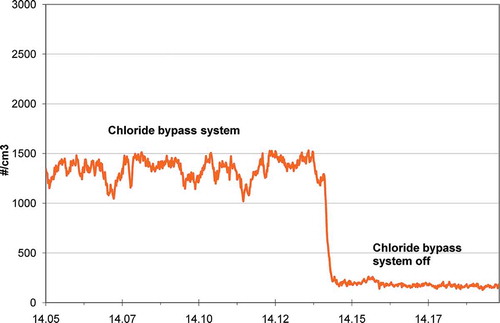
Plant 1 has installed a system to reduce the circulating chlorine volatiles from a preheater and precalciner kiln system. Part of the exhaust gases exiting the rotary kiln to the preheater are extracted before entering the preheater and quench-cooled to solidify chlorine compounds onto the lime dust. The bypass dust is then available for extraction from the gas using a filter. Adaska and Taubert (Citation2008) analyzed the characteristics of cement kiln dust (CKD) from operation sources. Studies conducted by Todres et al. (1992) showed that for cement kilns equipped with alkali bypass, the dust is relatively coarse compared with the CKD from both the wet and dry kilns (22.2 and 3.0 µm, respectively). In agreement with Plant 1 manager, a test was performed excluding chloride bypass system: the particles concentration decreased from 1344 ± 100 to 183 ± 26 particles cm−3 (). The rapid (the exclusion of the bypass system lasted few minutes) and significant decrease could be due to plant design: the gas flow rate coming from the bypass consists of 80% ambient air, which has a concentration of nanoparticles 8 times higher than that coming from the flue gas. This flow is absent when the chloride bypass is switched off.
Figure 5. Influence of chloride bypass system on/off on total particle number.
Influence of raw mill emissions
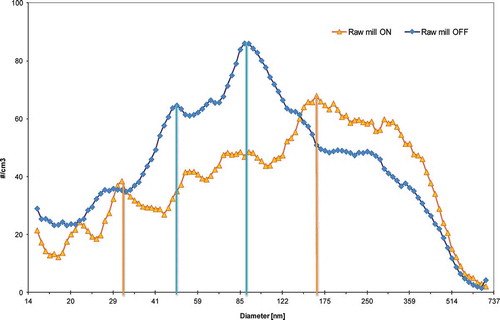
It has been shown that the flue-gas composition (gas-phase compounds) can be altered considerably and very dynamically due to changes in combustion conditions (Maguhn et al., Citation2003). As gas-phase species represent the feedstock for particle formation and growth, transient effects are assumed to have a major impact on the particle-size spectrum too. Plant 2 and Plant 4 have a common stack for raw mill and kiln. In agreement with the manager of the plants, sampling measurements were done with and without the raw mill set on or off. shows the size distribution of nanoparticles with the kiln in Plant 2 characterized by the exercise with and without the raw mill and with the burners of the kiln fed with CSS and pulverized coal. Both of the distributions have a bimodal profile; when the raw mill is on-line, the maximum values are at about 30 nm (nucleation mode) and at about 170 nm; when the raw mill is off-line, there is a shift to a broad maximum at about 50 and 90 nm. In terms of the number of particles, the cumulative distribution of nanoparticles with 4200 particles cm−3 with the mill on increases in 4800 particles cm−3 with the mill off.
Figure 6. Particle size distribution from Plant 2 with the raw mill on (triangles) and off (squares).
Similarly to Plant 2, Plant 4 has a common stack for raw mill and kiln. In agreement with the manager of the plant, sampling measurements were done with and without the raw mill set on or off (). The graph highlights a different concentration of nanoparticles (n cm−3) measured by CPC both in terms of number of particles and oscillation when the raw mill is running with the kiln than when it is off (1278 ± 786 and 509 ± 128 particles cm−3, respectively). In particular, when the raw mill is off, there is a lower concentration of nanoparticles and above all the absence of significant fluctuation of particles. The distribution of nanoparticles with the raw mill off has a modal value of 85 nm, whereas with the raw mill running the distribution is between 10 and 60 nm. In terms of number of particles, the cumulative distribution measured by SMPS is equal to 1200 particles cm−3 with the raw mill running and 450 particles cm−3 with the mill off. The data obtained with the SMPS system correspond to measurements with the CPC system.
Figure 7. Total particle number from Plant 4 with raw mill on or off.
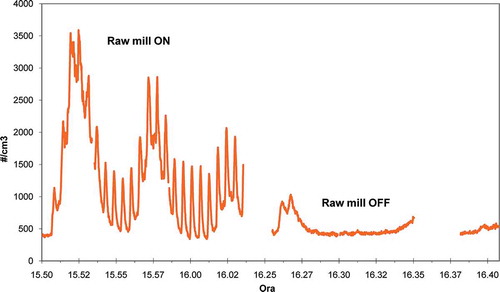
Since the measurements were carried out in steady-state conditions, the wide deviations of the data obtained with the raw mill on (786 particles cm−3) with respect to the average and median concentrations (1278 and 1042 particles cm−3, respectively) could be due to the cleaning phase of the fabric filters through pulse jet (compressed air cleaning operation), as observed by Buonanno et al. (Citation2012). The total concentration measured with SMPS when the raw mill is on-line is about 1200 particles cm−3, a value similar to that obtained with CPC. These values are constantly lower than corresponding levels measured in the ambient air surrounding the plant, where over 15,000 particles cm−3 (10 times higher) were detected, as reported in . When considering the particle size distribution, the switching on or off of the raw mill has an influence: the particle size is higher when the raw mill is not working (mode at about 90 nm); when the mill is on-line, a maximum can be found at nucleation mode of about 15 nm and a broad maximum at about 40–70 nm. Further investigations could explain this influence.
Conclusion
Previous experimental campaigns both at the stack of the same four clinker kilns selected for this study and in the surrounding areas were carried out, in order to evaluate the contribution of facilities’ particulate emission to the ambient air PM10 and PM2.5. Since the interest of the scientific community to submicron particles is growing, and there is a lack of information about the emission from stationary industrial sources, the aim of this work was to evaluate concentration and size distribution of particles with a diameter below 1 µm. The study of submicron particles in the emission line of cement kiln lines was carried out in two distinct phases: the first involved the development of the line sampling and analysis of particles, whereas in the second phase the tests were carried out in the field according to different operating conditions of the cement kiln, in order to quantify the submicron particles in emission and, especially, to evaluate the variation with respect to the feeding conditions.
The need to carry out preliminary tests in the laboratory system for the sampling and analysis is due to the current lack of an official method for the determination of submicron particles in emission. The tests with different systems are motivated by the fact that the emission to monitor represents a hot emission; nanoparticles, as well as being generated by the cooking process, may be formed by the condensation of volatile compounds in a homogeneous (nucleation) or heterogeneous (condensation, particle growth) process during the cooling phase.
The core finding is the modest amount of ultrafine particles emitted by the analyzed cement kilns (), considerably lower (about 8–10 times) than those found in the surrounding ambient air and, above all, less than 2 or 3 orders of magnitude than those of other industrial sources, as summarized in .
The comparison of the results of measurements carried out under conditions of feeding of the cement kilns with and without CSS shows a substantial equivalence in the number of particles emitted (on average 2000 cm−3), whereas there was a modal value slightly shifted to a cumulative normal distribution of sizes more (175 nm) in the case of co-combustion of CSS. Case apart Plant 3, which showed a particle number concentration of about 18,000 particles cm−3, probably due to the secondary fuel type used (high-viscosity fuel) in addition to petcoke/pulverized coal.
It is also interesting to highlight that in the case of the chlorine bypass system switched off in Plant 1, the emission of submicron particles of the entire clinker line tends toward very low values, so as to confirm again the high reliability and effectiveness of the process investigated and bag filters for the removal of ultrafine components.
The evaluations that emerge from the study show that the investigated cement kiln in different driving conditions and, above all, feeding (coal, pulverized coal, CSS) does not show, at present, scientific evidence such as to indicate the source of particular significance for the submicron particle emissions. Consequently, for the groups of plant investigated, a major finding of this study has been that the particle size distribution is a characteristic of the technical process. Further investigations should include detailed analysis of the composition of these particles, in order to extend the findings of the previous experimental carried out on PM10 and PM2.5.
Supplemental Material
Supplemental data for this article can be accessed at http://dx.doi.org/10.1080/10962247.2014.962193.
Additional information
Notes on contributors
Mauro Rotatori
Mauro Rotatori and Antonio Febo are first researchers, Silvia Mosca and Ettore Guerriero are researchers, and Marco Giusto, Mauro Montagnoli, and Massimo Bianchini are technicians at CNR-IIA.
Silvia Mosca
Mauro Rotatori and Antonio Febo are first researchers, Silvia Mosca and Ettore Guerriero are researchers, and Marco Giusto, Mauro Montagnoli, and Massimo Bianchini are technicians at CNR-IIA.
Ettore Guerriero
Mauro Rotatori and Antonio Febo are first researchers, Silvia Mosca and Ettore Guerriero are researchers, and Marco Giusto, Mauro Montagnoli, and Massimo Bianchini are technicians at CNR-IIA.
Antonio Febo
Mauro Rotatori and Antonio Febo are first researchers, Silvia Mosca and Ettore Guerriero are researchers, and Marco Giusto, Mauro Montagnoli, and Massimo Bianchini are technicians at CNR-IIA.
Marco Giusto
Mauro Rotatori and Antonio Febo are first researchers, Silvia Mosca and Ettore Guerriero are researchers, and Marco Giusto, Mauro Montagnoli, and Massimo Bianchini are technicians at CNR-IIA.
Mauro Montagnoli
Mauro Rotatori and Antonio Febo are first researchers, Silvia Mosca and Ettore Guerriero are researchers, and Marco Giusto, Mauro Montagnoli, and Massimo Bianchini are technicians at CNR-IIA.
Massimo Bianchini
Mauro Rotatori and Antonio Febo are first researchers, Silvia Mosca and Ettore Guerriero are researchers, and Marco Giusto, Mauro Montagnoli, and Massimo Bianchini are technicians at CNR-IIA.
Renato Ferrero
Renato Ferrero is manager of Ecology, Environment & Safety at Buzzi Unicem SpA.
Related Research Data
References
- Abdul-Wahab, S.A. 2006. Impact of fugitive dust emissions from cement plants on nearby communities. Ecol. Model. 195:338–348. doi:10.1016/j.ecolmodel.2005.11.044
- Abu-Allaban, M., and H. Abu-Qudais. 2011. Impact assessment of ambient air quality by cement industry: A case study in Jordan. Aerosol Air Qual. Res. 11:802–810. doi:10.4209/aaqr.2011.07.0090
- Adaska, W.S., and D.H. Taubert. 2008. Beneficial uses of cement kiln dust. Paper presented at 2008 IEEE Cement Industry Technical Conference Record, Miami, FL, May 16–22, 2008.
- Aitken, R.J., K.S. Creely, and C.L. Tran. 2004. Nanoparticles: An Occupational Hygiene Review. Edinburgh: Health and Safety Executive (HSE), Institute of Occupational Medicine.
- Buonanno, G., G. Ficco, and L. Stabile. 2009. Size distribution and number concentration of particles at the stack of a municipal waste incinerator. Waste Manage. 29:749–755. doi:10.1016/j.wasman.2008.06.029
- Buonanno, G., L. Stabile, P. Avino, and E. Belluso. 2011. Chemical, dimensional and morphological ultrafine particle characterization from a waste-to-energy plant. Waste Manage. 31:2253–2262. doi:10.1016/j.wasman.2011.06.017
- Buonanno, G., M. Scungio, L. Stabile, and W. Tirler. 2012. Ultrafine particle emission from incinerators: The role of the fabric filter. J. Air Waste Manage. Assoc. 62:103–111. doi:10.1080/10473289.2011.636501
- Burtscher, H. 2001. Sampling, measurement, and characterization of combustion aerosols for chemistry, morphology, and size distribution. In Proceedings of the International Seminar on Aerosols from Biomass Combustion, ETH-Zürich, June 27, 2001, ed. Th. Nussbaumer, 19–28. Verenum, Zurich: IEA Bioenergy Task 32 and Swiss Federal Office of Energy.
- Cass, G.R., L.A. Hughes, P. Bhave, M.J. Kleeman, J.O. Allen, and L.G. Salmon. 2000. The chemical composition of atmospheric ultrafine particles. Philos. Trans. R. Soc. A 358:2581–2592. doi:10.1098/rsta.2000.0670
- Charron, A., and R.M. Harrison. 2003. Primary particle formation from vehicle emissions during exhaust dilution in the road side atmosphere. Atmos. Environ. 37:4109–4119. doi:10.1016/S1352-2310(03)00510-7
- Clarke, A.G., and G. Bartle. 1998. Industrial Air Pollution Monitoring: Gaseous and Particulate Emissions, ed. A.G. Clarke. London: Chapman & Hall.
- Commodo, M., L. Sgro, A. D’Anna, and P. Minutolo. 2012. Size distribution of nanoparticles generated by a heating stove burning wood pellets. Int. J. Environ. Qual. 8:21–26. doi:10.6092/issn.2281-4485/3747
- Conesa, J.A., A. Galvez, F. Mateos, I. Martin-Gullon, and R. Font. 2008. Organic and inorganic pollutants from cement kiln stack feeding alternative fuels. J. Hazard. Mater. 158:585–592. doi:10.1016/j.jhazmat.2008.01.116
- Conesa, J.A., L. Rey, S. Egea, and M.D. Rey. 2011. Pollutant formation and emissions from cement kiln stack using a solid recovered fuel from municipal solid waste. Environ. Sci. Technol. 45:5878–5884. doi:10.1021/es200448u
- Donaldson, K., L. Tran, L.A. Jimenez, R. Duffin, D.E. Newby, N. Mills, W. MacNee, and V. Stone. 2005. Combustion derived nanoparticles: A review of their toxicology following inhalation exposure. Part Fibre Toxicol. 2:10. doi:10.1186/1743-8977-2-10
- European Commission. 2010. Integrated Pollution Prevention and Control (IPPC), Reference Document on Best Available Techniques (BREF) in the Cement and Lime Manufactory industries, Seville. http://eippcb.jrc.es (accessed January 15, 2014).
- European Commission, Italian Group. 2008. UNI EN 15259. Air quality—Measurement of stationary source emissions—Requirements for measurement sections and sites and for the measurement objective, plan and report. http://store.uni.com/magento-1.4.0.1/index.php/uni-en-15259-2008.html?josso_back_to=http://store.uni.com/josso-security-check.php&josso_cmd=login_optional&josso_partnerapp_host=store.uni.com (accessed February 20, 2014).
- Garg, A., R. Smith, D. Hill, N. Simms, and S. Pollard. 2007. Wastes as cofuels: The policy framework for solid recovered fuel (SRF) in Europe, with UK implications. Environ. Sci. Technol. 41:4868–4874. doi:10.1021/es062163e
- Genon, G., and E. Brizio. 2008. Perspectives and limits for cement kilns as a destination for RDF. Waste Manage. 28:2375–2385. doi:10.1016/j.wasman.2007.10.022
- Glasius, M., M. Ketzel, P. Wåhlin, R. Bossi, J. Stubkjær, O. Hertel, and F. Palmgren. 2008. Characterization of particles from residential wood combustion and modelling of spatial variation in a low-strength emission area. Atmos. Environ. 42:8686–8697. doi:10.1016/j.atmosenv.2008.04.037
- Gramsch, E., L. Gidhagen, P. Wählin, P. Oyola, and F. Moreno. 2009. Predominance of soot-mode ultrafine particles in Santiago de Chile: Possible sources. Atmos. Environ. 43:2260–2267. doi:10.1016/j.atmosenv.2009.01.047
- Gupta, R.K., D. Majumdar, J.V. Trivedi, and A.D. Bhanarkar. 2012. Particulate matter and elemental emissions from a cement kiln. Fuel Process. Technol. 104:343–351. doi:10.1016/j.fuproc.2012.06.007
- Health Effects Institute. 2013. Understanding the Health Effect of Ambient Ultrafine Particles. HEI Perspectives 3. Boston, MA: Health Effects Institute.
- Hoek, G., H. Boogaard, A. Knol, J. de Hartog, P. Slottje, J.G. Ayres, P. Borm, B. Brunekreef, K. Donaldson, F. Forastiere, et al. 2010. Concentration response functions for ultrafine particles and all-cause mortality and hospital admissions: Results of a European expert panel elicitation. Environ. Sci. Technol. 44:476–482. doi:10.1021/es9021393
- Hussein, T., T. Glytsos, J. Ondracek, P. Dohányosová, V. Zdímal, K. Hämeri, M. Lazaridis, J. Smolík, and M. Kulmala. 2006. Particle size characterization and emission rates during indoor activities in a house. Atmos. Environ. 40:4285–4307. doi:10.1016/j.atmosenv.2006.03.053
- Jons, E., S. Hundebol, and K. Clausen. 2008. New reason For installing a chloride by-pass. Interaction between chloride and sulphur. Paper presented at 2008 IEEE Cement Industry Technical Conference Record, Miami, FL, May 16–22, 2008.
- Kalacic, I. 1973. Chronic non specific lung disease in cement workers. Arch. Environ. Health 26:78–83. doi:10.1080/00039896.1973.10666228
- Kousaka, Y., K. Okuyama, and M. Adachi. 1985. Determination of particle size distribution of ultra-fine aerosols using a differential mobility analyzer. Aerosol Sci Technol. 4:209–225. doi:10.1080/02786828508959049
- Kuhlbusch, T.A.J., and C. Asbach. 2011. Particle characterization. In Cardiovascular Effects of Inhaled Ultrafine and Nanosized Particles, ed. F.R. Cassee, N.L. Mills, and D.E. Newby, 61–87. Hoboken, NJ: John Wiley & Sons, Inc.
- Kumar, P., P. Fennell, and A. Robins. 2010. Comparison of the behaviour of manufactured and other airborne nanoparticles and the consequences for prioritising research and regulation activities. J. Nanopart. Res. 12: 1523–1530. doi:10.1007/s11051-010-9893-6
- Kumar, P., L. Pirjola, M. Ketzel, and R.M. Harrison. 2013. Nanoparticle emissions from 11 non-vehicle exhaust sources—A review. Atmos. Environ. 67:252–277. doi:10.1016/j.atmosenv.2012.11.011
- Luther, W. 2004. Technological Analysis Industrial Application of nanomaterials—Chances and Risks. Technology Analysis. Düsseldorf, Germany: Future Technologies Division of VDI Technologiezentrum, with the support of the European Commission.
- Maghun, J., E. Karg, A. Kettrup, and R. Zimmermann. 2003. On-line analysis of the size distribution of fine and ultrafine aerosol particles in flue and stack gas of a municipal waste incineration plant: Effect of dynamic process control measures and emission reduction devices. Environ. Sci. Technol. 37:4761–4770. doi:10.1021/es020227p
- Maier, K.L., F. Alessandrini, F. Beck-Speier, T.P.J. Hofer, S. Diabaté, E. Bitterle, T. Stöger, T. Jakob, H. Behrendt, M. Horsch, et al. 2008. Health effects of ambient particulate matter—Biological mechanisms and inflammatory responses to in vitro and in vivo particle exposures. Inhal. Toxicol. 20:319–337. doi:10.1080/08958370701866313
- Meo, S.A., M.A. Azeem, M.G. Ghori, and M.M.F. Subhan. 2002. Lung function and surface electromyography of intercostal muscles in cement mill workers. Int. J. Occup. Med. Health 15:279–287.
- Mönkkönen, P., R. Uma, D. Srinivasan, I.K. Koponen, K.E.J. Lehtinen, K. Hämeria, R. Suresh, V.P. Sharma, M. Kulmala. 2004. Relationship and variations of aerosol number and PM10 mass concentrations in a highly polluted urban environment—New Delhi, India. Atmos. Environ. 38: 425–433. doi:10.1016/j.atmosenv.2003.09.071
- Morawska, L., Z. Ristovski, E.R. Jayaratne, D.U. Keogh, and X. Ling. 2008a. Ambient nano and ultrafine particles from motor vehicle emissions: Characteristics, ambient processing and implications on human exposure. Atmos. Environ. 42:8113–8138. doi:10.1016/j.atmosenv.2008.07.050
- Morawska, L., S. Thomas, W. Hofmann, Z. Ristovski, M. Jamriska, T. Rettenmoser, and S. Kagerer. 2004. Exploratory cross-sectional investigations on ambient submicrometer particles in Salzburg, Austria. Atmos. Environ. 38:3529–3533. doi:10.1016/j.atmosenv.2004.03.024
- Morawska, L., S. Thomas, D.U. Keogh, and K. Mengersen. 2008b. Modality in ambient particle size distributions and its potential as a basis for developing air quality regulation. Atmos. Environ. 42:1617–1628. doi:10.1016/j.atmosenv.2007.09.076
- Murphy, S.M., H. Agrawal, A. Sorooshian, L.T. Padró, H. Gates, S. Hersey, W.A. Welch, H. Jung, J.W. Miller, D.R. Cocker, III, et al. 2009. Comprehensive simultaneous shipboard and airborne characterization of exhaust from a modern container ship at sea. Environ. Sci. Technol. 43:4626–4640. doi:10.1021/es802413j
- Perrino, C., M. Catrambone, M. Rotatori, and R. Ferrero. 2010. Calculating the chemical composition of particulate matter. World Cement Magazine, UK. www.worldcement.com (accessed March 6, 2014).
- Pey, J., X. Querol, A. Alastuey, S. Rodríguez, J.P. Putaud, and R. Van Dingenen. 2009. Source apportionment of urban fine and ultra fine particle number concentration in a western Mediterranean city. Atmos. Environ. 43:4407–4415. doi:10.1016/j.atmosenv.2009.05.024
- Rodriguez, S., R. Van Dingenen, J.-P. Putaud, A. Dell’Acqua, J. Pey, X. Querol, A. Alastuey, S. Chenery, K.-F. Ho, R. Harrison, et al. 2007. A study on the relationship between mass concentrations, chemistry and number size distribution of urban fine aerosols in Milan, Barcelona and London. Atmos. Chem. Phys. 7:605–639. doi:10.5194/acpd-7-605-2007
- Sutou K., H. Harada, and N. Ueno. 2001. Chlorine bypass system for stable kiln operation and recycling of waste. Paper presented at Technical Conference on Cement Process Engineering, 21st Plenary Session of the VDZ Process Engineering Committee, Düsseldorf, Germany, February 22, 2001.
- Terzano, C., F. Di Stefano, V. Conti, E. Graziani, and A. Petroianni. 2010. Air pollution ultrafine particles: Toxicity beyond the lung. Eur. Rev. Med. Pharmacol. Sci. 14:809–821.
- Voigtlander, J., T. Tuch, W. Birmili, and A. Wiedensohler. 2006. Correlation between traffic density and particle size distribution in a street canyon and the dependence on wind direction. Atmos. Chem. Phys. 6:4275–4286. doi:10.5194/acp-6-4275-2006
- Wählin, P. 2009. Measured reduction of kerbside ultrafine particle number concentrations in Copenhagen. Atmos. Environ. 43:3645–3647. doi:10.1016/j.atmosenv.2009.04.023
- Wang, Y., P.K. Hopke, D.C. Chalupa, and J. Utell. 2011. Long-term study of urban ultrafine particles and other pollutants. Atmos. Environ. 45:7672–7680. doi:10.1016/j.atmosenv.2010.08.022
- Weber, S. 2009. Spatio-temporal covariation of urban particle number concentration and ambient noise. Atmos. Environ. 43:5518–5525. doi:10.1016/j.atmosenv.2009.06.055
- Yi, H., J. Hao, L. Duan, X. Li and X Guo. 2006. Characteristics of inhalable particulate matter concentration and size distribution from power plants in China. J. Air Waste Manage. Assoc. 56:1243–1251. doi:10.1080/10473289.2006.10464590
- Zhang, Q., R.H. Gangupomu, D. Ramirez, and Y. Zhu. 2010. Measurement of ultrafine particles and other air pollutants emitted by cooking activities. Int. J. Environ. Res. Public Health 7:1744–1759. doi:10.3390/ijerph7041744