
Abstract
The objectives of this study were to quantify real-world activity, fuel use, and emissions for heavy duty diesel roll-off refuse trucks; evaluate the contribution of duty cycles and emissions controls to variability in cycle average fuel use and emission rates; quantify the effect of vehicle weight on fuel use and emission rates; and compare empirical cycle average emission rates with the U.S. Environmental Protection Agency’s MOVES emission factor model predictions. Measurements were made at 1 Hz on six trucks of model years 2005 to 2012, using onboard systems. The trucks traveled 870 miles, had an average speed of 16 mph, and collected 165 tons of trash. The average fuel economy was 4.4 mpg, which is approximately twice previously reported values for residential trash collection trucks. On average, 50% of time is spent idling and about 58% of emissions occur in urban areas. Newer trucks with selective catalytic reduction and diesel particulate filter had NOx and PM cycle average emission rates that were 80% lower and 95% lower, respectively, compared to older trucks without. On average, the combined can and trash weight was about 55% of chassis weight. The marginal effect of vehicle weight on fuel use and emissions is highest at low loads and decreases as load increases. Among 36 cycle average rates (6 trucks × 6 cycles), MOVES-predicted values and estimates based on real-world data have similar relative trends. MOVES-predicted CO2 emissions are similar to those of the real world, while NOx and PM emissions are, on average, 43% lower and 300% higher, respectively. The real-world data presented here can be used to estimate benefits of replacing old trucks with new trucks. Further, the data can be used to improve emission inventories and model predictions.
Implications: In-use measurements of the real-world activity, fuel use, and emissions of heavy-duty diesel roll-off refuse trucks can be used to improve the accuracy of predictive models, such as MOVES, and emissions inventories. Further, the activity data from this study can be used to generate more representative duty cycles for more accurate chassis dynamometer testing. Comparisons of old and new model year diesel trucks are useful in analyzing the effect of fleet turnover. The analysis of effect of haul weight on fuel use can be used by fleet managers to optimize operations to reduce fuel cost.
Introduction
The United States generates about 250 million tons of municipal solid waste (MSW) annually (U.S. Environmental Protection Agency [EPA], 2014a), which is transported to landfills, transfer stations, or recycling facilities by a fleet of 140,000 refuse trucks (RT), predominantly diesel, that average 25,000 miles per year (Cannon, Citation2006). In recent years, compressed natural gas (CNG) refuse trucks have seen increased adoption; however, they constitute only about 6% of the current national fleet (NGVAmerica, Citation2014). Refuse trucks, classified as heavy-heavy-duty vehicles (HHDV), come in various configurations including rear-loader, side-loader, front-loader, and roll-off (Washington State Department of Labor & Industries, Citation2004). Previous studies of rear- and side-loader RTs, which collect residential trash, indicate average fuel economy of 1 to 3 miles per gallon (Agar et al., Citation2007; Ivanič, Citation2007; Thiruvengadam et al., Citation2010). Diesel engines, typically, have low carbon monoxide (CO) and hydrocarbons (HC) emission rates (Clark et al., Citation2002). However, they emit substantial amounts of nitrogen oxides (NOx), particulate matter (PM), and carbon dioxide (CO2) (EPA, 2013c; U.S. Department of Transportation [DOT], Citation2010). NOx and PM are criteria pollutants regulated under the National Ambient Air Quality Standards (NAAQS), while CO2 is a greenhouse gas. Short-term exposure to NOx is linked to adverse respiratory effects and NOx is a precursor to tropospheric ozone formation, which can harm lung function in children, the elderly, and people with asthma (EPA, Citation2008). PM is linked to various respiratory and cardiovascular problems (EPA, Citation2009b). In the past, diesel PM emissions have been identified as toxic air contaminants (California Air Resources Board [CARB], Citation1998) and “reasonably anticipated to be a human carcinogen” (National Toxicology Program [NTP], Citation2014). In recent years, diesel PM has been identified as carcinogenic (World Health Organization [WHO]–IARC, 2012).
Roll-off refuse trucks (RORT) are used to haul MSW, construction and demolition (C&D), and commercial cardboard waste. However, data regarding real-world duty cycles, fuel use, and emission rates of these trucks are lacking.
Existing refuse truck emission factors are mostly based on rear- and side-loader RTs (Farzaneh et al., Citation2009; Lee et al., Citation2011; Ramamurthy and Clark, Citation1999; Walkowicz et al., Citation2003). No studies have been identified regarding the real-world activity, fuel use, and emissions from RORTs. RORTs typically collect 5 to 10 cans daily of 15 to 40 cubic yards each, compared to 100 to 200 cans of 2 to 8 cubic yards each for front-loader RTs and 500 to 1200 cans of 48 to 96 gallons each for rear- and side-loader RTs. RORTs generally collect significantly more weight in a day compared to side- and front-loader RTs (Merrill, Citation2000). RORTs visit the transfer station or landfill once for each can collected, compared to typically two to four visits per day for front-loader RTs and one to two visits per day for rear- and side-loader RTs. Thus, compared to rear-, side-, and front-loader RTs, RORT have more freeway driving to get to the transfer station or landfill, and only infrequent maneuvering related to waste collection. Unlike rear-, side-, and front-loader RTs, RORTs do not have on-board compaction units; therefore, there is no auxiliary power requirement for compaction. Based on differences in activity patterns and absence of compaction, it is expected that RORT will have higher fuel economy compared to rear-, side-, and front-loader RTs.
Roll-off refuse trucks are typically used for commercial waste and thus are most often operated by companies rather than municipal governments. As such, data regarding the numbers of such trucks are not available nationally. As an example, RORTs comprise 25% of the fleet of more than 1,000 refuse trucks at the commercial waste collection company that participated in this study.
Background
This section briefly describes (a) emission standards applicable to refuse trucks and associated emissions control technologies; (b) chassis dynamometer driving cycles used for evaluation of refuse truck fuel use and emissions; (c) variability in refuse truck emissions reported in the literature, which serves as motivation for study design aspects such as selection of vehicles; (d) the effect of weight on fuel use and emissions; and (e) the Motor Vehicle Emission Simulator (MOVES) vehicle emission factor model.
Emissions standards
U.S heavy-duty trucks are subject to 40 CFR 86 emission standards, which require a sample engine from an engine make and model family to undergo testing on an engine dynamometer (U.S. Government Printing Office [GPO], 2014, sec. 401). These tests do not account for the real-world effects of power train and chassis dynamics and actual daily activity. The unit of test activity is brake horsepower-hours (bhp-hr). PM and NOx exhaust emission standards for heavy-duty highway compression-ignition engines apply to the engines used in refuse trucks (EPA, Citation2013a). Emission standards and associated emission controls are expected to be a significant factor affecting variability in RORT emissions. However, for developing emission inventories, truck activity is more conveniently quantified in terms of time or distance, and truck emission factors should account for the overall energy efficiency of the entire vehicle, not just the engine alone.
Emission standards have changed in recent years. NOx and nonmethane hydrocarbons (NMHC) were regulated jointly during 2004 to 2006 and a typical acceptable NOx emission rate under this standard was approximately 2.0 g/bhp-hr (EPA, Citation2013a). During 2007 to 2010, a NOx emission limit of 0.2 g/bhp-hr was phased in. Exhaust gas recirculation (EGR) has been used to meet the 2004 to 2006 standard, and EGR in combination with selective catalytic reduction (SCR) is used to meet the 2010 standard (Sandhu and Frey, Citation2012; EPA, Citation2013b).
The PM standard was 0.1 g/bhp-hr in 1998 and was lowered to 0.01 g/bhp-hr in 2007 (EPA, Citation2013a). Diesel oxidation catalysts (DOCs) and diesel particulate filters (DPFs) have been used to meet the 2007 standards (Sandhu and Frey, Citation2012; EPA, Citation2013b). DPFs change the NO2/NOx ratio of the exhaust. NO2/NOx ratios over a wide range, of 0.05 to 0.70, have been reported (Herner et al., Citation2009; Tang et al., Citation2004; Khalek et al., Citation2011; Kittelson et al., Citation2006), representing either intertruck variability or intratruck variability associated with variation in operating conditions. Based on a remote sensing study, the NO2/NOx ratio, reported as an average with 95% confidence interval, is 0.037 ± 0.003 and 0.28 ± 0.12 for trucks without and with DPF, respectively (Dallmann et al., Citation2012). These latter values are deemed to be indicative of average values for in-use trucks.
Chassis dynamometer driving cycles
Selected side-loader RTs have been measured using chassis dynamometers. Some tests are based on the Central Business District (CBD) cycle, which is a 2.0-mile repetitive series of acceleration, 20-mph cruising, and deceleration (DieselNet, Citation2000). The CBD cycle is intended to represent the driving cycle of an urban bus. The New York Garbage Truck (NYGT) cycle is based on a sequence of accelerations and decelerations with peak speeds of 5 mph and 20 mph (Clark et al., Citation1998). The William H. Martin (WHM) refuse truck cycle is based on analysis of recorded “microtrips” and includes portions for onroad driving and trash collection (Walkowicz et al., Citation2003). The NYGT and WHM cycles are designed to represent residential trash collection by rear- and side-loader RTs. There is not an available RORT driving cycle.
Variability in refuse truck emissions
Only one study was found on RORT real-world activity and no studies were found regarding RORT fuel use and emission rates. This section briefly reviews a few studies on residential trash collection RTs to demonstrate the variability in fuel use and emission rates due to vehicle make and model year, test cycles, and emission controls. Results from this work are later compared with information presented here.
Real-world NOx emission rates for three 2002 to 2006 model year side-loader RTs were reported as 90 g/mile to 203 g/mile during trash collection and 11 g/mile to 12 g/mile during highway driving (Farzaneh et al., Citation2009). The average speed range was 1.7 mph to 3.3 mph for trash collection and 52.9 mph to 56.4 mph for highway driving. The PM emission rates ranged from 1.1 g/mile to 2.7 g/mile during trash collection and from 0.19 g/mile to 0.23 g/mile during highway driving. CO emission rates ranged from 8.3 g/mi to 38.2 g/mile and from 1.2 g/mile to 3.6 g/mile for trash collection and highway driving, respectively.
In a chassis dynamometer test using the CBD cycle, the average NOx emission rate from a 1992 model year refuse truck was 29 g/mile (Gautam et al., Citation1992). When tested on another cycle, the same truck had NOx emissions of 23 g/mile (Clark et al., Citation2002). PM emission rates ranged from 0.63 g/mile to 1.1 g/mile among the same two measurements, and CO emission rates ranged from 3 g/mile to 9 g/mile.
In a study based on WHM cycle-based chassis dynamometer measurements of a 2002 refuse truck, the engine-out NOx emission rate without any emissions control devices was typically 45 g/mile and SCR achieved 87% to 95% reduction (Block et al., Citation2005). The PM emissions were approximately 0.68 g/mile and 0.35 g/mile without and with DPF, respectively, which is a 49% reduction. For the same truck, a year later, the PM emission rates were 1.1 g/mile and 0.2 g/mile without and with DPF, an 81% reduction.
DPF performance is sensitive to the NOx/PM ratio (preferably 25:1 or higher) and exhaust temperature (preferably 250°C or higher). In an in-use study of the activity of 10 RORTs, only one truck was found to have sufficiently high exhaust temperatures (Reul-Chen et al., Citation2005).
Effect of vehicle weight on fuel use and emission rates
Vehicle weight affects truck fuel use and emissions (Clark et al., Citation2002). CO2, NOx, and PM rates of a 2005 diesel front-loader RT increased by 15%, 19%, and 4%, respectively, when comparing the highest 25th percentile of RT weight with lowest 25th percentile of RT weight during a refuse collection duty cycle (Sandhu et al., Citation2014). Side-loader RT NOx emission rates for loaded versus empty were similar for uphill driving and short acceleration and higher by 12% to 17% for street and highway driving (Lee et al., Citation2011).
A study of class-8 tractor-trailers found that the marginal effect of weight on fuel use is nonlinear and varies with road grade and vehicle speed (Oak Ridge National Laboratory [ORNL], Citation2011). The marginal effect of weight on emissions decreases as the vehicle weight increases (Strimer et al., Citation2005). Based on real-world on-road emissions from a tractor-trailer, for a 54% increase in vehicle weight, NOx emissions in g/mile were found to increase by at least 40% during strong acceleration and high-speed steady-state modes (Brodrick et al., Citation2004).
Based on real-world measurements, loaded dump trucks had approximately 30% higher fuel consumption than when empty (Frey and Kim, Citation2006). Loaded concrete mixer trucks had 60% higher fuel use rate and 50% higher NOx and PM emission rates (Frey and Kim, Citation2009).
In a chassis dynamometer study of transit buses and tractor-trailer trucks, NOx emissions increased by approximately 54% for a doubling of vehicle weight (Gajendran and Clark, Citation2003).
MOVES model
MOVES is the official model of the EPA for estimating highway vehicle fleet emissions and fuel consumption (EPA, Citation2014c). In the project-level analysis feature, MOVES allows the user to enter a driving cycle or a time fraction distribution for Operating Mode (OpMode) bins (EPA, Citation2012a). MOVES includes refuse trucks as a source type because they are expected to differ from other trucks in terms of drive schedule (EPA, Citation2009a). A drive schedule is a second-by-second sequence of speed, acceleration, and road grade. However, the MOVES database for refuse truck activity and emission factors is limited and needs better characterization (EPA, Citation2010).
For heavy-duty vehicles, MOVES quantifies average fuel use and emission rates for OpMode bins that are stratified based on braking, idling, vehicle speed, and scaled tractive power (STP) (EPA, Citation2012b). STP is an estimate of the power output of the engine. STP is estimated similarly to vehicle specific power (VSP). VSP is a well-established estimate of engine power demand based on changes in kinetic and potential energy and the energy needed to overcome air drag and rolling friction (Jiménez-Palacios, Citation1999). Unlike VSP, STP is not normalized to the vehicle weight but is “scaled” to fit predefined modes. Thus, the units of STP are scaled kW. The OpMode bins can be weighted by the fraction of time associated with any driving cycle to estimate cycle average rates.
Objectives
The preceding discussion highlights the lack of real-world data for refuse trucks and specifically, the absence of any study on real-world fuel use and emissions from RORTs. The research questions addressed here are: (1) What are the real-world OpMode based duty cycles and rates of fuel use and emissions for roll-off refuse trucks? (2) What is the intertruck and intercycle variability in cycle average fuel use and emission rates? (3) What is the effect of weight on roll-off refuse truck fuel use and emission rates? (4) How do MOVES predicted cycle average emission rates compare with real-world estimates?
Methods
This section discusses study design; instrumentation to record RORT activity, fuel use, and emissions; quality assurance and data analysis procedures; definition of activity-based cycles; definition of weight-based cycles; and comparison to MOVES.
Study design
Six RORTs that cover a range of model years and emissions control technologies were selected for measurement. All vehicles were fueled with ultra-low-sulfur diesel (ULSD). All vehicles were owned and operated by a commercial waste collection company. Measurements were made during normal workdays for regular routes driven by regular professional drivers. The vehicles typically started their route at 6 a.m. and returned between 4 and 5 p.m. Vehicles were weighed, at entry and exit, during each visit to the transfer station or landfill. Vehicles were also weighed without a can to get the chassis weight.
Instrumentation
Measurements of tailpipe emissions were made using the OEM-2100AX Axion portable emissions measurement system (PEMS) from Global MRV. This PEMS has two parallel-operation five-gas analyzers. For HC, CO, and CO2, the detection method is nondispersive infrared (NDIR), and for nitric oxide (NO) and O2, the detection method is electrochemical sensing. PM is measured using laser light scattering (Clean Air Technologies International, Inc. [CATI], Citation2008; Vojtisek-Lom and Allsop, Citation2001). Battelle compared the PEMS to standard testing equipment using 40 CFR Part 86 reference methods (Battelle, Citation2003). The comparison results indicated that CO, CO2, and NOx measurements from the PEMS are accurate to within 10% of reference measurements. HC measurements are biased low by a factor of approximately 2 because the PEMS used NDIR and the reference method used flame ionization detection (FID) (Battelle, Citation2003; Singer et al., Citation1998). NO measurements are reported as equivalent mass of NO2 and termed NOx in this paper. For vehicles without DPF, typically, more than 95% of NOx emissions by volume is NO (Dallmann et al., Citation2012). The laser light scattering technique is calibrated to report PM mass per volume ratio and such measurements are considered semiquantitative. Such methods have been found to have good correlation with more precise methods such as the tapered element oscillating microbalance (TEOM) (Jamriska et al., Citation2004). The PM measurements are used for relative comparisons between the trucks, operating modes, and cycle averages using a consistent method.
All vehicles have a nine-pin Deutsch connector type electronic control unit (ECU) port. Using a scantool, key recorded ECU variables include engine revolutions per minute (RPM), intake air temperature (IAT), manifold absolute pressure (MAP), fuel use rate based on injector pulse width, engine load, and vehicle speed. When MAP is not available from the ECU, as was the case for two trucks, a pressure sensor, connected at the intake manifold, was used to measure the required values. Garmin 76CSx global positioning system (GPS) receivers with barometric altimeters were used to record vehicle position and changes in elevation.
Data analysis
Quality assurance procedures, detailed elsewhere (Sandhu and Frey, Citation2013), were applied to the recorded data. Data from PEMS, ECU, and GPS, each recorded at 1 Hz, were checked for the occasional missing value, which was then imputed using linear regression. All of the ECU and GPS data were time-aligned to the PEMS data. The combined data file was checked for (a) errors in engine data such as out-of-range values of RPM and MAP; (b) concentration measurement errors such as discrepancy between the readings from the parallel gas analyzers or negative emissions concentrations; (c) errors from including data while an analyzer is transitioning from exhaust sampling to ambient air sampling for zero span correction; and (d) errors from malfunction of the analyzers, such as nonresponsive readings.
Fuel molar flow rate is estimated as ECU reported fuel use rate divided by fuel molecular weight. Since almost all of the carbon species in the exhaust come from the combusted fuel, the fuel molar flow rate divided by sum of exhaust molar carbon fractions of CO2, CO, and HC equals the exhaust molar flow rate. The exhaust molar flow rate multiplied with the estimated exhaust molecular weight equals exhaust flow rate. When ECU fuel use rate is not available, exhaust flow rate is estimated based on engine mass air flow estimated from the speed–density method, air-to-fuel ratio inferred from the measured exhaust gas composition, and fuel composition (Sandhu and Frey, Citation2013; Vojtisek-Lom and Cobb, Citation1998). In the speed–density method, engine mass air flow is estimated using the ideal gas law based on engine operation parameters RPM, IAT, and MAP, engine specifications of displacement and compression ratio, and volumetric efficiency to correct for real versus theoretical air flow. Measured exhaust pollutant concentration and estimated exhaust flow rate are used to estimate mass per time fuel use and emission rates at 1 Hz. Road grade was estimated for 0.1 mile road segments based on the slope of a linear least square fit to barometric altimeter elevation and GPS position data (Sandhu and Frey, Citation2013).
Because measurements made in the field are subject to variation in road grade, the STP equation reported by the EPA (EPA, Citation2010; EPA, Citation2009a) is modified to include road grade:
where STPt is the scaled tractive power at time t (skW), A is the rolling resistance coefficient (kW-s/m), B the rotational resistance coefficient (kW-s2/m2), C the aerodynamic drag coefficient (kW-s3/m3), at the vehicle acceleration at time t (m/s2), g the acceleration due to gravity (9.81 m/s2), m the vehicle mass (metric tons), rt the road grade at time t (%), vt the vehicle speed at time t (m/s), and fscale the scaling factor.
For refuse trucks, the EPA specifies the following values: A = 1.41705 kW-s/m; B = 0 kW-s2/m2; C = 0.003572 kW-s3/m3; m = 20.6845 metric ton; and fscale = 17.1 unitless. An operating mode (OpMode) identifier (ID) is assigned to each second of data as per the speed, acceleration, and STPt scheme given later in .
OpMode average fuel use and emission rates are estimated for each truck for each OpMode. The OpMode average fuel use and emissions rate is the average of all seconds of data assigned to that OpMode. To estimate cycle average rates, the mass per time OpMode average rate is multiplied by the time spent in the same OpMode, summed over all OpModes, and divided by the total travel time or distance.
Activity-based cycles
The main activities of the RORTs are labeled as: urban (U), highway (H), trash collection (TC), and landfill or transfer station (L/TS). Urban includes driving on feeder/collector, minor arterial, and major arterial roads with stop control or signalized intersections. Highway includes driving on restricted access highways and ramps. Trash collection includes short-distance driving and maneuvering, such as across a parking lot, to reach a can site, idling while waiting to gain access to the can, and can collection/drop. Landfill or transfer station includes short-distance driving, such as on a dirt track, to reach the entry point of a landfill or transfer station, and activities inside the landfill or transfer station, such as driving, idling, or emptying can contents. The truck engine was kept running during driver lunch breaks for the purpose of maintaining power to the measurement instruments and to enable inspection of instrument operation; these time periods are not included in activity-based analysis.
The term duty cycle refers to U, H, TC, and L/TS activities related to collecting, transporting, and emptying one loaded can. Typically, a RORT will have five to seven duty cycles during one full day of work. On most occasions the empty can is placed back where it was collected. However, sometimes the truck might start from the yard with an empty can, which replaces the first loaded can to be collected, while the loaded can is emptied at the landfill or transfer station and used as replacement for the second can to be collected, and so on. The term Daily Activity Cycle refers to the multiple duty cycles observed during one full day of truck operation plus any U, H, TC, L/TS activities related to non-duty-cycle work, such as driving to and placing a can at the premises of a new customer or moving cans around within a transfer station.
Weight-based cycles
The total weight of a RORT depends on wheher a can is carried and, if so, the weight of the can and the weight of trash, if any, within the can. RORTs differ in this regard from rear-, side-, and front-loader RTs, none of which transport any cans from which trash is collected.
Three weight states are defined: (1) No Can refers to the weight of the truck without a can, which is the same as the chassis weight; (2) Empty Can refers to the combined weight of the truck and of an empty can carried by the truck; and (3) Loaded Can refers to the combined weight of the truck, the can itself, and trash within the can. Time spent in the No Can weight scenario is referred to as the No Can cycle. Similarly, the times spent in the Empty Can and Loaded Can states are the Empty Can and Loaded Can cycles, respectively. Additionally, Collect/Drop and Tipping cycles are defined to account for the time when the truck is transitioning between any two of the No Can, Empty Can, and Loaded Can cycles. Collect/Drop refers to collecting a can from the ground or placing it on the ground. Tipping refers to emptying a loaded can at a landfill or transfer station. An Overall Cycle is defined that includes the weight states and can-related activities in proportion to time spent. The Overall Cycle is used only to estimate overall OpMode modal averages and thus includes periods of activity not included in the Daily Activity Cycle, such as idling during lunch, since the fuel use and emission rates measurements during such period are valid data.
Several steps were taken to evaluate the effect of weight on fuel use and emissions. First, cycle average fuel use and emissions were estimated for each truck for the No Can, Empty Can, and Loaded Can cycles. The Collect/Drop and Tipping cycles were not used for assessment of the effect of weight because these two cycles have variability in weight status. Cycle averages were compared for a truck and across all trucks. Second, modal average fuel use and emissions rates for each OpMode bin are estimated for each truck for the No Can, Empty Can, and Loaded Can cycles. For each OpMode bin for each truck, the difference in fuel use and emission rates is estimated for Loaded Can versus No Can (L/N), Empty Can versus No Can (E/N), and Loaded Can versus Empty Can (L/E). Third, the average difference was estimated, based on an average of six trucks, for each OpMode, for the L/N, E/N, and L/E. Fourth, for each truck, the error is estimated from using the Overall cycle OpMode average rates instead of the No Can OpMode average rates for the No Can cycle (O/N case) and similarly, the error is estimated for the Overall vs. Empty Can case (O/E) and Overall versus Loaded Can case (O/L).
Comparison to MOVES
MOVES2010b was used here. Overall Cycle OpMode-based modal average fuel use and emission rates for each of the six measured trucks were combined with the OpMode-based Daily Activity Cycles of each of the six trucks to create a total of 36 Daily Activity Cycle average results. Using the project level feature in MOVES2010b, Daily Activity Cycle averages are estimated for the same model years, OpMode based Daily Activity Cycles, calendar years, and ambient conditions as real-world measurements. Differences between empirical and MOVES2010b Daily Activity Cycle average and totals are expected since MOVES2010b estimates fleet averages and the empirical cases are for six specific vehicles. Furthermore, MOVES2010b emission factors for refuse trucks are based on measurements of single-unit medium-heavy and heavy-heavy duty vehicles that were not engaged in refuse collection (EPA, Citation2010). MOVES2010b emission factors are based on vehicles up to model year 2006. MOVES2010b emission factors for model year 2007 and newer are extrapolated based on trends in emission standards (EPA, Citation2012b).
A new version, MOVES2014, was announced in the Federal Register on October 7, 2014 (EPA, Citation2014b), after the work reported here had been completed. MOVES2010b can be used for project-level conformity analysis until October 2016. There is little documentation regarding how MOVES2014 differs from MOVES2010b with respect to refuse trucks (EPA, Citation2014c). Based on communication with EPA staff, we understand that the changes related to refuse trucks include a modest 11.7% increase in the mass assumed for refuse trucks, some updates to emission rates for 2003 to 2010 model year trucks, and some adjustments regarding how refuse trucks are classified with respect to regulatory classes. We discuss implications of the MOVES2014 update versus MOVES2010b in the Conclusions section.
Results
Detailed results are given for truck operations; observed activity-based cycles; OpMode bin fuel use and emission rates; cycle average rates and variability; effect of truck weight on fuel use and emissions; and comparison of measured emissions with MOVES2010b predicted values.
On average, 4% of raw data was excluded as a result of quality assurance. For Truck 2441, 5% of raw data was excluded because of gas analyzer malfunction errors. For Truck 2339, 17% of raw data was excluded due to gas analyzer malfunction, of which 13% was because one gas analyzer was not working. Thus, when the working gas analyzer would automatically zero span calibrate every 10 minutes, for approximately 1 minute each time, exhaust concentrations could not be measured. For the two newer trucks, 2412 and 2413, less than 0.01% of raw data was excluded. For all trucks, negligible amounts of raw data were excluded due to errors related to ECU or GPS. The total of quality-assured PEMS data is approximately 178,000 seconds covering 733 miles of operation. The total of quality-assured ECU and GPS data is over 210,000 seconds, of which 195,000 seconds is included as Daily Activity Cycle data, covering 867 miles of operation.
Vehicles and operations
The six RORTs, which span chassis and model years from 2005 to 2012, were operated in the Raleigh, NC, metropolitan area. Truck chassis and engine details are provided in . All vehicles have similar engine displacement, engine horsepower, gross vehicle weight rating, and chassis weight. All trucks have EGR and the two 2012 model year trucks also have DPF and SCR. On average, these trucks have accumulated 58,700 miles and 2,900 operating hours per year. Thus, these RORTs travel twice the miles per year as compared to previously reported numbers for national fleet and front-loader RTs (Cannon, Citation2006; Sandhu et al., Citation2014). During measurement, the trucks traveled 869 miles, consumed 199 gallons of diesel fuel, collected 38 trash cans, and collected 165 tons of trash. The weight of trash per can ranged from 0.5 to 13.1 tons, with an average of 4.4 tons. Most of the cans were 30 cubic yard size, while a few were 40 cubic yards. Gas pump fuel economy ranged from 3.5 to 5.7 miles per gallon (mpg), which is higher than the 2 to 3 mpg reported earlier for other types of refuse trucks. The average fuel economy is 4.4 mpg based on total miles traveled over total fuel used. The actual fuel use from the gas pump averaged within 2% of the ECU reported aggregated fuel use.
Table 1. Characteristics and activity summary of measured roll-off refuse trucks
Daily activity
The 95% frequency ranges for observed speed, acceleration, and road grade across all trucks are 0 mph to 63.6 mph, –2.2 mph/s to 1.7 mph/s, and –5.1% to 6.1%, respectively. The average speed is 15.9 mph.
shows the contribution of truck activities, including U, H, TC, and L/TS, to the Daily Activity Cycle time, distance, fuel use, and emissions. On average, trucks spend less than 50% time in U and H. However, U and H activities together contribute 94% of the total distance, and 70% to 80% of fuel use and emissions. Compared to side-loader RTs, where TC is high and U is low contributor of emissions (Farzaneh et al., Citation2009), the contribution of TC is lower and U is higher for RORT because of less time spent in trash collection and more trips per day to the landfill or transfer station. Mass per time rates are lowest and mass per distance rates are highest for TC and L/TS activities since the trucks is engaged in lower power and lower speed operation as compared to urban and highway driving. There is considerable intervehicle variability in the contribution of individual activities toward daily activity totals, as shown in the lower half of . For example, the daily fraction of time driving on highways varied from 10% to 22%. The variability in daily fraction of time driving on urban roads and highways is typically because of differences in route or traffic. Factors leading to variability in time spent in trash collection or at a landfill or transfer station include blocked access to the can at a collection site and extended queuing, respectively.
An example speed trace is shown in , illustrating vehicle operation for one complete duty cycle during which a loaded can is collected, driven to a landfill, emptied, driven back to the customer site, and placed on the ground. The average speeds were 25 mph, 45 mph, 1 mph, and 1 mph for U, H, TC, and L/TS activities, respectively, and the corresponding fraction of total duty cycle time spent in each activity was 35%, 7%, 22%, and 37%, respectively. The time periods not marked in as loaded or unloaded are when the truck is maneuvering the can, which includes collecting, emptying, or placing the can. Overall, 38 complete duty cycles were measured. The duty cycle time ranged from 2,791 seconds to 8,626 seconds and the distance ranged from 10.9 miles to 38.9 miles.
Figure 1. Example time plot of 1 Hz speed based on Truck 2338 for one trash can collection duty cycle (n = 4,177 seconds). U, urban (arterial) driving, no trash collection; H, highway driving; L, landfill; TC, trash collection.
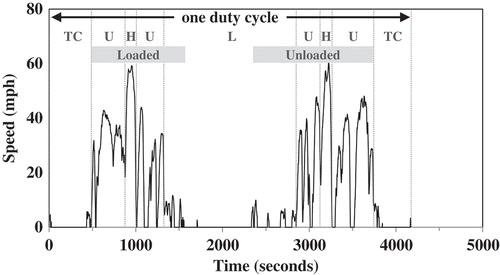
Table 2. Contribution of diesel roll-off refuse truck activities to Daily Activity Cycle time, distance, fuel use, and emissions
In , the observed Daily Activity Cycles are quantified in terms of the fraction of time in each OpMode bin for each truck. Also included are the OpMode time fractions for the CBD, NYGT, and WHM cycles. The distribution of time, based on the average plus or minus one standard deviation over the six trucks, is 47 ± 4% idling, 4 ± 1% braking or decelerating, 11 ± 2% coasting, 15 ± 1% cruising or accelerating at low speed (up to 25 mph), 11 ± 2% cruising or accelerating at moderate speed (25 to 50 mph), and 12 ± 2% cruising or accelerating at high speed (50 mph or higher).
Table 3. Distribution of time in operating mode bins and summary data for observed Daily Activity Cycles for six roll-off refuse trucks and selected chassis dynamometer cycles
The CBD, NYGT, and WHM cycles do not have OpMode time distributions similar to real-world observed cycles for RORT and are not based on activity patterns unique to such trucks. Compared to the observed cycles, the time spent in idle plus low speed modes is higher for the CBD and NYGT cycles and both cycles have zero time fractions for the moderate and high speed modes. Thus, the cycle average g/mile emission rates for CBD and NYGT cycles are expected to be higher compared to observed cycles. Compared to CBD and NYGT cycles, the WHM cycle has a time fraction distribution more similar to the observed cycles but it too has no time fraction in the high speed mode. Thus, compared to observed cycles, the WHM cycle is expected to produce somewhat higher g/mile rates but not as much as the CBD and NYGT cycles.
Modal fuel use and emission rates
OpMode rates are sensitive to engine power demand, which in turn depends on speed, acceleration, and road grade. OpMode average speed increases monotonically for low speed modes but is approximately constant for medium and high speed modes. OpMode average acceleration and road grade are negative for braking, deceleration, and coasting modes and positive increasing values for the low, medium, and high speed modes. Compared to speed, in the medium and high speed ranges, acceleration and road grade have greater contribution toward the increasing trend in engine power demand.
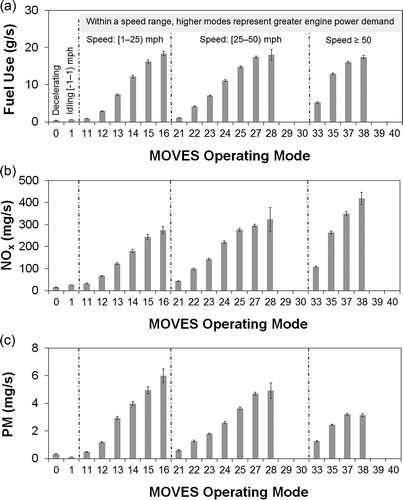
OpMode average fuel use and emission rates for the Daily Activity Cycle include the average effect of trash collection and transport. An example for OpMode average rates of fuel use, NOx emissions, and PM emissions for Truck 2338 is shown in . The fuel use and emissions rate for deceleration and braking are the lowest among all OpModes. The fuel use rate for idle (OpMode 1) includes can collection, dropping, and tipping. The additional work in maneuvering the can is expected to increase the idle fuel use rate, and thus, these rates should not be used to estimate idle fuel use rates for other types of vehicles. On average, the fuel use rate for OpMode 1 is 30% higher than when the truck is idling and not engaged in can operations. The fuel use and emissions rates of OpModes 11 and 21 are relatively low, as expected, given that there is negligible load on the engine. For each speed range, the fuel use and emissions rates increase monotonically with increasing positive STP, such as from OpModes 12 to 16, 22 to 28, and 33 to 38. There are no data for OpModes 29, 30, 39, and 40 because the vehicle did not operate at such conditions. The qualitative trends for fuel use and emissions rates for other trucks were approximately similar to those illustrated in . The trends in emission rates of NOx and PM are qualitatively similar to those for fuel use rate in that they tend to increase with engine load within a speed range.
Figure 2. Example of Overall Cycle operating mode average (a) fuel use rates, (b) NOx emissions rates, and (c) PM emissions rates, with 95% confidence intervals, for Truck 2338 (n = 36,983 seconds). These rates are averaged over all weight states. See for definitions of operating modes.
The relative variation between the highest and lowest OpMode average rate differed by truck and by variable. OpModes 29, 30, 39, and 40 are excluded here due to their low sample count. The ratio of the highest to lowest OpMode average fuel use rate varied from 44 to 143 among the six trucks, with an average of 53. On average over the six trucks, the relative variability in OpMode average emission rates of CO2, NOx, PM, CO, and HC are 62, 25, 22, 11, and 6, respectively. Thus, variations in engine load and vehicle speed lead to substantial variation in fuel use and emission rates. The two 2012 trucks with SCR emissions control had approximately five times more relative variability among OpMode NOx emission rates compared to the non-SCR trucks, but much lower absolute emission rates.
Intercycle and intertruck variability
The as-observed Daily Activity Cycle average fuel use and emission rates are estimated, followed by an evaluation of the contribution to variability in cycle average fuel use and emissions rates by (a) differences among as-observed Daily Activity Cycles and truck modal averages; (b) differences among the Daily Activity Cycles; and (c) differences among the trucks based on truck-specific differences in OpMode rates.
Observed cycle averages and real-world variability
shows cycle average rates and totals for fuel use and emissions for each truck based on observed daily activity particular to each truck. The estimated Daily Activity Cycle average fuel economy ranges from 4.0 to 6.2 mpg, which is comparable to the 3.5 to 5.7 mpg range estimated from gas pump refueling. The Daily Activity Cycle fuel economy is based on ECU reported fuel use rates and excludes any extended idling, such as lunch break, specifically to keep the engine running for the test. The gas pump fuel economy includes all time and activities between the fuel top-offs at start and end of measurement. The CO2 emissions rates for newer model year trucks are 27% lower compared to older model year trucks, most of which is related to better fuel economy. The intervehicle trends in the cycle average CO2 emission rates are correlated with the cycle average fuel use rates, since typically over 99% of carbon in the fuel is emitted as CO2. The OpMode average concentrations for CO and HC are generally near or below detection limit for many OpMode bins for all trucks except Truck 2441. Similar to the 2002 model year RT (Block et al., Citation2005),the reduction in CO levels for the two 2012 MY trucks is probably due to an oxidation catalyst included in the DPF. When comparing trucks with SCR to trucks without SCR, the observed reduction in NO is 87%. The estimated reduction in NOx, after correction for the NO2/NOx ratio for trucks with DPF (0.28) and without DPF (0.037), is 83%. The PM emission rates for trucks with DPFs are 95% lower compared to those without. Compared to a 2002 model year RT tested on a chassis dynamometer (Block et al., Citation2005), the NOx emissions for trucks without SCR here are about 60% less and the SCR percent reduction efficiency is similar. The DPF percent reduction efficiency here is higher compared to the 2002 model year RT. Further, unlike the in-use study of ten RORT (Reul-Chen et al., Citation2005), the exhaust conditions of the two with DPF trucks here do not limit DPF reduction efficiency.
Table 4. Average fuel use and emission rates and totals for in-use measurements of diesel roll-off refuse trucks based on Daily Activity Cycles
The variability in the observed Daily Activity Cycle average fuel use and emissions rates is evaluated using the ratio of maximum over minimum of the cycle average rates for the six trucks. The ratios for fuel economy and NOx and PM mass per distance emissions rates are 1.6, 13, and 43, respectively. The four older trucks without SCR or DPF constitute a cluster of high NOx and PM emission rates, and the two newer trucks with SCR and DPF constitute a cluster of low NOx and PM emission rates. If the two newer trucks are not considered, the variability is significantly lower, at only 1.1 for fuel economy and 1.2 and 1.9 for NOx and PM emissions rates, respectively. Overall, real-world PM emission rates have more relative variability compared to NOx emission rates, which is consistent with previous studies (Clark et al., Citation2002; Block et al., Citation2005).
Intercycle variability
The six observed Daily Activity Cycles are compared in using a common set of OpMode fuel use and emission rates based on an average of the six trucks. Also included in the comparison are the CBD, NYGT, and WHM cycles. The highest fuel economy is estimated for the Daily Activity Cycle observed for Truck 2412, which had less time in idle than other cycles. The lowest fuel economy is for the Daily Activity Cycle observed for Truck 2339, which had less time in high speed modes (speed ≥50 mph) than other cycles. The fuel economy ranges from 4 to 4.9 mpg. Overall, for the observed cycles, the max/min ratio is 1.3 for fuel economy and emissions rates. Thus, intercycle variability among the observed cycles is a small contributor to overall real-world variability.
The fuel economy of the CBD cycle (3.6 mpg) is slightly outside, NYGT cycle (1.6 mpg) is significantly outside, and WHM cycle (4.1 mpg) is within the range of fuel economy of the observed cycles. The observed Daily Activity Cycle average CO2 emission rates tend to be lower than those estimated based on the standard driving cycles, except for the WHM cycle. The observed cycle average CO, HC, and NOx emission rates are typically lower than those of the standard cycles, except that the WHM cycle average is close to the high end of the observed range. The PM emission rates are lower for the observed cycles than for any of the standard cycles.
Among the three standard cycles, on a mass per distance basis, the WHM cycle has the highest fuel economy and lowest average emission rate for each pollutant. Conversely, the NYGT cycle has the lowest fuel economy and highest average emission rates. The WHM cycle has time fractions closer to observed cycles, though it is missing time in high speed modes, and thus its cycle averages are within or near the range of cycle averages for observed cycles. The NYGT cycle has approximately 70% of time spent in idling, which leads to low mass per time but high mass per distance fuel use and emission rates. The estimated variability across standard cycles here is similar to or higher than, depending on pollutant, that seen for the 1992 model year truck tested on different chassis dynamometer cycles (Gautam et al., Citation1992; Clark et al., Citation2002).
Intertruck variability
Fuel use and emissions are compared between the six trucks in . This comparison is based on OpMode rates specific to each truck and an average Daily Activity Cycle. The latter is based on the six observed Daily Activity Cycles. Fuel economy varies from 4.0 to 4.4 mpg for the four older trucks, and from 5.0 to 5.6 mpg for the two newer trucks. Although the newer trucks have postcombustion DPF and SCR controls, they also appear to be approximately 25% more energy efficient, on average. The CO2 emission rates of the newer trucks are lower than those of the older trucks. The CO and HC emission rates appear to decrease with model year. The NOx emission rates are approximately similar for the four older trucks at 16 to 19 g/mile. When comparing trucks with and without SCR, the observed reduction in NO is 86%. The estimated reduction in NOx, after correction for the NO2/NOx ratio for trucks with and without DPF is 81%. The PM emission rates for trucks with DPFs are 95% lower compared to those without.
SCR operation and DPF operation are known to be sensitive to exhaust gas conditions, which in turn will depend on vehicle activity (Yun and Kim, Citation2013; Reul-Chen et al., Citation2005). NOx and PM emission rates were compared for trucks without and with SCR and DPF for each of the U, H, TC, and L/TS activities. Comparing trucks with SCR to those without, the percent reduction in NOx emission rate is 78% for U and about 94% for H, TC, and L/TS. Comparing trucks with DPF to those without, the percent reduction in PM emission rate is about 95% for each of the four activity modes. Thus, while there is evidence that SCR performance may be somewhat compromised during U activities, when exhaust temperatures are lower compared to highway driving, the DPF appears to perform uniformly over all activities.
The max/min ratio for fuel economy and emission rates of CO2, NOx, and PM are 1.4, 1.4, 11, and 45, respectively. These are higher than the ratios for intercycle variability based on and are similar to the ratios for real-world modal rates and cycles based on . Thus, the variability observed in the real world is mostly from the intertruck differences. If the two newer trucks are omitted, the max/min ratios are lower and are similar to those observed for the intercycle comparisons. Thus, the intertruck variability indicated in and is mostly a result of substantial differences in fuel use and emission rates of the newer trucks compared to older trucks.
Contribution of can weight and trash weight to total weight
The RORTs in this study collected four types of cans: open-top, closed-top, receiver box, and self-contained compactor. Open-top cans are simple rectangular boxes, open to the sky, with typical weight between 5,000 to 6,000 lb. Closed-top cans are similar to open-top cans, except they have a top cover and thus are heavier, with average weights near 6,500 lb. They are mainly used for recyclables. Receiver box cans are fully enclosed, used in conjunction with a compactor on the ground, and weigh 6,500 to 7,000 lb. Self-contained compactor cans are fully enclosed, have an in-built compaction unit that is operated from a ground power supply, and weigh 9,000 to 10,000 lb.
The observed weight ranges were 840 lb to 26,160 lb for trash; 4,860 lb to 10,440 lb for cans; 27,540 lb to 30,440 lb for No Can; 32,880 lb to 40,860 lb for Empty Can; and 37,420 lb to 63,600 lb for Loaded Can. The trash weight to can weight ratio ranges from 0.09 to 3.74. Thus, it is not uncommon for a truck to collect a heavy can with little trash in it or a light can with heavy trash in it. The weight of loaded cans was 23 to 109% of the chassis weight, with an average of 55%.
On average, trucks spent 13%, 30%, and 26% of Overall Cycle time in No Can, Empty Can, and Loaded Can cycles, respectively. The average time spent in Collect/Drop and Tipping cycles is 25% and 5%, respectively. The average speed for each of the No Can, Empty Can, and Loaded Can cycles is about 20 mph. Truck 2338 did not have a No Can cycle because it started from the truck yard with an empty can that replaced the first can that was collected, which in turn was emptied and replaced the second can that was collected, and so on. Since RORTs spend over 50% of Daily Activity Cycle time hauling the weight of a can or can with trash, the effect of weight on fuel use and emission rates is assessed.
Effect of weight on fuel use and emissions rates
The fuel use and emission rates for the truck activities and weight states are estimated for each truck. The average and range of fuel use rate among the six trucks were 1.0 (0.8 to 1.1) g/s for Collect/Drop; 0.9 (0.8 to 1.5) g/s for Tipping; 3.0 (2.7 to 4.0) g/s for No Can; 3.8 (3.0 to 4.5) g/s for Empty Can; and 4.1 (2.8 to 5.5) g/s for Loaded Can. Thus, as expected, the fuel use rate increases with increasing weight, and is lowest for activities related to can maneuvering. The average fuel economy is 5.9 mpg for No Can, 4.8 mpg for Empty Can, and 4.7 mpg for Loaded Can. Thus, compared to No Can, the additional weight of an empty can reduces fuel economy by 19% and there is a further, but smaller, reduction in fuel economy when the can is loaded. The nonlinear adverse effect of weight on fuel use is consistent with a previous study on tractor-trailers (ORNL, Citation2011).
The CO2 emission rates, averaged over six trucks, for No Can, Empty Can, and Loaded can are 10.4 g/s, 11.7 g/s, and 12.9 g/s, which increase with weight similar to fuel use rate. The exhaust concentrations for HC and CO were generally below detection limit and thus trends for these pollutants were not assessed. Among the three weight states, NOx emission rates for trucks without SCR are 81 g/s, 92 g/s, and 102 g/s, while the rates for trucks with SCR are 12 g/s, 10 g/s, and 14 g/s. The apparent reduction in NOx emissions rate for the trucks with SCR, between No Can and Empty Can cases, could be due to various unobserved factors such as difference in NO2/NOx ratio, exhaust temperature, and engine power curve operation zone. PM emissions rates for trucks without DPF are 1.29 g/s, 1.42 g/s, and 1.50 g/s, while the rates for trucks with DPF are 0.06 g/s, 0.06 g/s, and 0.08 g/s, respectively for No Can, Empty Can, and Loaded Can cycles. Thus, trucks with SCR emissions control for NOx and DPF for PM have no or weak trend of increase in emission rates because of increase in weight.
For 64% to 88% of the OpMode bins, over six trucks, an increase in weight results in an increase in OpMode average fuel use and emissions rates. shows the relative difference in the OpMode rates for fuel use and emissions of NOx and PM, based on the average of six trucks, for Loaded Can versus No Can (L/N), Empty Can versus No Can (E/N), and Loaded Can versus No Can (L/E) weight states. The purpose of these comparisons is to identify trends in the effect of can and trash weight on OpMode emission rates. As expected, the largest differences are for the L/N comparison, for which fuel use rates are as much as 30 to 60% higher for OpModes associated with moderate power demand at each speed range. As expected, weight has no significant effect on fuel use during idling (Mode 1). Furthermore, weight has little effect on fuel use for low power demand (e.g., Mode 11, 21). For Mode 21, the difference is negative but represents a small absolute difference for a low rate. The effect of weight on fuel use is less pronounced for the E/N comparison, as expected, given the lower overall vehicle weight with an empty compared to loaded can. Having a can on the truck appears to be a more significant factor in fuel use than the amount of trash contained within the can. For example, as compared to an empty can, a loaded can increases fuel use rate by less than 20% for moderate power demand at low and moderate speeds, whereas having an empty can on the truck increases fuel use by as much as 40% for the same engine load and speed in comparison to having no can.
Figure 3. Percent difference in weight-state-based operating mode modal average (a) fuel use rate, (b) NOx emission rate, and (c) PM emission rate for the weight comparison cases Loaded Can versus No Can, Empty Can versus No Can, and Loaded Can versus Empty Can averaged over six roll-off refuse trucks.
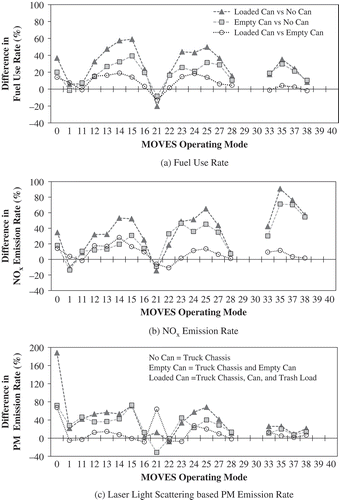
The trends in NOx emission rates with respect to OpModes and weight states are qualitatively similar to those for fuel use, with two exceptions. One is that the L/N comparison becomes more pronounced as speed increases, with maximum differences in emission rates from approximately 60% at low speed to more than 80% at high speed. The other is that at low speed, the can weight and trash weight appear to have comparable effects on emission rate, each leading to approximately 20% increases for some OpModes. The effect of trash weight is less pronounced at higher speed ranges.
PM OpMode emission rates are more sensitive to weight at low speed and relatively insensitive to weight at high speed, with differences of approximately 10% or less for the latter. Can weight is a more significant factor than trash weight for low speeds. The large differences in emission rates for braking are associated with low OpMode average rates and therefore do not indicate large absolute differences in rates.
The trends shown in are qualitatively the same for the four older trucks if the two trucks with SCR and DPF are excluded. The relative variation in the NOx and PM emission rates, for trucks with SCR and DPF, are more sensitive to weight at the highest speed range and low speed range, respectively. For these trucks, the absolute magnitude of the NOx and PM emission rates are generally low and the absolute differences in emission rates with respect to differences in weight are also small.
Although weight is a factor that affects fuel use and emission rates, for simplicity there may be interest in using one set of OpMode rates that are averaged over the various weight states during a typical Overall Cycle. Therefore, the potential errors from using such average OpMode rates are evaluated. shows, for each truck, the error in estimating cycle average rates for fuel use, NOx emissions, and PM emissions from using Overall OpMode average rates instead of the No Can, Empty Can, and Loaded Can OpMode average rates, for their respective cycles. If Overall OpMode average rates are used to predict fuel use for a No Can case, the fuel use is overestimated by approximately 10 to 20%. Use of the Overall OpMode average rates leads to errors within ±5% when applied to situations for an empty can. Although Truck 2338 did not collect any of the heaviest types of cans, it collected the highest average trash weight. Thus, its Overall OpMode average rates are substantially higher than the Empty Can rates. As expected, the Overall OpMode average rates will tend to underpredict the actual fuel use for the Loaded Can case, by as much as 10%. The use of Overall OpMode average rates is shown to lead to only small errors in fuel use for 11 of 12 truck and cycle combinations related to Empty Can and Loaded Can. Thus, considering that No Can represents typically a small proportion of time, the use of Overall OpMode average rates appears to be sufficient for fuel use.
Figure 4. Percent error in cycle average rates of (a) fuel use, (b) NOx emissions, and (c) PM emissions if Overall OpMode modal average rates are used instead of the No Can, Empty Can, and Loaded Can OpMode average rates, for respective weight-based cycles of individual trucks. Truck 2338 did not have a No Can cycle, and thus an Overall vs. No Can comparison is unavailable. No Can = truck chassis; Empty Can = truck chassis and empty can; Loaded Can = truck chassis, can, and trash load.
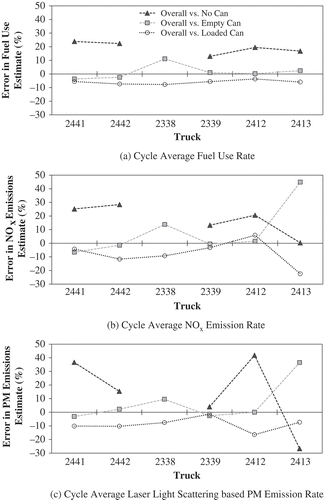
The results are more variable for NOx and PM emission rates. For NOx emission rates, the error is typically largest when comparing Overall versus No Can OpMode rates for the No Can cycle, and is within ±20% for most cases when comparisons are made for Empty Can and Loaded Can cases. An exception is Truck 2413, which has SCR and DPF and therefore low NOx and PM emission rates, for which there were large relative but small absolute differences in emission rates. For PM, aside from the No Can comparison, the errors from using Overall OpMode average rates are typically within ±10% except for the two low-emitting trucks, for which the relative differences are larger but the absolute differences are smaller.
Comparison to MOVES2010b
The measured (empirical) and MOVES2010b estimated cycle average comparisons for CO2, NOx, PM, and CO emission rates are shown in . For the empirical data, estimates are shown based on Overall Cycle OpMode emission rates for each truck weighted by the proportion of time spent in each of the six observed Daily Activity Cycles, for a total sample size of 36. The MOVES2010b estimates are based on the refuse truck vehicle category for the same age and ambient conditions as the measured truck. Empirical and MOVES2010b estimates of CO2 cycle averages are in one cluster with overall average values of 10 g/s and 9 g/s, respectively. The low coefficient of determination (R2) for this comparison is an artifact of a relatively small range of variability of these estimates for both data sources. Overall, the comparison indicates that if an actual duty cycle is input to MOVES2010b, MOVES2010b will provide an estimate that is about 8% lower, on average, than observed in the field.
Figure 5. Benchmark comparison of Daily Activity Cycle average fuel use and emission rates predicted using the project-level feature of MOVES2010b versus observed Daily Activity Cycle average rates. Each data point represents one truck and one Daily Activity Cycle. For each truck, estimates are made for each of the six observed Daily Activity Cycles. Thus, the total sample size is 36 (6 trucks, 6 Daily Activity Cycles).
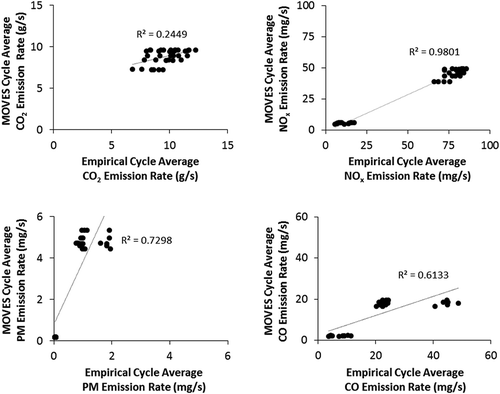
The NOx estimates are in two clusters, one cluster for the vehicles that meet the pre-2010 NOx emissions standard and do not have SCR and the other cluster for vehicles that achieve the more stringent 2010 and beyond NOx emissions standard and have SCR. The MOVES2010b estimates tend to be 43% lower than the empirically-based NOx emission rates. In another study of refuse trucks, MOVES2010b predicted NOx emissions for the NYGT cycle were found to be 22% lower than chassis dynamometer measurements on the same cycle (Maimoun et al., Citation2013).
The PM comparison has three clusters, with the two clusters further away from the origin for vehicles that meet the pre-2007 PM emissions standard and do not have DPF and the cluster near the origin for vehicles that have DPF. For both PM and CO, there are two clusters for vehicles without DPF because Truck 2441 had substantially higher PM and CO emissions compared to other older trucks. MOVES2010b tends to predict 300% higher PM emission rates than observed in the field study. However, the field study laser light scattering based PM emission rates are useful for the purpose of making relative comparisons within the measured data, whereas MOVES2010b PM emission rates are based on other detection methods that are generally considered to be more accurate. Nonetheless, the magnitudes of the two sets of rates are similar.
The CO comparison also has three clusters that are related to vehicles with and without DPF. The lowest CO emission rate cluster, is for vehicles with DPF. DPFs have an upstream oxidation catalyst, or the filter is coated with an oxidation catalyst, that helps reduce CO emissions. The correlation between empirical and MOVES2010b estimates for CO2, NOx, PM, and CO are 0.49, 0.99, 0.85, and 0.78, respectively. Thus, overall, real-world measured values and MOVES2010b estimates have similar relative trends.
The ratios of the maximum to minimum cycle average rates over 36 cycles for each of empirical and MOVES2010b estimates are 1.8 and 1.3 for CO2, respectively. Similarly, the ratios for NOx are 15 and 11, for PM are 56 and 35, and for CO are 13 and 11, respectively. Thus, there is more variability in empirical data than MOVES2010b estimates. This is expected since MOVES2010b is intended to represent fleet averages, and two trucks of the same model year can have different emission rates in the real world while they have identical emission rates in MOVES.
Overall, the relative trends in empirical estimates of cycle average emissions are in good agreement with the MOVES2010b predicted values. However, there are significant differences in magnitude of empirical and MOVES2010b predicted cycle average emission rates. Compared to NOx and PM emission rates, MOVES2010b-predicted CO2 emission rates are closer to real-world estimates. However, MOVES2010b does not capture, nor is it expected to, the intervehicle variability in real-world data.
Conclusion
In-use activity, fuel use, and CO2, NOx, PM, CO, and HC emissions are measured for six diesel RORTs. The measured RORTs typically spend about 50% of their time idling and more than 25% of their time at speeds of 25 mph or higher, have an average fuel economy of 4.4 mpg, and typically travel over 150 miles a day. Thus, RORTs have almost twice the fuel economy of previously reported values for residential trash collection refuse trucks. Compared to residential trash collection RTs, the contribution of TC to total fuel use and emissions is smaller for RORTs. On average, more than 55% of total measured NOx and PM emissions from the trucks is in urban areas. For speeds at or above 25 mph, how aggressively a driver accelerates the vehicle is a greater contributor, compared to the speed, to increase in fuel use and emission rates for increasing engine power demand.
The real-world variability in cycle average fuel use and emissions is mostly due to differences between older and newer model year RORTs that are more energy efficient and have substantially lower emissions. The two trucks in this study with SCR and DPF achieved more than 80% reduction in NOx emissions and about 95% reduction in PM emissions. The analysis of old versus new model year trucks can be used to evaluate the effect of fleet turnover. The OpMode-based definition of cycles made it possible to compare fuel use and emission rates estimates for real-world cycles measured in this study with residential refuse collection cycles previously reported in the literature. Comparing cycle average emission rates of CBD, NYGT, and WHM cycles with the average of the rates for the six observed cycles, for an average truck, the WHM cycle leads to cycle average rates that are closest to those of the real-world cycles. Nonetheless, use of the WHM cycle instead of a real-world cycle leads to 10% higher rates for CO2 and NOx and 28% higher rates for PM. Thus, the use of a real-world cycle would lead to more accurate estimates of emission rates.
On average, the trucks hauled weights that are more than 50% of the chassis weight and during a few duty cycles hauled weights that are similar to the chassis weight. Fuel economy and emissions are adversely affected by carrying higher weights. The marginal effect of weight on fuel use is higher for additional can weight compared to additional weight of trash.
Compared to real-world estimates, MOVES2010b predicted RORT cycle average fuel use and CO2 emissions were similar and cycle average criteria pollutant emission rates had similar trends but with differences in magnitudes ranging from 43% lower to 300% higher. MOVES2010b does not have a dedicated RORT cycle and MOVES2010b emission factors for refuse trucks are not based on real-world measurements of refuse trucks. Based on information currently available regarding MOVES2014, these limitations have not been addressed. MOVES2014 results for refuse trucks may be quantitatively different than the MOVES2010b results reported here, but the main insights from the comparison are not likely to differ substantially. For example, newer trucks with DPF and SCR are expected to have much lower PM and NOx emission rates than older trucks. The empirical data here can be compared with MOVES2014 and future versions of MOVES. Results from this study can be used to develop correction factors to adjust for under- or overestimation, compared to real-world measurements, of cycle average emission rates estimated by either version of MOVES. Further, results from this study can be used to include a RORT specific cycle and improved emission factors in a future version of MOVES.
There is growing interest in conversion of the refuse truck fleet from diesel to compressed natural gas. Therefore, as part of future work, we plan to complete a similar study that is focused on CNG refuse trucks. Chassis dynamometer drive cycles could be developed based on the second-by-second data collected in this study. Furthermore, development of methods for comparing engine dynamometer certification measurements with real-world in-use chassis-based measurements would be an interesting area of further research.
ORCID
Gurdas S. Sandhu

H. Christopher Frey

Funding
This work is sponsored by the Environmental Research and Education Foundation.
Supplemental information
Supplemental data for this article can be accessed at http://dx.doi.org/10.1080/10962247.2014.990587.
Supplemental Material.docx
Download MS Word (1.2 MB)Acknowledgments
Waste Industries provided refuse trucks for measurement at their Garner, NC, facility, with extensive support from management staff (Ben Habets and Larry Kestner), technical staff (Brett Briscoe, James Fraim, and Mike Gray), and drivers (Charlie Brewington, Ernest Henderson, Mark Herbert, Michael Jackson, Jimmie Marks, and Shawn Sawfford).
Additional information
Funding
Notes on contributors
Gurdas S. Sandhu
Gurdas S. Sandhu is a Ph.D. candidate and H. Christopher Frey is a Distinguished University Professor in the Department of Civil, Construction, and Environmental Engineering at North Carolina State University at Raleigh, NC.
H. Christopher Frey
Shannon Bartelt-Hunt and Elizabeth Jones are associate professors in the Department of Civil Engineering at University of Nebraska–Lincoln, Omaha, NE.
Related Research Data
References
- Agar, B.J., B.W. Baetz, and B.G. Wilson. 2007. Fuel consumption, emissions estimation, and emissions cost estimates using global positioning data. J. Air Waste Manage. Assoc. 57(3):348–54. doi:10.1080/10473289.2007.10465328
- Battelle. 2003. Environmental technology verification report: Clean Air Technologies International, Inc. REMOTE on-Board Emissions Monitor. Prepared by Battelle, Columbus, OH, for the U.S. Environmental Protection Agency, Ann Arbor, MI.
- Block, M., N. Clark, S. Wayne, R. Nine, and W. Miller. 2005. An investigation into the emissions reduction performance of an SCR system over two years’ in-use heavy-duty vehicle operation. SAE Tech. Paper 2005-01-1861. doi:10.4271/2005-01-1861
- Brodrick, C.-J., E. A. Laca, A. F. Burke, M. Farshchi, L. Li, and M. Deaton. 2004. Effect of vehicle operation, weight, and accessory use on emissions from a modern heavy-duty diesel truck. Transport. Res. Rec. J. Transport. Res. Board 1880:119–25. doi:10.3141/1880-14
- California Air Resources Board. 1998. Identification of particulate emissions from diesel-fueled engines as a toxic air contaminant. California Air Resources Board. http://www.arb.ca.gov/regact/diesltac/diesltac.htm
- Cannon, J.S. 2006. Greening garbage trucks: Trends in alternative fuel use, 2002–2005. New York, NY: INFORM, Inc. http://www.informinc.org/reportpdfs/st/GGTUPDATEFINAL.pdf
- Clark, N. N., J. M. Kern, C. M. Atkinson, and R. D. Nine. 2002. Factors affecting heavy-duty diesel vehicle emissions. J. Air Waste Manage. Assoc. 52(1):84–94. doi:10.1080/10473289.2002.10470755
- Clark, N. N., B. L. Rapp, M. Gautam, W. Wang, and D. W. Lyons. 1998. A long term field emissions study of natural gas fueled refuse haulers in New York City. SAE Tech. Paper 982456. doi:10.4271/982456
- Clean Air Technologies International, Inc. 2008. OEM-2100AX Axion System user’s manual, Version 2.0. Buffalo, NY: Clean Air Technologies International, Inc.
- Dallmann, T.R., S.J. DeMartini, T.W. Kirchstetter, S.C. Herndon, T.B. Onasch, E.C. Wood, and R.A. Harley. 2012. On-road measurement of gas and particle phase pollutant emission factors for individual heavy-duty diesel trucks. Environ. Sci. Technol. 46(15):8511–18. doi:10.1021/es301936c
- DieselNet. 2000. Emission test cycles: Central business district (CBD). http://www.dieselnet.com/standards/cycles/cbd.php (accessed November 14, 2014).
- Farzaneh, M., J. Zietsman, and D.-W. Lee. 2009. Evaluation of in-use emissions from refuse trucks. Transport. Res. Rec. J. Transport. Res. Board 2123:38–45. doi:10.3141/2123-05
- Frey, H.C., and K. Kim. 2006. Comparison of real-world fuel use and emissions for dump trucks fueled with B20 biodiesel versus petroleum diesel. Transport. Res. Rec. J. Transport. Res. Board 1987:110–17. doi:10.3141/1987-12
- Frey, H.C., and K. Kim. 2009. In-use measurement of the activity, fuel use, and emissions of eight cement mixer trucks operated on each of petroleum diesel and soy-based B20 biodiesel. Transport. Res. Part D 14(8): 585–592. doi:10.1016/j.trd.2009.08.004
- Gajendran, P., and N.N. Clark. 2003. Effect of truck operating weight on heavy-duty diesel emissions. Environ. Sci. Technol. 37(18):4309–17. doi:10.1021/es026299y
- Gautam, M., D. Ferguson, W.G. Wang, R. Bata, D. Lyons, N. Clark, G.M. Palmer, and S. Katragadda. 1992. In-Use emissions and performance monitoring of heavy duty vehicles using a transportable transient chassis test facility. SAE Tech. Paper 921751. doi:10.4271/921751
- Herner, J.D., S. Hu, W.H. Robertson, T. Huai, J.F. Collins, H. Dwyer, and A. Ayala. 2009. Effect of advanced aftertreatment for PM and NOx control on heavy-duty diesel truck emissions. Environ. Sci. Technol. 43(15):5928–33. doi:10.1021/es9008294
- Ivanič, Ž. 2007. Data collection and development of New York City refuse truck duty cycle. SAE Tech. Paper 2007-01-4118. doi:10.4271/2007-01-4118
- Jamriska, M., L. Morawska, S. Thomas, and C. He. 2004. Diesel bus emissions measured in a tunnel study. Environ. Sci. Technol. 38(24):6701–9. doi:10.1021/es030662z
- Jiménez-Palacios, J. L. 1999. Understanding and quantifying motor vehicle emissions with vehicle specific power and TILDAS remote sensing. Thesis. Boston, MA: Massachusetts Institute of Technology. http://dspace.mit.edu/handle/1721.1/44505
- Khalek, I. A., T. L. Bougher, P. M. Merritt, and B. Zielinska. 2011. Regulated and unregulated emissions from highway heavy-duty diesel engines complying with U.S. Environmental Protection Agency 2007 emissions standards. J. Air Waste Manage. Assoc. 61(4):427–42. doi:10.3155/1047-3289.61.4.427
- Kittelson, D.B., W.F. Watts, J.P. Johnson, C. Rowntree, M. Payne, S. Goodier, C. Warrens, et al. 2006. On-road evaluation of two diesel exhaust aftertreatment devices. J. Aerosol Sci. 37(9):1140–51. doi:10.1016/j.jaerosci.2005.11.003
- Lee, D.-W., J. Zietsman, M. Farzaneh, and J. Johnson. 2011. Characterization of on-road emissions of compressed natural gas and diesel refuse trucks. Transport. Res. Rec. J. Transport. Res. Board 2233:80–89. doi:10.3141/2233-10
- Maimoun, M.A., D.R. Reinhart, F.T. Gammoh, and P. McCauley Bush. 2013. Emissions from US waste collection vehicles. Waste Manag. 33(5): 1079–89. doi:10.1016/j.wasman.2012.12.021
- Merrill, L. 2000. Your ticket to the rolloff roundup. MSW Manage. 10(2). http://www.mswmanagement.com/MSW/articles/4453.aspx
- National Toxicology Program. 2014. 13th Report on carcinogens. Prepared by the National Toxicology Program for the U.S. Department of Health and Human Services, October 2, 2014. http://ntp.niehs.nih.gov/pubhealth/roc/roc13/index.html (accessed January 2, 2015).
- NGVAmerica. 2014. For fleets > refuse. https://www.ngvamerica.org/vehicles/for-fleets/refuse/ (accessed November 14, 2014).
- Oak Ridge National Laboratory. 2011. Effect of weight and roadway grade on the fuel economy of class-8 freight trucks. ORNL/TM-2011/471. Oak Ridge, TN: Prepared by Oak Ridge National Laboratory for U.S. Department of Energy. http://cta.ornl.gov/cta/Publications/Reports/ORNL_TM_2011_471.pdf.
- Ramamurthy, R., and N.N. Clark. 1999. Atmospheric emissions inventory data for heavy-duty vehicles. Environ. Sci. Technol. 33(1):55–62. doi:10.1021/es980692f
- Reul-Chen, C.K., C. Ross, N.L.C. Steele, and A.M. Winer. 2005. Exhaust temperature profiles for application of passive diesel particulate filters to solid waste collection vehicles in California. J. Air Waste Manage. Assoc. 55(2):241–47. doi:10.1080/10473289.2005.10464615
- Sandhu, G.S., and H.C. Frey. 2012. Real-world measurement and evaluation of duty cycles, fuels, and emission control technologies of heavy-duty trucks. Transport. Res. Rec. J. Transport. Res. Board 2270:180–87. doi:10.3141/2270-21
- Sandhu, G.S., and H.C. Frey. 2013. Effects of errors on vehicle emission rates from portable emissions measurement systems. Transport. Res. Rec. J. Transport. Res. Board 2340:10–19. doi:10.3141/2340-02
- Sandhu, G.S., H.C. Frey, S. Bartelt-Hunt, and E. Jones. 2014. In-use measurement of the activity, fuel use, and emissions of front-loader refuse trucks. Atmos. Environ. 92:557–65. doi:10.1016/j.atmosenv.2014.04.036
- Singer, B.C., R.A. Harley, D. Littlejohn, J. Ho, and T. Vo. 1998. Scaling of infrared remote sensor hydrocarbon measurements for motor vehicle emission inventory calculations. Environ. Sci. Technol. 32(21):3241–48. doi:10.1021/es980392y
- Strimer, C.M., N.N. Clark, D. Carder, M. Gautam, and G. Thompson. 2005. Impact of vehicle weight on truck behavior and emissions, using on-board measurement. SAE Tech. Paper 2005-01-3788. doi:10.4271/2005-01-3788
- Tang, S.D., L. Graham, L. Shen, X.L. Zhou, and T. Lanni. 2004. Simultaneous determination of carbonyls and NO2 in exhausts of heavy-duty diesel trucks and transit buses by HPLC Following 2,4-dinitrophenylhydrazine cartridge collection. Environ. Sci. Technol. 38(22):5968–76. doi:10.1021/es0353356
- Thiruvengadam, A., D.K. Carder, M. Krishnamurthy, and M. Gautam. 2010. Comparison of regulated and unregulated exhaust emissions from a fleet of multi-fuel solid resource collection vehicles. Proceedings of the ASME 2010 Internal Combustion Engine Division Fall Technical Conference, September 12–15, 139–147. San Antonio, TX: American Society of Mechanical Engineers. doi:10.1115/ICEF2010-35053
- U.S. Department of Transportation. 2010. Transportation’s role in reducing U.S. greenhouse gas emissions, volume 1: Synthesis report. Report to Congress. U.S. Department of Transportation. http://ntl.bts.gov/lib/32000/32700/32779/DOT_Climate_Change_Report_-_April_2010_-_Volume_1_and_2.pdf
- U.S. Environmental Protection Agency. 2008. Integrated science assessment for oxides of nitrogen—Health criteria. EPA/600/R-08/071. Research Triangle Park, NC: U.S. Environmental Protection Agency, National Center for Environmental Assessment–RTP Division. http://ofmpub.epa.gov/eims/eimscomm.getfile?p_download_id=475020.
- U.S. Environmental Protection Agency. 2009a. Draft Motor Vehicle Emission Simulator (MOVES) 2009 - Software design and reference manual. EPA-420-B-09-007. Ann Arbor, MI: U.S. Environmental Protection Agency, Office of Transportation and Air Quality. http://www.epa.gov/otaq/models/moves/420b09007.pdf.
- U.S. Environmental Protection Agency. 2009b. Integrated science assessment for particulate matter. EPA/600/R-08/139F. Research Triangle Park, NC: U.S. Environmental Protection Agency, National Center for Environmental Assessment–RTP Division. http://www.epa.gov/ncea/pdfs/partmatt/Dec2009/PM_ISA_full.pdf.
- U.S. Environmental Protection Agency. 2010. MOVES2010 highway vehicle: Population and activity data. Final report. EPA-420-R-10-026. Ann Arbor, MI: U.S. Environmental Protection Agency, Office of Transportation and Air Quality. http://www.epa.gov/otaq/models/moves/420r10026.pdf
- U.S. Environmental Protection Agency. 2012a. Motor Vehicle Emission Simulator (MOVES)—User guide for MOVES2010b. Final report. EPA-420-B-12-001b. Ann Arbor, MI: U.S. Environmental Protection Agency, Office of Transportation and Air Quality. http://www.epa.gov/otaq/models/moves/documents/420b12001b.pdf
- U.S. Environmental Protection Agency. 2012b. Development of emission rates for heavy-duty vehicles in the Motor Vehicle Emissions Simulator MOVES2010. Final report. EPA-420-B-12-049. Ann Arbor, MI: U.S. Environmental Protection Agency, Office of Transportation and Air Quality. http://www.epa.gov/otaq/models/moves/documents/420b12049.pdf
- U.S. Environmental Protection Agency. 2013a. Heavy-duty highway compression-ignition engines and urban buses—Exhaust emission standards. http://www.epa.gov/otaq/standards/heavy-duty/hdci-exhaust.htm (accessed November 14, 2014).
- U.S. Environmental Protection Agency. 2013b. National Clean Diesel Campaign: Technologies—Diesel retrofit devices. http://www.epa.gov/cleandiesel/technologies/retrofits.htm (accessed November 14, 2014).
- U.S. Environmental Protection Agency. 2013c. 2008 National Emissions Inventory: Review, analysis and highlights. EPA-454/R-13-005. Research Triangle Park, NC: U.S. Environmental Protection Agency, Office of Air Quality Planning and Standards. http://www.epa.gov/ttnchie1/net/2008report.pdf.
- U.S. Environmental Protection Agency. 2014a. Municipal solid waste generation, recycling, and disposal in the United States: Facts and figures for 2012. EPA-530-F-14-001. Washington, DC: U.S. Environmental Protection Agency, Office of Solid Waste. http://www.epa.gov/osw/nonhaz/municipal/pubs/2012_msw_fs.pdf.
- U.S. Environmental Protection Agency. 2014b. Official release of the MOVES2014 Motor Vehicle Emissions Model for SIPs and transportation conformity. Fed. Reg. 79(194):60343–47.
- U.S. Environmental Protection Agency. 2014c. MOVES (Motor Vehicle Emission Simulator). http://www.epa.gov/otaq/models/moves (accessed November 14, 2014).
- U.S. Government Printing Office. 2014. Code of Federal Regulations, Title 40: Protection of environment, Part 1065—Engine-testing procedures. http://www.ecfr.gov/cgi-bin/text-idx?SID=00972928cbc4a946e5d324033e3c6977&node=pt40.33.1065&rgn=div5 (accessed January 2, 2015)
- Vojtisek-Lom, M., and J.E. Allsop. 2001. Development of heavy-duty diesel portable, on-board mass exhaust emissions monitoring system with NOx, CO2 and qualitative PM capabilities. SAE Tech. Paper 2001-01-3641. doi:10.4271/2001-01-3641
- Vojtisek-Lom, M., and J.T. Cobb. 1998. On-Road light-duty vehicle emissions measurements using a novel inexpensive on-board portable system. Proceedings of the 8th CRC On-Road Vehicle Emissions Workshop, San Diego, CA, April 20–22, 1998.
- Walkowicz, K., K. Proc, S. Wayne, R. Nine, K. Campbell, and G. Wiedemeier. 2003. Chassis dynamometer emission measurements from refuse trucks using Dual-FuelTM natural gas engines. SAE Tech. Paper 2003-01-3366. doi:10.4271/2003-01-3366
- Washington State Department of Labor & Industries. 2004. Demonstration project: Solid waste management and recycling. Washington State Department of Labor & Industries. http://www.lni.wa.gov/safety/SprainsStrains/demofnl/solidwasterecycling.pdf
- World Health Organization–IARC. 2012. IARC: Diesel engine exhaust carcinogenic. World Health Organization. http://www.iarc.fr/en/media-centre/pr/2012/pdfs/pr213_E.pdf
- Yun, B.K., and M. Kim. 2013. Modeling the selective catalytic reduction of NOx by ammonia over a vanadia-based catalyst from heavy duty diesel exhaust gases. Appl. Therm. Eng. 50(1):152–58. doi:10.1016/j.applthermaleng.2012.05.039