
Abstract
To assess accountability and effectiveness of air regulatory policies, we reviewed more than 20 years of monitoring data, emissions estimates, and regulatory policies across several southern California communities participating in a long-term study of children’s health. Between 1994 and 2011, air quality improved for NO2 and PM2.5 in virtually all the monitored communities. Average NO2 declined 28% to 53%, and PM2.5 decreased 13% to 54%. Year-to-year PM2.5 variability at lower pollution sites was large compared to changes in long-term trends. PM10 and O3 decreases were largest in communities that were initially among the most polluted. Trends in annual average NO2, PM2.5, and PM10 concentrations in higher pollution communities were generally consistent with NOx, ROG, SOx, PM2.5, and PM10 emissions decreases. Reductions observed at one of the higher PM2.5 sites, Mira Loma, were generally within the range expected from reductions observed in ROG, NOx, SOx, and PM2.5 emissions. Despite a 38% increase in regional motor vehicle activity, vigorous economic growth, and a 30% population increase, total estimated emissions of NOx, ROG, SOx, PM2.5, and PM10 decreased by 54%, 65%, 40%, 21%, and 15%, respectively, during the 20-year time period. Emission control strategies in California have achieved dramatic reductions in ambient NO2, O3, PM2.5, and PM10. However, additional reductions will still be needed to achieve current health-based clean air standards.
Implications: For many cities facing the challenge of reducing air pollution to meet health-based standards, the emission control policies and pollution reduction programs adopted in southern California should serve as an example of the potential success of aggressive, comprehensive, and integrated approaches. Policies targeting on-road mobile emissions were the single most important element for observed improvements in the Los Angeles region. However, overall program success was the result of a much broader approach designed to achieve emission reductions across all major pollutants and emissions categories.
Introduction
Since the 1940s, air pollution has been a visible presence in southern California skies and an ongoing issue for many metropolitan areas. Evidence linking assorted negative health outcomes with elevated concentrations of ozone (O3), nitrogen dioxide (NO2), carbon monoxide (CO), sulfur dioxide (SO2), and particulate matter (PM) has led to tightening of state and national ambient air quality standards (NAAQS; http://www.epa.gov/air/criteria.html). As required under the Federal Clean Air Act amendments of 1977, state implementation plans (SIPs) have been developed and updated to identify emission control strategies needed to achieve NAAQS compliance. In regions with severe air pollution, increasingly stringent and broad emission control regulations and programs have been implemented to enable progress toward increasingly tighter NAAQS. California SIPs have included emission control programs covering virtually all controllable sources, including on-road mobile, stationary, off-road mobile, and area-wide sources.
Significant air quality improvements have occurred in southern California during the last 20 years (SCAQMD, Citation2013). This period also overlaps with the southern California Children’s Health Study (CHS) (Peters et al., Citation1999; Gauderman et al., Citation2004; McConnell et al., Citation2003; Gilliland et al., Citation2001; Avol et al., Citation2001; Kuenzli et al., Citation2003), a long-term study of the respiratory and cardiovascular health development of several successive cohorts of California public school children. Recent analyses of these cohorts have revealed improvements in respiratory symptoms and lung function in more recent years, similar to observed trends in air quality (Berhane et al., submitted; Gauderman et al., Citationin press). As part of a broader effort to understand observed changes in health status of the CHS participants, we reviewed historical air quality, emissions estimates, and air quality management regulatory programs to identify major emission control policies affecting NOx, reactive organic gases (ROG), SOx, and primary PM emissions. For this evaluation, we focused on pollutants showing the strongest chronic effects in the CHS health analyses and regulatory policies promulgated prior to and during the 1992 to 2011 time frame.
Methods and Study Design
Air quality
Ambient O3, NO2, PM10, and PM2.5 were systematically measured at centrally sited community air monitoring stations in most CHS communities beginning in 1993 (gases) and 1994 (PM) (see map). ROG and SO2 were not measured routinely across the community network. Ozone and NO2 were monitored hourly using ultraviolet photometers and chemiluminescent monitors, in conformance with Federal Reference Methods (FRM). PM data were collected using a variety of samplers and instruments, as shown in . These approaches included integrated daily PM2.5 and PM10 FRM samplers, specially designed CHS PM2.5 integrated 2-week samplers (TWS), PM10 tapered element oscillating microbalances (TEOM, R&P model 1400A), and PM2.5 and PM10 beta-attenuation mass monitors (BAM, MetOne model 1020). To minimize potential biases caused by changing PM instrumentation, non-FRM PM were periodically compared to collocated FRM data at numerous locations. All TWS, TEOM, and BAM PM data were adjusted to reflect a common FRM-equivalency using regression relationships derived from the comparisons. Original TWS and TEOM PM data were adjusted upward primarily to account for volatilization losses, and BAM PM were adjusted downward primarily to account for excess aerosol water collection. Daily, monthly, and annual average concentrations were computed from quality-assured and algorithmically corrected data using a data acceptance criterion of at least 75% completeness. Concentrations for all hours of the day were averaged except for ozone, where we focused on the 10 a.m.–6 p.m. average, which in the CHS communities is highly correlated (r > 0.98) with the NAAQS 8-hr daily maximum ozone concentrations. Annual averages were computed from monthly average data. To facilitate computation of annual averages, missing monthly average data were imputed using the averaged concentration at the site during the same month in the prior sampling year and subsequent sampling year. This approach minimized biases that might otherwise have occurred in averages computed without the cleanest or most polluted months of the year. Overall, the CHS ambient data are >95% complete for the expected sampling schedules and missingness is not an issue in interpreting trends. Additional details regarding CHS air quality measurements have been previously described (Peters et al., Citation1999).
Table 1. PM monitors and samplers used in the CHS
Figure 1. Map of CHS communities.
Emissions
Our emissions evaluation approach was consistent with tracking procedures used at the California Air Resources Board (CARB) and the South Coast Air Quality Management District (SCAQMD), two key agencies responsible for air emission regulations and programs affecting southern California communities. Planning and emissions inventory staff of both agencies were interviewed to provide guidance and context for the emissions review.
Emissions inventory trends data were acquired from the CARB California Emissions Projection Analysis Model (CEPAM November 2012 Version) and CARB California on-road mobile source emissions model EMFAC2011 (Version 1.0). The CEPAM model and database contain “back-casted” emissions for criteria air pollutants from 2008 to 1988 and forecasted emissions from 2009 to 2020. CEPAM uses emissions data from the CARB 2009 Air Quality Almanac, which in turn includes 2008 emissions data and estimates (CARB 2009). We chose to use the 2009 version because it also included pre-2000 emission estimates, which more current versions omit. However, on-road mobile source emissions in the 2009 Almanac were estimated from the EMFAC2007 (Version 2.3) model. Following recommendations from CARB staff, we updated the CEPAM on-road mobile emission estimates with ones derived from the newer EMFAC2011 model for the relevant study areas of interest. Differences between EMFAC2007 and EMFAC2011 emission estimates for the South Coast Air Basin (SoCAB, the airshed surrounding Los Angeles, CA) varied by year and pollutant, and generally were larger for particles than gases. Emissions from paved road dust were included as on-road mobile emissions in our tabulation. Though our focus was primarily on NOx and PM emissions changes, we included ROG and SOx emissions to help account for their contributions to secondary photochemical processes, including O3, organic aerosol, and sulfate aerosol formation.
While our main focus for emission trends was in the SoCAB, the CHS also involves communities outside the SoCAB region. To assess these geographically distant locations (Alpine in San Diego County; Atascadero in San Luis Obispo County; Santa Maria, Lompoc, and Santa Barbara in Santa Barbara County), we retrieved and evaluated the CEPAM and EMFAC2011 emission estimates for these areas as well as the SoCAB region.
Government emissions inventories are based on engineering models and representative data for all sources, except for the largest stationary sources that have continuous emissions monitoring data. Models, methods, and data have improved over time, but these inventories are still mostly informed estimates rather than objective data. NOx emissions are often deemed the most accurate portion of the inventory (Ban Weiss et al., 2008). For this reason, we examined studies that independently evaluated the on-road mobile portion of the NOx inventory using data from tunnel studies and roadside remote sensing, and evaluated the overall NOx inventory using remote-sensing (satellite) data (see Discussion section).
Emission control policies
Regulatory policy information was obtained through meetings with relevant agency staff and reviews of the historical regulatory database. Agency meetings provided an overview description of key pollution control programs that affected on-road mobile, off-road mobile, stationary, and area source emissions during the time period of study interest. During meetings with SCAQMD and CARB staff, specific suggestions for identifying the most important policies were also provided.
The regulatory assessment approach was necessarily qualitative, because these agencies do not typically quantify the effects of individual control policies, and policies are often modified during implementation. Both regulatory agencies’ staffs expressed the view that cumulative effects of pollution control regulations would best be reflected in the annualized emissions inventories. Independent published evaluations were also used to corroborate aspects of certain emissions inventories.
Results
Air pollution trends
Annual average ambient pollutant concentrations across CHS communities are shown in . Year-to-year variability was evident for all pollutants and most locations. Air quality improvements in outdoor NO2 and PM2.5 were observed in virtually all CHS communities. Annual average NO2 reductions ranged from 53% (41 to 19 ppb) in Upland, the highest NO2-reporting community, to 28% (10 to 7 ppb) in Santa Maria, one of the lowest NO2-reporting communities. Changes in annual average PM2.5 were slightly broader, from 54% (33 to 15 µg/m3) in Mira Loma, to 13% (9 to 8 µg/m3) in Santa Maria. Year-to-year variability in PM2.5 at lower-pollution sites (e.g., Santa Maria) was large, in a relative sense, compared to changes in long-term concentration trends. Smaller improvements in daytime 8-hr (10 a.m. to 6 p.m.) ozone and PM10 were evident in those CHS communities that were initially the most highly polluted. For example, from 1994 to 2011 the annual average 10 a.m. to 6 p.m. ozone decreased 27% (76.4 to 55.7 ppb) in Lake Arrowhead and 12% (64.3 to 56.7 ppb) in Riverside, the two highest CHS ozone communities. PM10 decreased 37% (67.4 to 42.2 µg/m3) in Mira Loma and 24% (42.4 to 32.4 µg/m3) in Riverside during the same period. PM10 and O3 concentrations in communities with moderate to lower outdoor levels were generally variable and lacked consistent trends over the 1994–2011 time period.
Figure 2. Air quality trends (1992–2011) in the CHS communities.
Emissions trends results
Estimated 1993 and 2012 emissions, emission reductions, and emission trends in the SoCAB are shown in and . On-road mobile sources were the dominant source of NOx, ROG, PM2.5, and PM10 emissions in southern California in 1993. On-road mobile NOx accounted for 883 of the 1425 tons per day (62%) of total NOx emissions, and on-road mobile PM10 contributed 202 of the 344 tons per day (59%) of total PM10 emissions across the LA Basin. After on-road mobile sources, emission categories (in decreasing level of emissions) included “other” mobile sources of NOx, stationary sources of ROG and SOx, and area-wide sources of PM2.5 and PM10. Estimates for 2012 show a dramatic reduction in total emissions of NOx, ROG, PM2.5, and PM10. On-road mobile sources remained an important contributor to total NOx, ROG, PM2.5, and PM10 emissions in 2012; however, their relative contribution decreased substantially (e.g., from 62% to 50% of total NOx emissions).
Table 2. Estimated emissions and emission reductions in the SoCAB (1993 to 2012)
Figure 3. Estimated NOx, ROG, PM2.5, PM10, and SOx emissions in the SoCAB from 1992 to 2012.
The 1993-to-2012 time frame was a period of strong economic growth in California, with statewide gross domestic product (GDP) growing at 2.7% per year, or a total of 66%, in constant dollars, over the two-decade period (California Department of Finance, Citation2014). Despite vigorous economic growth, a 30% increase in population, and a 38% increase in motor vehicle activity in the SoCAB, total estimated emissions of NOx, ROG, SOx, PM2.5, and PM10 decreased by 54%, 65%, 40%, 21%, and 15%, respectively, during the time period. The largest reductions were seen in the on-road motor vehicle emissions category, especially among NOx and ROG motor vehicle emissions. Large percentage reductions were also reported for stationary source NOx (64%) and ROG (69%) emissions. The estimates suggest that almost all categories of pollutant emissions were reduced during this period, with only area-wide and other mobile sources of SOx emissions, area-wide PM2.5 emissions, and stationary source PM10 emission estimates increasing by small amounts (less than 7 tons per day). The inventory data indicate the annual compounded rate of change of emissions during this 19-year period was –5.1% NOx, –8.1% ROG, –11.9% SOx, –2.6% PM2.5, and –1.5% PM10 per year from on-road mobile sources and –4.0% NOx, –5.4% ROG, –2.6% SOx, –1.2% PM2.5, and –0.85% PM10 per year, from all sources of emissions combined.
Our study area included six communities outside the SoCAB region. The southernmost CHS community, Alpine, is in San Diego County (240 km from Los Angeles), while the northernmost community, Atascadero (340 km), is in San Luis Obispo County. Lancaster (~115 km) is located in the high-desert region of northern Los Angeles County and Lompoc (245 km), Santa Maria (260 km), and Santa Barbara (160 km) are all in Santa Barbara County, northwest of Los Angeles. We retrieved the CEPAM and EMFAC2011 emission estimates for these areas and found that the reported emission changes for San Diego County were the same, on a percentage basis, as those for the SoCAB (54% NOx and 21% PM2.5 reductions from 1993 to 2012). Emissions were typically an order of magnitude lower in the CHS communities north of Los Angeles, compared to those in the SoCAB. summarizes the 1993 emissions and 1993–2012 emission changes for Santa Barbara County, which were typical of the more northern study areas. Population and vehicle miles traveled (VMT) increased 51% during this time period. Countywide total emissions of NOx, SOx, PM2.5, and PM10 all increased, but ROG emissions decreased, despite reductions in all on-road motor vehicle emissions (–57% NOx and –13% PM2.5). The emissions increase was primarily due to the growth in the “other-mobile-source” emissions category, a large proportion of which were emissions from oceangoing vessels traveling the ocean transit lanes to call on the ports of Los Angeles and Long Beach. At these ports, combined NOx and PM2.5 emissions increased ~160% during this time frame.
Table 3. Estimated emissions and emission reductions in Santa Barbara County (1993 to 2012)
Comparison of CHS air quality and emissions trends
Ambient concentration trends in high-pollution communities were generally consistent with emission trends. This is perhaps most convincing for NO2, where both ambient levels and NOx emissions declined by ~54%. Trends in annual average ambient concentrations across the CHS were stronger for NO2 and PM2.5 than for PM10 and O3. CHS communities with the highest NO2 and PM2.5 concentrations in the mid-1990s exhibited the strongest downward trends over the two-decade period. For example, air quality trends in two high-NO2 concentration communities (Upland and Long Beach) and two high-PM2.5 concentration communities (Mira Loma and Riverside) are compared to trends in SoCAB emissions in .
Figure 4. Comparison of NO2 air quality and NOx emission trends, and PM2.5 air quality and PM2.5, PM10, NOx, and ROG emission trends. The normalized trends (right side) compare air quality and emissions to the baseline values (100%) in 1993 for NO2 and 1994 for PM2.5.
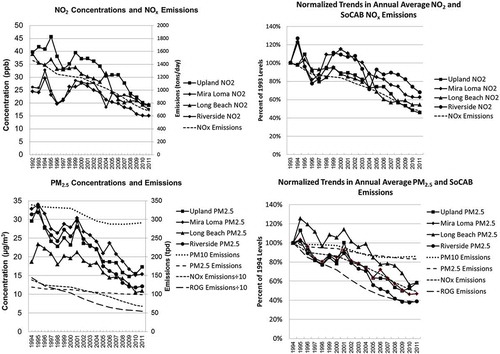
On average, annual NO2 concentrations at Upland and Long Beach decreased 3.0% per year, slightly greater than the 2.8% annual decrease estimated for NOx emissions in the SoCAB for 1993–2011. NO2 concentrations in sites farther inland (Mira Loma and Riverside) decreased at slower rates (1.6 to 2.4% per year) than estimated NOx emissions. These four communities represent the western (Long Beach), central (Upland), and eastern (Riverside and Mira Loma) portions of the SoCAB region, bracket the NOx emissions trend, and showed consistent long-term trends in NO2 air quality and NOx emissions. In Santa Barbara County where the NOx emission barely changed (+0.6% per year) over this time period, the NO2 concentrations do not show consistent long-term trends (see Lompoc, Santa Maria, and Santa Barbara in ).
Data from these same four SoCAB stations revealed higher rates of PM2.5 concentration decreases than primary PM2.5 emissions decreases over the 1994–2011 time period. Basin-wide PM2.5 emissions decreased an average of 1% per year, but observed PM2.5 concentrations decreased 3.9%, 3.4%, 3.2%, and 3.0% per year in Riverside, Long Beach, Mira Loma, and Upland, respectively. A large portion of ambient PM2.5 in the SoCAB is secondary PM, as a result of gaseous NOx, ROG, and SOx emissions (Fine, Citation2004). The average rate of annual decrease in ambient PM2.5 concentrations was mostly between the average annual rate of change of NOx emissions (2.9%) and ROG emissions (3.7%). The PM2.5 air quality trends compared more favorably with NOx and ROG emissions trends than either PM2.5 or PM10 emissions trends over this time period.
Reconciliation of O3 ambient concentration trends with emissions inventories was more challenging, due to ozone’s secondary photochemical nature. Observed changes in annual ozone levels in Lake Arrowhead, for example, were about half that expected, given the roughly 60% reductions in both ROG and NOx precursor emissions. However, if one subtracts current background ozone levels (~30 to 40 ppb; Wang et al., Citation2009; Fiore et al., Citation2014), changes in observed ozone at peak stations were more consistent with emission trends. The apparent absence of ozone trends in communities with moderate and lower ambient levels is inconsistent with changes in local precursor emissions and may be related to the effects of transported pollution, including increasing background ozone in this period, or to nonlinearities in atmospheric chemistry that control interrelationships between ROG, NOx, and O3.
Regulatory policies
Numerous regulatory policies and emissions reduction strategies were developed to address California’s air quality during this twenty-year period. A summary of the key policies appears as . The multitude of on-road vehicle emissions mitigation efforts, including the Low Emission Vehicle (LEV I and II) program, which drastically reduced passenger car, light-duty and medium-duty truck emission standards and required gasoline reformulations starting in the early 1990s, and the heavy-duty diesel vehicle emission standard reductions and fuel reformulation programs in the 2000s, seem to have been especially important in this period.
Table 4. Major regulatory policies affecting pollution and emission trends in California, 1985–2012
Regulatory policies that influenced emission reductions in the 1993–2012 period originated with the Federal Clean Air Act of 1970 (1970 CAA) and subsequent CAA Amendments in 1977 and 1990.
California mandated emission reductions from motor vehicles and stationary sources in the 1970s and 1980s in accordance with the CAA. The focus was on light-duty vehicle emissions and large stationary sources. While excellent progress was made in the 1980s on reducing emission from large stationary sources, such as power plants and oil refineries in the SoCAB, overall progress toward achieving the compliance with the NAAQS was slow. It was clear that the SoCAB was not going to achieve NAAQS compliance by 1987 as required in the 1977 CAA amendments.
Several policy actions during 1988–1990 greatly accelerated progress on the SoCAB air pollution problem. The California Clean Air Act of 1988 directed the CARB “to achieve the maximum degree of emission reduction possible from vehicular and other mobile sources,” which led to the California Low Emissions Vehicle (LEV) program adopted in 1991. Also in 1988, the SCAQMD adopted an air quality management plan (the SIP for SoCAB) that incorporated aggressive emission control strategies where essentially all sources, regardless of size (including, e.g., consumer products), would be targeted for reductions. It required introduction of zero-emission vehicles (provision subsequently modified) and large (>80%) reductions in emissions to be achieved mostly with new “to-be-developed” technologies. Concurrently, the SCAQMD established the Technology Advancement Program (TAP) to expedite the development, demonstration, and commercialization of cleaner technologies and clean-burning fuels.
Another major policy action was SCAQMD adoption of the Regional Clean Air Incentives Markets (RECLAIM) Program in the early 1990s (http://www.aqmd.gov/reclaim/reclaim.html). It was designed to reduce NOx and SOx emissions from major industrial facilities by ~70% between 1994 and 2003. The RECLAIM program used a market-based approach where businesses that beat their reduction targets could trade/sell their credits on the open market, while business that did not reduce emissions were required to acquire credits in the marketplace to continue operation. The market-based approach offered greater flexibility and a financial incentive to reduce air pollution beyond what clean air laws and traditional command-and-control rules require and still guaranteed annual reductions in air pollution until air quality standards were achieved.
CARB identification of diesel particulate matter (DPM) as a toxic air contaminant (TAC) in 1998 led to the adoption of a diesel risk reduction plan (http://www.arb.ca.gov/diesel/documents/rrpFinal.pdf) in 2000. It recommended control measures to achieve a goal of 75% PM reduction by 2010 and 85% by 2020. The landmark plan led to (1) new regulatory standards for all new on-road, off-road, and stationary diesel-fueled engines and vehicles to reduce diesel PM emissions by about 90% overall from 2000 levels; (2) new retrofit requirements for existing on-road, off-road, and stationary diesel-fueled engines and vehicles that were determined to be technically feasible and cost-effective; and (3) new Phase 2 diesel fuel regulations to reduce the sulfur content levels of diesel fuel to no more than 15 ppm to provide the quality of diesel fuel needed by the advanced diesel PM emission controls.
Adoption of the San Pedro Bay Ports Clean Air Action Plan (CAAP) in 2006 (http://www.polb.com/environment/air/caap.asp) provided yet another strategy for dramatically reducing air pollution emissions from port-related cargo movement in the ports of Long Beach and Los Angeles. It established plans to rapidly reduce emissions from heavy-duty trucks servicing the ports, as well as from oceangoing vessels, cargo handling equipment, harbor craft, and rail/locomotives.
These major policy actions by the CARB, SCAQMD, and the ports during this period went beyond the requirements of the Federal CAA and accelerated progress to clean air goals. However, the agencies and legislators decided that they needed new programs to fund or co-fund emission reductions above and beyond those required by prevailing laws in order to accelerate implementation of new policies and technology. Between 1988 and 2006, the agencies adopted a broad array of programs to develop the technology and fund or co-fund the replacement of on-road, off-road, and stationary sources with clean modern vehicles and equipment. As a result, more than $1 billion was committed to accelerate emission reductions in the SoCAB through the SCAQMD TAP, the Carl Moyer Memorial Air Quality Standards Attainment Program (http://www.arb.ca.gov/msprog/moyer/moyer.htm), the Lower Emission School Bus Program (http://www.arb.ca.gov/msprog/schoolbus/schoolbus.htm), the Goods Movement Emission Reduction Program (http://www.arb.ca.gov/bonds/gmbond/gmbond.htm), the Air Quality Improvement Program (http://www.arb.ca.gov/msprog/aqip/aqip.htm), the Fleet Modernization Program (http://www.arb.ca.gov/msprog/aqip/efmp/efmp.htm), and the Surplus Off-Road Opt-In for NOx Program (http://www.aqmd.gov/home/programs/business/business-detail?title=off-road-diesel-engines&parent=vehicle-engine-upgrades).
Discussion
The linkages between air pollution control policies, emissions, and air quality are conceptually simple but often difficult to quantify in real-world situations. The complexity stems from the large number of policies developed, the variability in timing and speed of roll-out for some policies’ activation and application, and the lack of direct continuous measurements of most emission sources. Emission control programs and regulations affect many different types of sources and are implemented over time with various degrees of stringency, compliance, and effectiveness. Regulatory requirements can have rigid and well-defined timelines or may be phased in gradually over time. Rules are sometimes modified based on in-use experiences and technological developments. With hundreds of different regulations influencing the time course of on-road mobile, off-road mobile, stationary, and area-wide sources in any year, it is impossible to track the effectiveness of any individual control measure. Furthermore, the effects of controls are not likely to be uniform in space or time for anything other than the most widespread sources (e.g., light-duty vehicles). Atmospheric chemistry and changing background concentrations may also cause nonlinearities in relationships between precursor emissions such NOx and ROG, and ambient concentrations of secondary pollutants like ozone, NO2, and secondary PM. Hence, the regulatory assessment approach for this study was necessarily qualitative and highly aggregated.
The finding that PM2.5 air quality trends compared more favorably with NOx (and ROG) emission trends than either PM2.5 or PM10 emission trends is supported by aerosol composition data. shows trends in annual average PM2.5 nitrate concentrations at CHS stations during 1994–2004 and nearest U.S. Environmental Protection Agency (EPA) Speciation Trends Network (STN) stations during 2001–2011. Although the paired sites are not collocated, they are aligned in the east–west direction of predominant wind flow and show similar concentration in years with concurrent measurements. The Mira Loma and Riverside–Rubidoux sites (10 km apart) are historically the two highest nitrate sites in the SoCAB, and from 1994–1995 to 2010–2011, annual PM2.5 nitrate concentration decreased by 65%. From 1994–1995 to 2010, annual PM2.5 nitrate concentrations decreased by 68%, and 59% at Upland/Fontana (13 km apart) and Long Beach/Anaheim (23 km apart), respectfully. The changes in ambient nitrate at these sites are slightly greater than the NOx emission changes (–54%) and much greater than the primary PM2.5 emission changes (–21%) in the SoCAB. They suggest that the NOx emissions reductions made a substantial contribution to reductions in ambient PM2.5 in the areas with high concentrations. The nitrate concentrations in Santa Maria during 1994–2004 show low concentrations and no temporal trend from 1994 to 2004, which is consistent with small NOx emissions change (+12%) in Santa Barbara County. Unfortunately, it is not possible to assess comparable trends in PM2.5 EC/OC at these station pairs because of changes in EC/OC measurement techniques over this time period.
Figure 5. PM2.5 nitrate air quality trends at CHS and STN monitoring sites.
Our analyses suggest that dramatic improvements in ambient air quality occurred over the 1993 to 2012 time frame in the Southern California region. These changes are explainable through documentation of similar decreases in CARB and independent emission inventories over the same period. Emissions reductions were the result of a multidecade effort of aggressive air pollution reduction strategies undertaken by the State of California and the regional air quality agencies to address a wide variety of sources. The large changes in on-road emissions suggest that policies to reduce light- and medium-duty gasoline and diesel vehicle emissions were especially effective in helping to achieve reductions in emissions and improve air quality in this period.
Because NOx emission estimates are verifiable with independent estimation techniques and are considered more accurate than estimates for other pollutants, trends in NO2 levels and NOx emissions are robust evidence of policy effectiveness. On-road motor vehicle and large stationary source emissions are well studied and more certain than other components of the emissions inventory. CARB has made substantial changes in the methods and data used to estimate other-mobile-source emissions in recent years. The new approach affects virtually all off-road mobile sources, including aircraft, trains, oceangoing vessels, commercial harbor craft, recreational boats, off-road recreational vehicles, off-road equipment, farm equipment, fuel storage and handling equipment, and cargo handling equipment. Emissions estimates based on the new methodology are available starting 2009, but they have not been backcast to prior years. These estimates are not currently part of the CEPAM projections. Thus, trends in the other-mobile-source category of emissions may be less certain than those for other categories.
Emissions inventories are inherently uncertain, because much of the fundamental data are estimated from sparse measurements of actual activities and emission factors. Numerous researchers have employed alternate approaches to evaluate emission inventory amounts and trends (Harley et al., Citation2005; Ban-Weiss et al., Citation2008; Bishop and Stedman, Citation2008; Bishop et al., Citation2010, Citation2012; Dallman and Harley, Citation2010; McDonald et al., Citation2012, Citation2013; Russell et al., Citation2010, Citation2012; Warneke et al., Citation2012; Pollack et al., Citation2013). Most of these approaches focus on on-road mobile source emissions, where emissions can be independently estimated from fuel-use data and fuel-use-based vehicle-emission factors determined from tunnel measurements and/or remote sensing of tailpipe emissions. Mobile emissions are often combined with other emissions to facilitate comparison with ambient air pollutant levels derived from surface observations and satellites.
McDonald et al. (Citation2012) recently evaluated long-term trends in NOx emissions for 1990 to 2010 in the SoCAB, which overlaps most of the period and area of our study. They compiled fuel-use data and fuel-use-based vehicle emission factors from a large number of roadside remote-sensing and tunnel studies. They found in-use LDV NOx emission rates decreased steadily and dramatically during this period, declining from 14 to 4 g/kg fuel (or 71%). HDV emission rates were constant for 1990–1997 and then decreased from 42 to 28 g/kg fuel (33%). Their estimates of on-road LDV NOx emissions in the SoCAB decreased by 65% between 1990 and 2010, whereas HDV NOx emissions initially increased, plateaued, and then decreased (starting in 2006), resulting in little change over this period. In the early 1990s, gasoline engines were the dominant source (~75%) of on-road NOx emissions. However, because LD vehicle emission factors declined much faster than those for HD diesel vehicles, the LD gasoline and HD diesel on-road NOx emissions were comparable by 2007. Overall, McDonald et al. (Citation2012) estimates of on-road vehicle NOx emissions decreased 53% from 1990 to 2010 and 49% from 1993 to 2010, slightly less than the 63% value derived from the CARB inventory for 1993–2012 (in ).
McDonald et al. (Citation2012) also compared trends in total anthropogenic NOx emissions with trends in ambient NOx concentrations. Their comparison indicated that (1) on-road vehicle NOx emissions were the dominant portion (~70 to 80%) of total anthropogenic NOx emissions throughout this period, and (2) trends in total anthropogenic NOx emissions were consistent with trends in ambient concentrations.
Russell et al. (Citation2010, Citation2012) compared OMI satellite NO2 to CARB NOx emissions inventories and ambient surface NO2 concentrations throughout California. From 2005 to 2011, satellite NO2 showed greater percentage pollution reductions (40.3%, or 6.7% per year) than surface ambient concentrations or emission inventories in the SoCAB. The satellite NO2 data showed large weekday–weekend differences, which were interpreted as corroboration of the dominance of motor vehicle emissions in the overall inventory. The OMI satellite NO2 reductions were somewhat larger than McDonald et al. (Citation2012) found in emissions during this period.
The magnitude of the SoCAB emission reductions achieved should rightly be considered a substantial achievement of public policy. In the face of population and VMT growth, emissions in the Los Angeles area during this time frame would likely have increased, and air quality would have suffered, were it not for the broad range of aggressive air pollution control policies put into place. The breadth of reductions across all major pollutants and categories of emissions suggests that the policies put into place have been comprehensive and successful. The observation that PM2.5 air quality trends over this time period compared more favorably with NOx and ROG emission trends than with either PM2.5 or PM10 emission trends may have implications for other geographical areas.
Despite the substantial accomplishments in emissions reduction and air quality improvement to date, the Los Angeles region remains in violation of the PM2.5 and O3 NAAQS. Additional emissions reductions will be needed in order to achieve regulatory compliance. Most informed predictions suggest it will be at least several more years until air quality standards are fully achieved in the Los Angeles region (SCAQMD Citation2012 AQMP). In the interim, millions of people continue to breathe unhealthy air in an area where the word “smog” has become a common household term.
Funding
This project was performed under a contract with the Health Effects Institute (4910-RFA11-1/12-4), with additional support from a National Institute of Environmental Health Sciences (NIEHS) Center Grant (5 P30 ES07048-19) and NIEHS program project (5P01ES011627-10).
Acknowledgment
The authors thank the respective staff of both the CARB and the SCAQMD for their support in documenting the policies, emissions, and activities reported herein, especially Todd Sax and Cynthia Marvin of CARB, and Elaine Chang and Laki Tisopulos of SCAQMD. The authors have considered their activities and report no conflicts of interest.
Additional information
Funding
Notes on contributors
Fred Lurmann
Fred Lurmann is manager of Exposure Assessment Studies at Sonoma Technology, Incorporated, Petaluma, CA.
Ed Avol
Ed Avol is a professor of clinical medicine and Frank Gilliland is a professor of medicine and director of the the Environmental Health Division of the Department of Preventive Medicine at the University of Southern California, Los Angeles, CA.
Related Research Data
References
- Avol, E.L., W.J. Gauderman, S.M. Tan, S. London, and J.M. Peters. 2001. Respiratory effects of relocating to areas of differing air pollution levels. Am. J. Respir. Crit. Care Med. 164:2067–72.
- Ban-Weiss, G.A., J.P. McLaughlin, and R.A. Harley. 2008. Carbonyl and nitrogen dioxide emissions from gasoline- and diesel-powered motor vehicles. Environ. Sci. Technol. 42:3944–50. doi:10.1021/es8002487
- Ban-Weiss, G.A., J.P. McLaughlin, R.A. Harley, M.M. Lunden, T.W.Kirchstetter, A.J. Kean, A.W. Strawa, E.D. Stevenson, and G.R. Kendall. 2008. Long-term changes in emissions of nitrogen oxides and particulate matter from on-road gasoline and diesel vehicles. Atmos. Environ. 42: 220–32. doi:10.1016/j.atmosenv.2007.09.049
- Berhane, K., C.C. Chang, R. McConnell, W.J. Gauderman, E. Avol, E. Rappaport, R. Urman, F. Lurmann, and F. Gilliland. In press. The effect of improvements in air quality on trends of bronchitic symptoms in children. J. Am. Med. Assoc. Submitted.
- Bishop, G.A., A.M. Peddle, D.H. Stedman, and T. Zhan. 2010. On-road emission measurements of reactive nitrogen compounds from three California cities. Environ. Sci. Technol. 44:3616–20. doi:10.1021/es903722p
- Bishop, G.A., B.G. Schuchmann, D.H. Stedman, and D.R. Lawson. 2012. Multispecies remote sensing measurements of vehicle emissions on Sherman Way in Van Nuys, California. J. Air Waste Manage. Assoc. 62:1127–33. doi:10.1080/10962247.2012.699015
- Bishop, G.A., and D.H. Stedman. 2008. A decade of on-road emissions measurements. Environ. Sci. Technol. 42:1651–56. doi:10.1021/es702413b
- California Air Resources Board. 2013. EMFAC2011 Technical documentation. http://www.arb.ca.gov/msei/emfac2011-documentation-final.pdf (accessed October 17, 2014).
- California Department of Finance. 2014. www.dof.ca.gov/html/fs_data/stat-abs/documents/D1_000.xls (accessed January 15, 2015).
- Dallmann, T.R., and R.A. Harley. 2010. Evaluation of mobile source emission trends in the United States. J. Geophys. Res. Atmos. 115:D14305. doi:10.1029/2010jd013862
- Fine, P.M., S. Shen, and C. Sioutas. 2004. Inferring the sources of fine and ultrafine particulate matter at downwind receptor sites in the Los Angeles basin using multiple continuous measurements. Aerosol Sci. Technol. 38:182–95. doi:10.1080/02786820390229499
- Fiore, A.M., J.T. Oberman, M.Y. Lin, L. Zhang, O.E. Clifton, D.J. Jacob, V. Naik, L.W. Horowitz, J.P. Pinto, and G.P. Milly. 2014. Estimating North American background ozone in U.S. surface air with two independent global models: Variability, uncertainties, and recommendations. Atmos. Environ. 96:284–300. doi:10.1016/j.atmosenv.2014.07.045
- Gauderman, W.J., E. Avol, F. Gilliland, H. Vora, D. Thomas, K. Berhane, R. McConnell, N. Kuenzli, F. Lurmann, E. Rappaport, H. Margolis, D. Bates, and J. Peters. 2004. The effect of air pollution on lung development from 10 to 18 years of age. N. Engl. J. Med. 351(11):1057–67. doi:10.1056/NEJMoa040610
- Gauderman, W.J., R Urman, E. Avol, K. Berhane, R. McConnell, E. Rappaport, C.C. Chang, F. Lurmann, and F. Gilliland. In press. The effects of improvements in air quality on children’s lung development. N. Engl. J. Med.
- Gilliland, F.D., K. Berhane, E.B. Rappaport, D.C. Thomas, E. Avol, J. Gauderman, S.J. London, H.G. Margolis, R. McConnell, K.T. Islam, and J.M. Peters. 2001. The effects of ambient air pollution on school absenteeism due to respiratory illnesses. Epidemiology 12:43–54. doi:10.1097/00001648-200101000-00009
- Harley, R.A., L.C. Marr, J.K. Lehner, and S.N. Giddings. 2005. Changes in motor vehicle emissions on diurnal to decadal time scales and effects on atmospheric composition. Environ. Sci. Technol. 39:5356–62. doi:10.1021/es048172+
- Kuenzli, N., R. McConnell, D. Bates, T. Bastain, A. Hricko, F. Lurmann, E. Avol, F. Gilliland, and J. Peters. 2003. Breathless in Los Angeles: The exhausting search for clean air. Am. J. Public Health 93:1494–99. doi:10.2105/AJPH.93.9.1494
- McConnell, R., K. Berhane, F. Gilliland, J. Molitor, D. Thomas, F. Lurmann, E. Avol, W.J. Gauderman, and J.M. Peters. 2003. Prospective study of air pollution and bronchitic symptoms in children with asthma. Am. J. Respir. Crit. Care Med. 168(7): 790–97. doi:10.1164/rccm.200304-466OC
- McDonald, B.C., T.R. Dallmann, E.W. Martin, and R.A. Harley. 2012. Long-term trends in nitrogen oxide emissions from motor vehicles at national, state, and air basin scales. J. Geophys. Res. 117:D00V18. doi:10.1029/2012JD018304
- McDonald, B.C., D.R. Gentner, A.H. Goldstein, and R.A. Harley. 2013. Long-term trends in motor vehicle emissions in U.S. urban areas. Environ. Sci. Technol. 47:10022–31. doi:10.1021/es401034z
- Peters, J.M., E. Avol, W. Navidi, S.J. London, W. J. Gauderman, F. Lurmann, W.S. Linn, H. Margolis, E. Rappaport, H. Gong, and D.C. Thomas. 1999. A study of twelve southern California communities with differing levels and types of air pollution I. Prevalence of respiratory morbidity. Am. J. Respir. Crit. Care Med. 159(3): 760–67. doi:10.1164/ajrccm.159.3.9804143
- Pollack, I.B., T.B. Ryerson, M. Trainer, J.A. Neuman, J M. Roberts, and D.D. Parrish. 2013. Trends in ozone, its precursors, and related secondary oxidation products in Los Angeles, California: A synthesis of measurements from 1960 to 2010. J. Geophys. Res. Atmos. 118:5893–911. doi:10.1002/jgrd.50472
- Russell, A.R., L.C. Valin, E.J. Buscela, M.O. Wenig, and R.C. Cohen. 2010. Space-based constraints on spatial and temporal patterns of NOx emissions in California, 2005–2008. Environ. Sci. Technol. 44:3608–15. doi:10.1021/es903451j
- Russell, A.R., L.C. Valin, and R.C. Cohen. 2012. Trends in OMI NO2 observations over the United States: Effects of emission control technology and the economic recession. Atmos. Chem. Phys. 12:12197–209. doi:10.5194/acp-12-12197-2012 (STI-5585).
- South Coast Air Quality Management District. 2013. Final 2012 air quality management plan, February 2013. http://www.aqmd.gov/home/library/clean-air-plans/air-quality-mgt-plan/final-2012-air-quality-management-plan (accessed August 21, 2014).
- Wang, H., D.J. Jacob, P. Le Segar, D.G. Streets, R.J. Park, A.B. Gilliland, and A. van Donkelaar. 2009. Surface ozone background in the United States: Canadian and Mexican pollution influences. Atmos. Environ. 43:1310–19. doi:10.1016/j.atmosenv.2008.11.036
- Warneke, C., J.A. de Gouw, J.S. Holloway, J. Peischl, T.B. Ryerson, E. Atlas, D. Blake, M. Trainer, and D.D. Parrish. 2012. Multiyear trends in volatile organic compounds in Los Angeles, California: Five decades of decreasing emissions, J. Geophys. Res. 117:D00V17. doi:10.1029/2012JD017899