
Abstract
Aerosol emissions from toy cars with electric motors were characterized. Particle emission rates from the toy cars, as high as 7.47 × 10⁷ particles/s, were measured. This emission rate is lower than other indoor sources such as smoking and cooking. The particles emitted from toy cars are generated from spark discharges inside the electric motors that power the toy cars. Size distribution measurements indicated that most particles were below 100 nm in diameter. Copper was the dominant inorganic species in these particles. By deploying aerosol mass spectrometers, high concentrations of particulate organic matter were also detected and characterized in detail. Several organic compounds were identified using a thermal desorption aerosol gas chromatography. The mass size distribution of particulate organic matter was bimodal. The formation mechanism of particulate organic matter from toy cars was elucidated.
Implications: A possible new source of indoor air pollution, particles from electric motors in toy cars, was identified. This study characterized aerosol emissions from toy cars in detail. Most of these particles have a diameter less than 100 nm. Copper and some organics are the major components of these particles. Conditions that minimize these emissions were determined.
Introduction
Indoor air contains many constituents, such as particulate matter, volatile organic compounds (VOCs), and ozone (O3), that are potentially harmful to human health (Seinfeld and Pandis, Citation2006). U.S. residents, on average, spend 88% of their day in buildings, and 7% in a vehicle (Robinson and Nelson, Citation1995). Many studies have shown that indoor air quality (IAQ) has a positive correlation with health indices, such as morbidity and mortality (Jones, Citation1999; Samet et al., Citation1987; Kreiss, Citation1989; Sundell, Citation2004). Particulate matter is a major air pollutant that may contain many hazardous constituents, such as heavy metals and polycyclic aromatic hydrocarbons (PAHs) (Seinfeld and Pandis, Citation2006).
In some indoor environments, mass concentrations of fine particulate matter (PM2.5) may exceed the outdoor levels (Wallace, Citation1996). Naumova et al. (Citation2002) and Weisel et al. (Citation2005) report lower levels indoors than outdoors of many inorganic species, such as sulfate, nitrate, and dust, but higher organic particulate mass concentrations. Some types of organic particulate mass can be hazardous to human health (Long et al., Citation2001). Many indoor sources of particle emissions have been identified, such as smoking and cooking (Jones, Citation1999). In addition, some sources, such as laser printers, have been found to be important in recent years (Niwa, Citation2004; He et al., Citation2007; Schripp et al., Citation2008).
Toy cars with electric motors have been widely manufactured for many years, and are primarily used by children, who may be much more susceptible than adults to health effects associated with exposure to hazardous compounds. It has been reported that toy cars may produce high concentrations of volatile organic compounds (Air Quality Sciences, Inc., Citation2012). Another study found that some toy cars emit considerable amounts of heavy metals, such as lead (Davidowski and Grosser, Citation2007). Toy cars use motors to provide motive power. A few studies have also reported that electric motors in vacuum cleaners generate submicrometer particles (Szymczak et al., Citation2007; Lioy et al., Citation1999). A main elemental component was reported to be copper, while lead and arsenic were also found to be present. Most of the fine particles are reported to be produced by electric sparks inside the motors, rather than by mechanical abrasion (Szymczak et al., Citation2007). Although motors used by vacuum cleaners (rated at about several hundred watts) are much larger than motors in toy cars (on the order of several watts), the basic operation principal is the same. To the best of our knowledge, no study has been carried out on examining particulate matter emission from toy car motors.
The physical characteristics of emissions of submicrometer particles from toy cars were investigated in this study. The chemical composition of these submicrometer particles was examined in detail using several advanced mass spectrometry techniques, and the formation mechanism of submicrometer particles emitted from toy cars was elucidated.
Experimental Section
Toy cars
Four different toy cars were used in these studies (Figure S1). All four cars are powered by miniature electric motors. Toy cars 1 and 2 have relatively higher speed motors (operating voltage: 3 V; motor speed: about 12,500 rpm), while toy cars 3 and 4 have lower speed motors (operating voltage: 4.5 V; motor speed: about 8,000 rpm). Toy car 1 was newly purchased for this study and toy cars 2, 3, and 4 were used prior to testing in this study.
Particle number concentration and size distribution measurements
The toy car and miniature electric motor was placed independently in a small (1 L) chamber (). A particle-free air flow was passed through the chamber and carried out emissions from the toy car/motor into an exhaust line, which was connected to a vent. The airflow rates used were 10 L/min (LPM) for toy car 1, 3, 4, and 20 LPM for toy car 2. A slip stream of the exhaust flow was introduced into a condensation particle counter (CPC, model 3025A or 3776, TSI, Inc., Shoreview, MN), to measure the total particle number concentrations. The CPC was operated in a low flow rate mode (0.3 LPM). A scanning mobility particle sizer (SMPS, a combination of TSI model 3080 electrostatic classifier and TSI model 3025A CPC) was used for size distribution measurements with a total sample flow rate of 0.3 LPM.
Figure 1. Schematic drawing of the experimental set-up to measure particle emission from a toy car.
Organic aerosol measurement by aerosol mass spectrometry and thermal desorption aerosol gas chromatography (GC)/mass spectroscopy (MS) with flame ionization detection (FID) (TAG)
A high-resolution time-of-flight aerosol mass spectrometer (HR-Tof-AMS, Aerodyne Research, Inc., Billerica, MA) was used to measure the organic mass spectra of particles emitted from toy cars. The detailed description of the HR-Tof-AMS can be found in the literature (Canagaratna et al., Citation2007; Jimenez et al., Citation2003; Jayne et al., Citation2000). Aerosols are introduced into the AMS through a critical flow nozzle, and then pass through an aerodynamic lens in order to focus particles in the centerline and form a particle beam. A chopper wheel creates packets of particles that are sent through a time-of-flight region for sizing. At the end of the sizing chamber, particles in the beam impact on a hot (600°C) metal collector. Nearly all organic constituents become vapors and are ionized by electron impact (energy of electron impact is set to 70 eV). Finally, the ions are analyzed by a high-resolution time-of-flight mass spectrometer (MS).
Thermal desorption aerosol gas chromatography (TAG) was used to measure many individual organic compounds (molecular level) in the aerosol. Particles are collected by humidification and inertial impaction on a collection substrate. The substrate is heated (300°C) and resulting organic vapors are carried to a chromatography column using a helium carrier gas. The gas chromatograph system separates compounds mostly based on compound vapor pressure (using Rxi-5sil nonpolar column, 30 m length × 0.25 mm ID × 0.25 um film). Finally, individual compounds were transferred to a mass spectrometer and their electron impact ionization mass spectra were obtained (Williams et al., Citation2006). Each mass spectrum was compared to the NIST Mass Spectral Library to determine its molecular information. A series of alkane standards was analyzed to provide a reference of retention time, which can help the identification of molecular information.
Elemental Analysis by inductively coupled plasma mass spectrometry (ICP-MS)
Particles emitted by toy car 1 were collected on a Teflon filter (47 mm, Pall Co., Ann Arbor, MI) for a total sampling time of approximately 10 hr, at a sampling flow rate of 10 LPM. Collected particles were digested at 100ºC in a tube with 10 mL concentrated HNO3 and 2.5 mL concentrated HCl. The solution was diluted 50 times and analyzed by ICP-MS (model 7500ce, Agilent Technologies, Santa Clara, CA) to determine the concentrations of 32 elements (Li, Be, Na, Mg, Al, P, K, Ca, Sc, V, Cr, Mn, Fe, Co, Ni, Cu, Zn, As, Se, Y, Mo, Ag, Cd, In, Sb, Ba, Tb, Tl, Pb, Bi, Th, and U).
Results and Discussion
Particle emission rates from toy cars
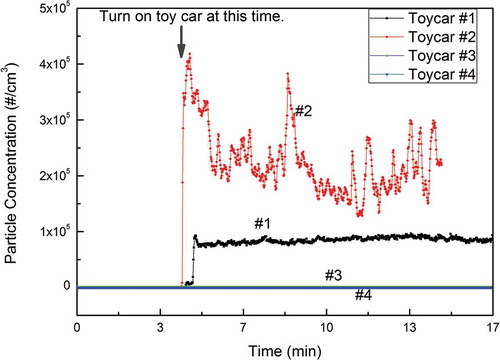
The toy cars were placed in a small chamber and a CPC was used to measure particle concentrations (). shows that high particle concentrations were detected after toy cars 1 and 2 were turned on. The particle number concentrations of emissions from toy cars 1 and 2 were around 8.0 × 10⁴ and 2.5 × 10⁵/cm3, suggesting large differences of particle emission rates among the cars. Notably, the particle emission for toy car 1 was much more stable than for toy car 2. It could be related to the car age and amount of prior use: Toy car 1 is much newer and was used less than toy car 2. In contrast, the CPC did not detect any noticeable particle emissions from toy cars 3 and 4. One reason could be that the power ratings of the motors in cars 3 and 4 were lower than those of cars 1 and 2. Another possible reason is that the electric motors of toy cars 3 and 4 are well sealed in a chamber and isolated (Figure S1).
Figure 2. Particle number concentration of emissions from four different toy cars.
The particle emission rate for a toy car in chamber was calculated using the following equation:
Table 1. Summary of particle emission rate measurements
Formation mechanism of particles generated from toy car
a shows the particle size distribution of toy car emissions. Reasonably large concentrations of ultrafine and fine (diameter < 500 nm) particles were observed. Toy car 1 was first operated in a new condition and its particle emission was measured by a SMPS. Toy car 1 was then continuously operated for 24 hr (toy car 1 was considered to be “used” after this initial testing period). The second curve in is for toy car 1 in this used condition. All three curves have only one detectable mode, which is located around 60 nm. Szymczak et al. (Citation2007) showed particle size distribution from emissions of an electric motor that was a part of a commercial vacuum cleaner. The observed size distribution has a steep decrease of number concentration with increase of size over the whole size range (9.82–414.2 nm), which is very different from our observations () in this study. They reported that most of the fine particle emission came from electric sparks generated in the electric motor. Their study is consistent with that of Bau et al. (Citation2010), who characterized particle emission from an electric spark generator with a Cu electrode. Bau et al. (Citation2010) found that the count median mobility diameters of particle emission were less than 10 nm under different operating conditions. The differences in the results suggest that the formation mechanism of particles in our study may include other processes, and this is investigated in this paper.
Figure 3. (a) Number size distribution of submicrometer particles generated from toy cars. (b) Number size distribution of submicrometer particles generated from electrical motor of toy cars at different voltages.
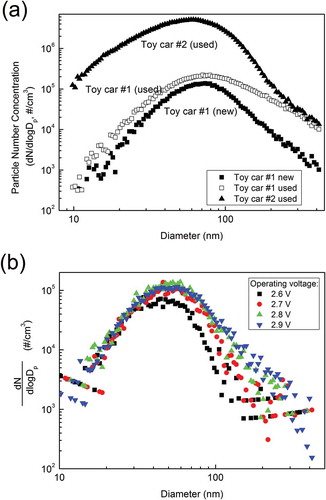
The differences among the three size distributions shown in are significant. Particle concentrations from toy car 2 were the highest across the entire size range. Particle concentration from toy car 1 in used condition was higher than in the new condition, especially at larger particle sizes, indicating used toy cars tend to produce higher aerosol emissions. This fact may relate to possible damage to the electric brushes inside the motor. Electric motors that most toy cars use (including toy cars in this study) are simple two-pole DC motors, which consist of an armature, two permanent magnets, and a pair of electric brushes. The electric current is applied to the armature via brushes. The connection between the brushes and armature is loose since the armature is always rotating. Therefore, the brushes are scratched when the motor is running. Scratched surfaces of the brushes produce electric sparks much more readily than smooth surfaces, due to the sharp points on scratched surfaces greatly enhancing the potential gradient. If the gradient exceeds a certain value, sparks will occur (Loeb, Citation1965). More sparks lead to more particle formation and emission.
From the preceding analysis, it is concluded that most of particle emissions come from the miniature electric motors inside these toy cars. To firmly prove this, the electric motor in toy car 1 was tested independently in the chamber. shows high concentrations of aerosol generated from the electric motor alone, which confirms the proposed mechanism. Different particle size distributions shown in correspond to different voltages applied to the motor. Generally, particle concentrations increase with increasing voltage (most notably for the larger particle sizes in this range), indicating that increase of voltage may lead to more electric sparks.
Chemical composition of particles emitted from the toy car
The chemical compositions of fine particles from electric sparks are determined by the electrode materials (Schwyn et al., Citation1988; Watters et al., Citation1989). Electric sparks can provide sufficient heat to locally melt and evaporate small amounts of material from the electrode surface (Schwyn et al., Citation1988; Horvath and Gangl, Citation2003). The vapor is released to air and undergoes gas-to-particle conversion (including nucleation and condensation) rapidly due to the lower temperature of air, thereby generating fine particles. Thus, chemical composition of these fine particles should be very similar to the electrode materials. An ICP-MS was used to measure the concentration of 32 elements in particle emissions of these toy cars. shows that four elements (Cu, Zn, Cr, and Th) were detected. The most abundant element was copper, the source of which was the copper brushes or copper wires in the motor. Zinc was also detected, and it is also a chemical component in the electric brush and copper wires. also shows some trace amounts of Cr and Th. However, it should be noted that the concentrations of Cr and Th were around the detection limit of the ICP-MS.
Figure 4. Fraction of metal mass for each element in particulate matter generated from the toy car 1.
It is also of interest to see whether particle emissions from toy cars contain organic components (presumably from lubricating constituents). A high-resolution aerosol mass spectrometer was used to characterize the organic components. a shows the average mass spectrum of organic species for particle emissions from toy car 1. Organic peaks were surprisingly high, which means a significant amount of particle emissions from the test car was organic matter. The most dominant peak in is a peak at mass-to-charge ratio (m/z) 57, which is considered as a marker of hydrocarbon-like organic aerosol (HOA) (Jimenez et al., Citation2003, Zhang et al., Citation2005). All the major ions from alkane mass spectra were present (m/z 29, 43, 57, 71, 85). The most important marker for oxygenated organic aerosol is the peak at m/z 44 (Zhang et al., Citation2005). In , the peak at m/z 44 is not significant, indicating that organic aerosol produced by the test car was not oxygenated.
Figure 5. (a) Average AMS mass spectra of particles generated from the toy car 1. (b) Some important mass ratios of particulate organic matter emitted from toy car emissions (OM is organic matter, OC is organic carbon, H is hydrogen, C is carbon and O is oxygen). (c) Mass size distribution of particulate organic matter.
Utilizing the high resolution capacity of the AMS time-of-flight mass spectrometer, elemental ratios, such as oxygen/carbon (O/C) and hydrogen/carbon (H/C), were obtained (Aiken et al., Citation2007). In addition, the organic mass to organic carbon (OM/OC) ratio was also determined (Aiken et al., Citation2007). shows these ratios. The observed O/C ratio is very small, which indicates very low oxygen content in the sampled organic matter. The organic matter mostly contains carbon and hydrogen. H/C and OM/OC ratios are about 2.1 and 1.21, respectively. The sampled organic matter likely has the chemical formula CnH2n, which has H/C and OM/OC ratios (2.0 and 1.17, respectively) very similar to our observed values. The organic matter may come from lubricating oil that is used in the toy cars. For example, a lubricating oil used is polyalphaolefins (PAO) (Sleiti, Citation2007), which has the formula CnH2n. The formation mechanism of particulate organic matter from toy cars is proposed: While the motor is running, it heats up and some of the lubricating oil evaporates. Then vapor of lubricating oil will nucleate or condense on existing particles while vapors diffuse out of the motor and the temperature of vapors decreases.
HR-Tof-AMS can provide mass size distribution of particulate organic matter (). There are two peaks shown in . The peak at 70 nm arises from nucleation of lubricating oil, which has a smaller particle size, and the peak at 500 nm could come from condensation of lubricating oil vapor onto larger existing particles. It should be noted that the size reported in is a vacuum aerodynamic particle diameter, which is different from the actual physical particle size. It is a function of particle density (Canagaratna et al., Citation2007).
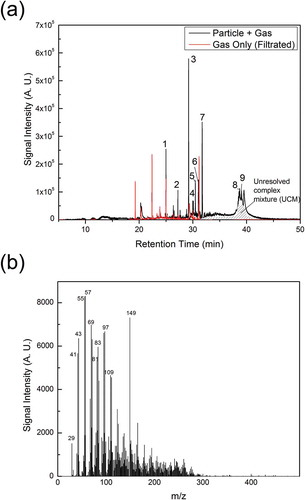
Organic emissions from a test toy car were also measured using a thermal desorption aerosol gas chromatograph (TAG), in order to detect key semivolatile and nonvolatile organic compounds (Williams et al., Citation2006). a shows the measurements of filtered gas (gas emission only) or direct sample (particle + gas) from toy car 1. Thus, the difference of these two gas chromatograms was the signal for organics in the particle phase. Particulate organics were identified according to their mass spectra and a list of them is shown in . The peaks labeled with 1 and 6 are silicone-containing organics, which probably originated from lubricants that contain silicone. Many branched alkanes were also identified, and they may originate from lubricating oil. Peak 7 in is phthalate, which may originate from plasticizers. A large amount of organics is not identified by TAG and known as “unresolved complex mixture” (UCM). A mass spectrum for the UCM is shown in . The presence of large peaks at m/z 43 (C3H7+), 55 (C4H7+), and 57 (C4H9+) may indicates that UCM is a group of hydrocarbons.
Table 2. Organic compounds identified in emissions of the toy car
Figure 6. TAG measurements of emissions from the toy car 1: (a) TAG chromatogram of organic matter from filtered gas (gas only) or direct sample (particle + gas). Thus, the difference of these two gas chromatograms was the signal for organics in particle phase. Both chromatograms have subtracted the chromatogram from the blank experiment, which was conducted with the toy car off. Each peak represents a chemical compound that is listed in . (b) A typical mass spectrum (electron impact ionization) for unresolved complex mixture in the TAG chromatogram. A.U., arbitrary unit.
The motivation for this study was to determine whether toy cars generate a significant amount of particles that would be relevant for potential health hazards to the children using them. Since these toys are often operated in an indoor environment, toy car 1 was run in a (well-ventilated laboratory) room and particle concentration was monitored approximately 1 m away from the toy car. shows that the toy car did not lead to a significant increase of particle concentrations if averaged over time; however, occasionally particle concentrations did spike to high levels. This indicates that particle emissions from the toy car were not well mixed in the room air and could be detected by the CPC occasionally. This implies that children could be periodically exposed to elevated particle concentrations. More importantly, the toxicity of these aerosol emissions from toy cars is still largely unknown, especially for those organic compounds. Metal species such as copper in nanoparticles have acute toxicological effects (Chen et al., Citation2006; Griffitt et al., Citation2007). Thus, although the aerosol emission rate from toy cars is much lower than from other indoor aerosol sources, such as smoking and cooking, it may still pose a potential threat to children’s health. It should also be noted that certain designs of toy cars have very low emission rates (enclosed and better sealed motors).
Figure 7. Monitoring particle number concentration in a room while operating toy car 1.
Summary
This study shows that certain toy cars with electric motors produce fine particles. Toy cars with high-speed electric motors, especially when the motors are not completely enclosed, can release elevated concentrations of particles. Used toy cars tend to emit more particles. Particle emission rates from the tested toy cars were 1.37 × 10⁷ and 7.47 × 10⁷ particles/s, respectively. Size (diameter) distributions of particles peaked at around 60 to 70 nm. Copper was the dominant inorganic species in these particles. High concentrations of particulate organic matter were also detected and characterized using an aerosol mass spectrometer. Peaks at m/z 29, 43, 57, 71, and 85 in the mass spectrum strongly suggest that alkane was the main component. By deploying a thermal desorption aerosol gas chromatography, a list of specific organic compounds were identified. A formation mechanism of particles from toy car motors was proposed. Spark discharges inside the electric motors produce ultrafine particles that contain organic compounds emanating from the electric motor by evaporation during operation of the toy car. These volatilized organic compounds condense on the particles generated by spark discharges, thereby increasing the particle sizes. Conditions that would minimize the particle emission rates from toy cars were reported. It should be noted that certain designs (types) of toy cars did not emit high concentrations of particles.
ORCID
Xiaofei Wang

Acknowledgments
The authors thank Sijia Li for her help in writing the paper. They also thank Raul Martinez for providing some toy cars and Zimeng Wang for his help in conducting some of the experiments.
Funding
This study was supported by McDonnell Academy Global Energy and Environmental Partnership (MAGEEP), Washington University in St. Louis, MO. Funding from a NSF MRI grant to obtain the aerosol mass spectrometer is gratefully acknowledged.
Supplemental Materials
Supplemental materials for this article can be accessed at http://dx.doi.org/10.1080/10962247.2015.1005255
Supplemental Material.docx
Download MS Word (145.3 KB)Additional information
Funding
Notes on contributors
Xiaofei Wang
Xiaofei Wang is a doctoral student at Washington University in St. Louis, MO.
Brent J. Williams
Brent Williams is the Raymond R. Tucker Distinguished I-CARES Career Development assistant professor at Washington University in St. Louis, MO.
Pratim Biswas
Pratim Biswas is the Lucy & Stanley Lopata Professor at Washington University in St. Louis, MO.
References
- Aiken, A.C., P.F. DeCarlo, and J.L. Jimenez. 2007. Elemental analysis of organic species with electron ionization high-resolution mass spectrometry. Anal. Chem. 79(21):8350–8358. doi:10.1021/ac071150w
- Air Quality Sciences, Inc. 2012. Indoor air quality and children’s products: Measuring chemical emissions from toys and other juvenile goods. http://www.ul.com/global/documents/newscience/whitepapers/indoorairquality/IAQ_Indoor%20Air%20Quality%20&%20Childrens%20Products_10-12.pdf
- Bau, S., O. Witschger, F. Gensdarmes, D. Thomas, and J.P. Borra. 2010. Electrical properties of airborne nanoparticles produced by a commercial spark-discharge generator. J. Nanopart. Res. 12(6):1989–1995. doi:10.1007/s11051-010-9856-y
- Canagaratna, M.R., J.T. Jayne, J.L. Jimenez, J.D. Allan, M.R. Alfarra, Q. Zhang, T.B. Onasch, F. Drewnick, H. Coe, A. Middlebrook, A. Delia, L.R. Williams, A.M. Trimborn, M.J. Northway, P.F. DeCarlo, C.E. Kolb, P. Davidovits, and D.R. Worsnop. 2007. Chemical and microphysical characterization of ambient aerosols with the aerodyne aerosol mass spectrometer. Mass Spectrom. Rev. 26(2):185–222. doi:10.1002/mas.20115
- Chen, Z., H. Meng, G. Xing, C. Chen, Y. Zhao, G. Jia, T. Wang, H. Yuan, C. Ye, F. Zhao, Z. Chai, C. Zhu, X. Fang, B. Ma, and L. Wan (2006). Acute toxicological effects of copper nanoparticles in vivo. Toxicol. Lett. 163(2): 109–120. doi:10.1016/j.toxlet.2005.10.003
- Davidowski, L., and Z. Grosser. 2007. Heavy metal analysis for the toy industry by inductively coupled plasma optical emission spectroscopy. http://www.perkinelmer.com/CMSResources/Images/4474169APP_ICPOESToyAnalysisHeavyMetal.pdf
- Griffitt, R.J., R. Weil, K.A. Hyndman, N.D. Denslow, K. Powers, D. Taylor, and D.S. Barber. 2007. Exposure to copper nanoparticles causes gill injury and acute lethality in zebrafish (Danio rerio). Environ. Sci. Technol. 41(23): 8178–8186. doi:10.1021/es071235e
- He, C., L. Morawska, and L. Taplin. 2007. Particle emission characteristics of office printers. Environ. Sci. Technol. 41(17):6039–6045. doi:10.1021/es063049z
- Horvath, H., and M. Gangl. 2003. A low-voltage spark generator for production of carbon particles. J. Aerosol Sci. 34 (11):1581–1588. doi:10.1016/s0021-8502(03)00193-9
- Jayne, J.T., D.C. Leard, X.F. Zhang, P. Davidovits, K.A. Smith, C.E. Kolb, and D.R. Worsnop. 2000. Development of an aerosol mass spectrometer for size and composition analysis of submicron particles. Aerosol Sci. Technol. 33(1–2):49–70. doi:10.1080/027868200410840
- Jimenez, J.L., J.T. Jayne, Q. Shi, C.E. Kolb, D.R. Worsnop, I. Yourshaw, J.H. Seinfeld, R.C. Flagan, X. Zhang, K.A. Smith, J.W. Morris, and P. Davidovits. 2003. Ambient aerosol sampling using the Aerodyne Aerosol Mass Spectrometer. J. Geophys. Res. 108(D7):8425. doi:10.1029/2001jd001213
- Jones, A.P. 1999. Indoor air quality and health. Atmos. Environ. 33(28): 4535–4564. doi:10.1016/S1352-2310(99)00272-1
- Kreiss, K. 1989. The epidemiology of building-related complaints and illness. Occup. Med. State Art Rev. 4(4):575–592.
- Lioy, P.J., T. Wainman, J.F. Zhang, and S. Goldsmith. 1999. Typical household vacuum cleaners: The collection efficiency and emissions characteristics for fine particles. J. Air Waste Manage. Assoc. 49 (2):200–206. doi:10.1080/10473289.1999.10463789
- Loeb, L.B. 1965. Electrical Coronas, Their Basic Physical Mechanisms. Berkeley, CA: University of California Press.
- Long, CM., H.H. Suh, L. Kobzik, P.J. Catalano, Y.Y. Ning, and P. Koutrakis. 2001. A pilot investigation of the relative toxicity of indoor and outdoor fine particles: In vitro effects of endotoxin and other particulate properties. Environ. Health Perspect. 109(10):1019–1026. doi:10.2307/3454956
- Naumova, Y.Y., S.J. Eisenreich, B.J. Turpin, C.P. Weisel, M.T. Morandi, S.D. Colome, L.A. Totten, T.H. Stock, A.M. Winer, S. Alimokhtari, J. Kwon, D. Shendell, J. Jones, S. Maberti, and S.J. Wall. 2002. Polycyclic aromatic hydrocarbons in the indoor and outdoor air of three cities in the U.S. Environ. Sci. Technol. 36(12):2552–2559. doi:10.1021/es015727h
- Niwa, A. 2004. Characterization of Fine Particle Emissions from Laser Printers. Master’s thesis in chemical engineering, Washington University in St. Louis, St. Louis, MO.
- Robinson, J., and W.C. Nelson. 1995. National human activity pattern survey data base. Research Triangle Park, NC: U.S. Environmental Protection Agency.
- Samet, J.M., M.C. Marbury, and J.D. Spengler. 1987. Health-effects and sources of indoor air-pollution. Am. Rev. Respir. Dis. 136(6):1486–1508. doi:10.1164/ajrccm/136.6.1486
- Schripp, T., M. Wensing, E. Uhde, T. Salthammer, C. He, and L. Morawska. 2008. Evaluation of ultrafine particle emissions from laser printers using emission test chambers. Environ. Sci. Technol. 42(12):4338–4343. doi:10.1021/es702426m
- Schwyn, S., E. Garwin, and A. Schmidt-Ott. 1988. Aerosol generation by spark discharge. J. Aerosol Sci. 19(5):639–642. doi:10.1016/0021-8502(88)90215-7
- Seinfeld, J.H., and S.N. Pandis. 2006. Atmospheric Chemistry and Physics: From Air Pollution to Climate Change. 2nd ed. Hoboken, NJ: John Wiley & Sons.
- Sleiti, A. 2007. Advanced cooling technology for rotors of high-power low-duty cycle generators using polyalphaolefins. J. Synthetic Lubrication 24(2): 77–90. doi:10.1002/jsl.30
- Sundell, J. 2004. On the history of indoor air quality and health. Indoor Air 14:51–58. doi:10.1111/j.1600-0668.2004.00273.x
- Szymczak, W., N. Menzel, and L. Keck. 2007. Emission of ultrafine copper particles by universal motors controlled by phase angle modulation. J. Aerosol Sci. 38(5):520–531. doi:10.1016/j.jaerosci.2007.03.002
- Wallace, L. 1996. Indoor particles: A review. J. Air Waste Manage. Assoc. 46(2):98–126. doi:10.1080/10473289.1996.10467451
- Watters, R.L., J.R. DeVoe, F.H. Shen, J.A. Small, and R.B. Marinenko. 1989. Characteristics of aerosols produced by the spark discharge. Anal. Chem. 61(17):1826–1833. doi:10.1021/ac00192a009
- Weisel, C.P., J. Zhang, B.J. Turpin, M.T. Morandi, S. Colome, T.H. Stock, D.M. Spektor, L. Korn, A. Winer, S. Alimokhtari, J. Kwon, K. Mohan, R. Harrington, R. Giovanetti, W. Cui, M. Afshar, S. Maberti, and D. Shendell. 2005. Relationship of Indoor, Outdoor and Personal Air (RIOPA) study: Study design, methods and quality assurance/control results. J. Expos. Anal. Environ. Epidemiol. 15(2):123–137. doi:10.1038/sj.jea.7500379
- Williams, B.J., A.H. Goldstein, N.M. Kreisberg, and S.V. Hering. 2006. An in-situ instrument for speciated organic composition of atmospheric aerosols: Thermal desorption aerosol GC/MS-FID (TAG). Aerosol Sci. Technol. 40(8):627–638. doi:10.1080/02786820600754631
- Zhang, Q., M.R. Alfarra, D.R. Worsnop, J.D. Allan, H. Coe, M.R. Canagaratna, and J.L. Jimenez. 2005. Deconvolution and quantification of hydrocarbon-like and oxygenated organic aerosols based on aerosol mass spectrometry. Environ. Sci. Technol. 39(13):4938–4952. doi:10.1021/es048568l