
Abstract
Forty-year (1971–2010) observations of cloud cover and types have been analyzed, and implications on the effects of aerosol–cloud feedback were explored. Cloud cover and types have been observed over Korea on the basis of visible (human-eye) attributes without any change in official observing instructions. Visibility has been used as an ongoing proxy measure of aerosol concentrations, and observed meteorological variables such as sunshine duration and precipitation have been employed to analyze aerosol causes and implications for urban and regional climate. The analysis revealed persistent decade-long patterns in Korea: steadily reduced visibility (–0.37 km/yr), consistently decreasing sunshine duration (–0.06 %/hr), and declining occurrence of light precipitation. Spatial distributions of sunshine duration and visibility exhibited more localized variations in the early period (1971–1990), and tended to be more uniform throughout Korea over more recent years (1991–2010), implying the recent regional-scale impact of cloud change over northeast Asia. Cloud analysis results showed that the five most common types were stratocumulus (Sc), cirrus (Ci), altostratus (As), stratus (St), and nimbostratus (Ns), with occurrences of 33%, 17%, 17%, 9%, and 8%, respectively. Occurrence of rarely precipitating or nonprecipitating low-level Sc clouds showed an increasing (+0.34%/yr), but no (or only minor) effects of aerosols on heavy precipitation such as cumulus cloud types were found. Cloud cover in the range of 6/10 to 8/10 units has increased by 31.5 ± 6.5%, and occurrences of both cloud-free (~2/10 units) and overcast (~8/10 units) conditions have decreased.
Implications: Aerosol–cloud-precipitations interaction is highly nonlinear due to feedback mechanisms. One reason for our poor understanding of the aerosol–cloud feedback study is the variety of cloud types with their complicated responses to variations of the aerosol. Our study on the response of precipitation-cloud to long-term anthropogenic aerosols over 40 years (1971–2010) in South Korea demonstrated that recent changes tend to be at a regional scale, and change in stratocumulus clouds is the most significant. In addition, the changes in cloud-relevant meteorological variables such as sunshine duration and light precipitation were not consistent with expected local anthropogenic aerosol after 1990, implying the importance of long range transboundary influence on a regional or larger than urban scale over the recent years in the northeast Asian region.
Introduction
Aerosols enhance the scattering and absorption of solar radiation, and have a substantial effect on both cloud properties and the initiation of precipitation by serving as cloud condensation nuclei (CCN) (Twomey, Citation1974; Twomey et al., Citation1977; Liou et al., Citation1990; Liepert, Citation1997; Rebetez and Beniston, Citation1998). Twomey et al. (Citation1977) and other relevant studies have reported that CCN can increase cloud albedo by increasing the concentration and reducing the size of cloud droplets. In addition, high concentrations of smaller droplets can change the precipitation, resulting in longer cloud life spans (Albrecht, Citation1989; Rosenfeld et al., Citation2008).
The impact of aerosol changes on the formation of cloud and precipitation is one of the most discussed processes (Stevens and Feingold, Citation2009; Small et al., Citation2009; Rosenfeld et al., Citation2008). Rosenfeld et al. (Citation2008) showed that properties of aerosols can cause the suppression of coalescence and precipitation, which can result in a decrease in light precipitation. Other changes such as aerosol-laden cloud droplet size, suppressed drizzle formations, and associated radiative forcing changes are widely reported (Kim et al., Citation2003; Schwartz and Slingo, Citation1996; Haywood and Boucher, Citation2000; Rosenfeld and Lensky, Citation1998). As an analysis study of long-term surface observation, Liu et al. (Citation2002) analyzed sunshine duration in association with changes in precipitation rate and daily temperature range. Some cloud studies have produced observational estimates of the cloud albedo, and the longer cloud lifetime effects of aerosol (Quaas et al., Citation2008; Lebsock et al., Citation2008; Quaas et al., Citation2009; Lohmann et al., Citation2010). However, cloud feedback studies still prove to be highly inconclusive in climate sensitivity estimations because linking aerosol–cloud-precipitation interaction is highly nonlinear due to feedback mechanisms with cloud microphysics and cloud dynamics.
For thousands of years, many weather phenomena have been observed through direct human observation. The human eye represents one of the main semiquantitative weather instruments for identifying cloud properties. The classifications of clouds and reports by observers of their coverage have taken on considerable value over the years. Those long-term reports can now provide valuable information for discerning changes in cloud cover and types that might not be detectable in the short record of satellite data (Holton et al., Citation2002). For the last 40 years or more, meteorologists at the Korea Meteorological Administration (KMA) have recognized that information on cloud coverage and cloud types helps in producing weather predictions and reports. KMA weather reports on clouds have been available for several decades with no change in the official observation instructions, and therefore interdecadal variations and trends are available for study.
For the past two decades, East Asia has been one of the most rapidly developing regions in the world, with consequently large increases in air pollution (van der Mensbrugghe et al., Citation2010; Zhao et al., Citation2013). Korea has been affected by long-range transport aerosols originating from China, as well as by an increase in its own aerosol production from industrial development. In this sense, the Korean peninsula, which is downstream of the Chinese high emission area, presents an opportunity to identify the effects of aerosols on cloud changes, atmospheric radiation, and, in turn, on regional climate.
In this study, we examined the variation of the interdecadal cloud properties in association with anthropogenic aerosols in a qualitative manner by employing KMA data on cloud cover/types and other meteorological variables, including visibility, precipitation, and sunshine duration. Both cloud properties and visibilities have been observed semiquantitatively over the 40-year period 1971–2010, and well recorded by KMA at multiple stations located in metropolitan, urban, suburban, and rural areas throughout Korea.
Data and Method
Meteorological data from 23 stations operated by KMA, with records dating back to 1971 or earlier (www.kma.go.kr/weather/data_monthly.jsp), were used as the basis for the analysis of the 40-year trends. shows the locations of the 23 stations this study employed. They are located in urban, rural, and suburban areas. We focused on the results of urban areas, including Seoul, the capital of Korea, and six other metropolitan cities: Incheon, Daejeon, Daegu, Ulsan, Gwangju, and Busan. These cities represent areas with high current aerosol concentrations (with low visibility) due to rapid increases of anthropogenic emissions of aerosols over a relatively short period since the late 1970s.
Figure 1. Locations of 23 meteorological stations. Black dots (●) are seven metropolitan cities: 1, Seoul, the capital of Korea; 2, Incheon; 3, Daejeon; 4, Daegu; 5, Ulsan; 6, Gwangju; and 7, Busan. Stars (⛆) represent other nonurban sites.
Cloud types and cloud cover were measured semiquantitatively by a meteorologist’s visual evaluation at KMA and recorded following the 10-category system of the World Meteorological Organization (WMO) (WMO, Citation1987; KMA, Citation2002). Given the cloud cover and cloud types, we examine changes in occurrence ratios of cloud types and cover over the 40 (1971–2010) years, and discuss the decades-long changes in association with other meteorological and climatological parameters.
Because of the lack of data on particulate matter concentrations prior to the late 1990s in Korea, visibilities were employed instead of aerosol concentrations, as a continuous signal of aerosol variations. This is because visibility reduction mostly occurs as a result of the scattering of light by aerosol. Visibility has been previously employed as an indicator of air quality (Ghim et al., Citation2005) because both primary emissions and secondary formation of aerosols, especially fine particles, contribute to visibility impairment (Sloan and White, Citation1986; WHO, Citation1994). Visibility has been observed following the WMO guidance (WMO, Citation2008) in a semiquantitative manner (by human eye) at 3-hr intervals at all surface weather stations ().
Other meteorological variables, including the sunshine duration, precipitation, and cloud cover and types, were used to indirectly infer aerosol–cloud interactions. Cloud cover and type was also observed by human eye at 3-hr intervals, and sunshine duration was measured every hour at KMA using a rotating-type EKO Lotary instrument that has a self-contained calibration system at all stations. For the analysis of the precipitation that was observed every hour, we employed the records of hourly precipitation amounts. We divided the precipitation rate into four categories of precipitation intensity (precipitation amount per unit time; PI), as indicated in . Three of the categories correspond to the observation guidelines of KMA (KMA, Citation2002), and we added “Precipitation intensity 0” for our own purposes. Four categories of PI were calculated at each station by taking the precipitation amount and rain duration for each hour, then averaging them over a year.
Table 1. Classification of precipitation intensity (PI) in this study
Results
Trends in visibility
illustrates the time series of visibility over the study period, and shows the spatiotemporal distributions of visibility across the Korean peninsula. The overall visibility has decreased, particularly in metropolitan areas (), and the mean visibility reduction rate was about –46% (–0.37 km/yr) over the analysis period. In particular the Seoul metropolitan area, which encompasses Seoul and the neighboring city, Incheon, shows the lowest visibility over the period before the 1980s ( and ), which is mainly due to Seoul’s early economic development that began in the 1970s (KME, Citation2010). Before the late 1980s, the reduction in visibility exhibited different local features (). For example, the Seoul metropolitan area showed decade-long decreases in visibility during the period 1971–1980. This is because Seoul started out heavily industrialized and thus polluted relatively earlier, while the other cities started industrialization relatively later, such as early 1980, with much cleaner base level, and then declined, tending to be more like Seoul’s level. As a result, lower levels of visibility tended to be more uniform over most urban cities beginning in the mid 1990s ().
Figure 2. Time series of annual mean visibilities observed seven major cities and nonurban cities.
Figure 3. Spatial distributions of visibility. Kriging method was used as an objective analysis to produce spatial distributions from measurements obtained at 23 sites illustrated in .
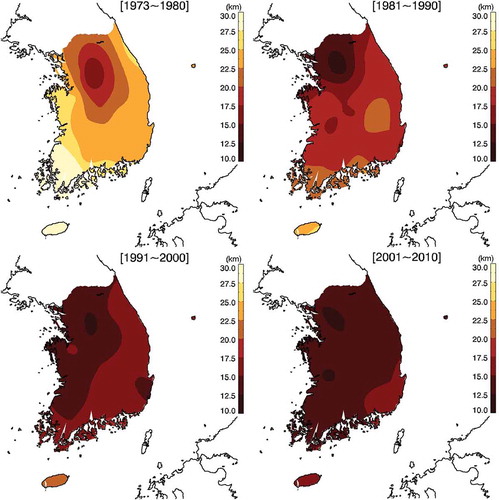
This feature is also obvious in spatial variations of visibility, as shown in . The Seoul metropolitan area shows the lowest visibility in 1971–1990 owing to relatively early economic development, as indicated already. However, over recent years (i.e., beginning in 1991), large parts of the Korean peninsula began to show significant visibility deterioration due mainly to development within Korea, as well as economic development with rapid construction of industrial complexes throughout northeast Asia beginning in the early 1980s.
However, most cities show a leveling off of visibility since late 1990s, and remain unchanged with no more deterioration of visibility over most cities since then. This presumably has to do with both the dominating regional-scale transport of aerosol from the upstream area (i.e., east area of China) and relatively more decline in domestic (or local-scale) aerosol emission. Over this period, Chinese aerosol emission increased steadily while domestic emission has been sharply decreased during the “Asian financial crisis era” over the late 1990s and the subsequent emission reduction policy “the Special Act on Seoul Metropolitan Air Quality Improvement” launched in early 2000s. This emission feature can be found in all of the global bottom-up emission inventories such as MACCity (Granier et al., Citation2011), ACCMIP (Lamarque et al., Citation2010), RCP8.5 (van Vuuren et al., Citation2011), and REAS (Ohara et al., Citation2007), showing the reduced organic carbon (OC) and black carbon (BC) emissions in South Korea with consistent increase in China, suggesting possible cause of the regional (or larger) scale impact. Further study would be needed to address the detailed trend over Northeast Asia.
Trends in sunshine duration
shows temporal variations of sunshine duration observed over different regions in 1971–2010. A unit of one sunshine hour (%/hr) is defined as the percentage of direct solar radiation >120 W/m2 per hour, as used by Liu et al. (Citation2002). Long-term linear regression (solid line) exhibits uniform trends for all the cities. Here, it is noted that KMA was instrumented with a new type of equipment in around 1990, and a recent short-term period covering a post-1990 year has been carried out. Short-term regression lines starting in 1990 (thick solid line) also show consistent trends, except for one eastern city, Ulsan. Statistics of long-term linear regression analysis showed a decreasing trend, with a more than 99% significance level from the Durbin–Watson test (Montgomery et al., Citation2001), as indicated in . We can see high levels of deviation at the stations each year, but their long-term means show an overall decrease in the duration of sunshine.
Figure 4. Time variations of sunshine duration with the regression lines over the analysis period. Short-term regression lines (thick blue line) starting in 1990 are shown for individual seven major cities.
Short-term regression lines over recent years starting in 1990 for seven major cities show a more rapid reduction than those for the long-term period, with Ulsan being the only exception. We do not know exactly the reason for the opposite trend in Ulsan. It probably has to do with a relatively smaller effect of transport process on east Korea from China, because steeper declines of the sunshine duration and visibility were mostly found over western cities located all geographically more adjacent to China than the eastern coastal city, Ulsan. Further analysis will be the subject of our future study. Since 1991, in the western cities of Seoul, Incheon, Daejeon, and Gwangju, which are all located closer to eastern China (), sunshine duration decreased more sharply than in the eastern or southern cities of Ulsan, Busan, and Daegu.
shows the spatial distribution of the changes in sunshine duration from the 1970s through the 2000s. Over the whole analysis period, consistently decreasing sunshine duration was found with the averaged declining rate of –0.06 %/hr (). The Seoul metropolitan area, where the lowest visibility was observed in 1970–1980, shows the lowest sunshine duration of 41.3 ± 7%/hr, while other regions showed 47.1 ± 8 %/hr (). In comparing the period 1971–1980 with 2001–2010, we can also see some homogeneous spatial distributions again: Sunshine duration has tended to be uniform over the recent years, and has been generally reduced throughout Korea with a reduction rate of ~5% over 40 years (1971–2010).
Figure 5. Spatial distributions of sunshine duration. Kriging objective analysis was used to produce spatial distributions from measurements obtained at 23 sites illustrated in .
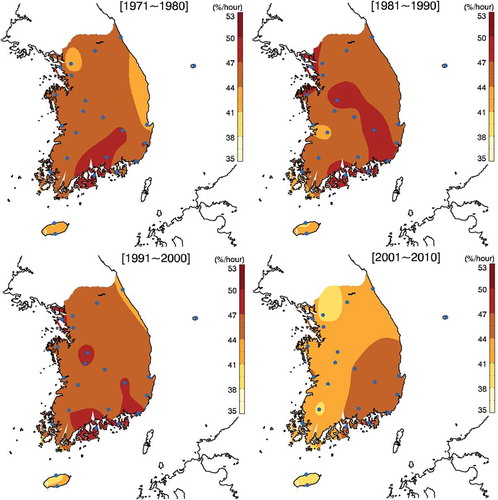
During 1971–1990, our statistics show that the reductions in sunshine duration showed good correlation with visibility, usually with coefficients (r2) greater than 0.5. Higher sunshine duration in the mid 1990s is believed to be caused by the same reason of higher visibility as described earlier. However, after 2000, the situation became more complicated, and we cannot see any relevant pattern in comparison with , only showing that the localization of sunshine reduction has overall decreased throughout the Korean peninsula with more spatial homogeneity. Even the most polluted area shows no significant reduction, as indicated in . On the contrary, Gwangju and Daejeon show the largest and second largest reductions, respectively, rather than the most polluted areas such as Seoul or Busan. This suggests that local visibility is not the only control factor for sunshine duration over recent years, and implies the importance of regional-scale influences caused by steadily increased anthropogenic aerosols over the upstream northeast Asian regions.
We also found that indicators of air quality, such as concentrations of ozone and PM10 obtained at background stations located on western and southern islands, showed shifted but homogenized levels in compared with those in the 1970s (not shown here). This also suggests that a possible primary contributor to the reduction in sunshine duration is not the direct impact of aerosols but the increased effect of regional-scale clouds and/or cloud albedo from long-range transport of anthropogenic aerosol emissions over northeast Asia. This result is somewhat similar to the situation in Taiwan described by Liu et al. (Citation2002). Further studies, including modeling the sensitivity related to the regional radiation changes associated with aerosol clouds, will be needed to address this effect in Northeast Asia.
Change in precipitation intensity, cloud type, and cover
shows the trends in PI according to the categories described in . PI is calculated by taking the precipitation per hour at each station, and then averaging it over 1 year. The relative frequency of PI range of ~0.1 mm/hr observed at urban sites shows declining trends (–0.75%/yr), while precipitation at intensities between 0.1 and 3.0 mm/hr has increased (+0.47%/yr) instead. Suppressed light precipitation and increased heavy precipitation occurred in almost all of South Korea, including seven metropolitan cities, as indicated in . However, there was a sudden shift occurred around 1990, which is presumably due to the KMA’s new instrumentation and equipment around 1990 as addressed earlier. We thus tested the robustness of the results in by separating analysis period of 40 years (1971–2010) into two subperiods, before and after 1990.
Figure 6. Time variations of occurrences of precipitation intensities (PI) observed over 1970–2010.
shows the trends in PI for the two periods: before and after 1990. Precipitation intensities of less than 0.1 mm/h (PI = 0) clearly show a big decrease in PI before the 1990s, with an increasing rate of about –0.5%/yr, and then declined at a steady pace, narrowing the spatial deviations since 1990. Relative frequencies of PI = 0 with lower spatial deviations after 1990 seem likely with sunshine reduction and visibility analysis, where there were widespread patterns. This is implying again the dominance of regional-scale cloud change caused by recent aerosol over northeast Asia. This suppressed light precipitation (i.e., drizzle) generally forms in clean environments and occurs from almost nonprecipitating stratus or stratocumulus clouds (Holton et al., Citation2002), and therefore our results strongly indicate that nonprecipitating stratiform clouds are of great importance to the entire Korean peninsula with regard to the modification of cloud mass by increased aerosols over northeast Asia.
Figure 7. Time variations of occurrences of precipitation intensities (PI) averaged for 23 sites for the period of (left panel) and after 1990 (right panel). Black dots (●) indicate mean, and error bars plus and minus one standard deviation.
In contrast, heavy precipitation such as PI = 3 revealed the increasing trends for both before and after 1990, with a more pronounced change before 1990. This pattern, more localized and bigger change, is the similar tendency found with both visibility and sunshine duration as described earlier. Not surprisingly, these results suggest the long-term effects of aerosol, which acts to form heavy precipitation with longer lifetime of clouds as suggested by Albrecht (Citation1989).
shows the changes in cloud types during the period of analysis. According to the WMO guidance, clouds are classified into 10 types based on shape, size, and height. There are high-level clouds: cirrus (Ci), cirrostratus (Cs), and cirrocumulus (Cc); mid-level clouds: altocumulus (Ac), altostratus (As), and nimbostratus (Ns); low-stratiform clouds: stratus (St) and stratocumulus (Sc); and convective clouds: cumulus (Cu) and cumulonimbus (Cb). We analyzed long-term changes in cloud type to see what types of clouds can contribute to changes in PI. In , the five most common types of clouds exceeding mean occurrences of 5% in Korea were Sc, Ci, As, St, and Ns, and their relative frequencies of occurrences were 33%, 17%, 17%, 9%, and 8%, respectively. This is in qualitative agreement with the results of Warren et al. (Citation1986). Recorded occurrences of other cloud types such as Cc, Cs, and Cb were less than 5%, so we did not further analyze those cloud types.
Figure 8. Time series of seven cloud types divided into 10 type classifications of WMO for the period of 1970–2010. Black dots (●) indicate mean, and error bars plus and minus one standard deviation.
Of the seven cloud types, the occurrence of Sc has increased sharply with the increasing rate of +0.34%/yr, while Ns, As, and Cu have small decreasing trends. Among the stratiform clouds Sc and St in particular, occurrences of Sc have increased discernibly since the late 1980s, while St showed a small increase but no distinctive trend through the entire multiple-decade analysis period. However, it is noted that occurrences of heavy rainfall clouds such as Cu have not changed until late 1990, but there appears to be a noticeable decrease of occurrence since then (). This unchanged (or reduced) occurrence of heavy rainfall clouds implies that Sc cloud remains itself much longer, rather than developing to cumulus type cloud by change in aerosol concentrations .
shows the time series of 11 categories of cloud covers observed in Korea. We can see that the occurrence of overcast (10/10 units) days has been sharply decreased, while cloud covers of between 5/10 and 8/10 units have increased remarkably. Occurrences of covers of less than ~5/10 and more than 8/10 units have decreased except for occurrences of 3/10 units, which shows a small increase. In particular, clear days with a cloud cover of 0/10 units show modest changes with no distinctive transition except clear decrease since 2000.
Figure 9. Time series of cloud cover fractions divided to 11 categories for the period of 1970–2010. Black dots (●) indicate mean, and error bars plus and minus one standard deviation.
In addition, cloud coverage showed an increase of 31.5 ± 6.5% over the range of 6/10 to 8/10 units, with a maximum of up to 37% for 6/10, over the last decade (). This increase of cloud cover seems undoubtedly due to the persistent increase of occurrence of Sc clouds (), and it is likely that the delayed precipitation and increased cloud water content within Sc clouds are due to the retarded coalescence growth of precipitation by large numbers of anthropogenic CCN, as hypothesized by Warner and Twomey (Citation1967). This phenomenon can be also seen in with the considerable changes in the light PI.
Discussions
Although our results in this study are qualitative, some evidence of aerosol–cloud feedback is detected, such as changes in sunshine duration, cloud properties, and PI occurrences. Change in visibility exhibits a clearly reduced pattern, especially for the period before the 1980s, and this consistently decreasing long-term trend is also in rough agreement with the timing of increased anthropogenic emissions over northeastern Asia. This is suggesting in reverse a direct impact of aerosols emitted from local cities over the earlier (i.e., prior to 1980) analysis period.
Sunshine duration was also reduced at the urban scale before 1980, but the effect has widened and become more obvious throughout Korea since 1990. On the most basic assumption that cloud water would precipitate out eventually, one would expect the higher PI to increase and lower PI to decrease, respectively, due to aerosol effects. This phenomenon can be seen in . Changes in PI have been observed in the 1980s especially in Seoul and its neighboring city, Incheon. However, no clear changes were found since 1990s. Again, this implies that the precipitation property change in regional scales is one of the causes of the sunshine duration reduction related to aerosol effects.
Clouds are highly nonlinear systems, and cloud–environment interactions can lead to many unanticipated results, confounding attempts to interpret data. The hypothesized cloud–aerosol arguments underpinning the Twomey effect (Twomey, Citation1977) can easily be extended to include the impact of aerosols on precipitation in association with increased CCN (first indirect effect). Albrecht (Citation1989) suggested that increasing aerosols reduces the conversion of cloud liquid to rain precipitating out of clouds to the surface, and thus cloud masses are suspended longer in the atmosphere (second indirect effect). Each hypothesized link rests on reasonable observational evidence to quantify the overall effects of the aerosol burden on realistic cloud fields.
Our observational study has revealed persistent changes in cloud amount for specific cloud types. In particular, a persistent increase of Sc was only found with increased cloud cover ranging from 3/10 to 8/10 units. However, clouds with much lower liquid water content, such as Ci and Cs, show no increasing (or decreasing) trends, as indicated in . Therefore, we hypothesized that if the second indirect effect of aerosols increases the lifetime of clouds, then the changes in occurrence of clouds that suppress precipitation should be limited to low-level stratiform clouds such as Sc. Our results showed that sustained cloud masses were found in the form of nonprecipitating or rarely precipitating Sc clouds, implying the specific cloud type, amount, and height favorable to the aerosol indirect effect within clouds. This is also related to reduced occurrence of light precipitation (i.e., drizzle), because it is most likely to form in clean environments in which cloud droplet number concentrations are about 100 m−3 or lower, and is highly common from rarely precipitating or almost nonprecipitating stratiform clouds such as stratus or stratocumulus clouds (Holton et al., Citation2002). Therefore, we concluded that, as hypothesized by Warner and Twomey (Citation1967), precipitation is delayed, and the cloud water content increased, not always in every cloud, but mostly in Sc cloud, due to the retarded coalescence growth of precipitation with reduced light precipitation occurrences by anthropogenic CCN.
Despite the aerosol indirect effect mentioned here, however, some controversial reports were also found. Jiang et al. (Citation2002) pointed out that evaporation with a lower liquid water content (LWC) can offset the cloud albedo enhancement, although entrained CCN enhance the droplet concentration. They also suggested that sometimes the role of condensation and evaporation in the LWC response to aerosols is more important than indirect aerosol effects (Lee et al., Citation2009; Ackerman et al., Citation2004). This result is contradictory to the concept of Albrecht (Citation1989). In addition, there are further possible climatological contributors such as regional-scale cloud change as a result of changes in large-scale pure meteorological circulation such as the great variation in regional temperature (Hsu and Chen, Citation2002). Therefore, the effect of aerosols on cloud mass requires considerably more robust and quantitative studies before a reasonable understanding can be achieved, and further research, including detailed simulations and verification against relevant intensive field experiments, is needed to increase understanding of aerosol–cloud interaction processes over northeast Asia.
Conclusion
This study focused on the indirect effects of aerosols on regional climate change, specifically the increasing impact of regional-scale clouds and cloud albedo caused by rising anthropogenic aerosol emissions over northeastern Asia. We analyzed long-term meteorological variables observed at 23 stations throughout Korea over the past 40 years (1971–2010) to examine the long-term impact of aerosols on the trends in climatological change within certain parameters.
The results showed decreasing trends in visibility and sunshine duration for the study period. Spatial features of the changes showed that different changes were found due to aerosol emissions depending on the locations of the cities, especially prior to 1980. Our result shows that long-term light precipitation has shifted through striking suppression of reduced light precipitation of intensities less than 0.1 mm/hr, especially since 1980. These changes occurred over a broadening area, showing the widening of aerosol effects over Korea, and no detectable changes were found after 1990. Aerosol emissions over northeastern Asia and long-range transboundary aerosol processes (as opposed to urban and local aerosol emissions) can play a certain role in regional cloud change over northeast Asia.
By analyzing cloud properties observed over 40 years, we concluded that the second indirect effect of aerosol prevails in stratocumulus and stratus clouds over our study area. In other words, suppression of the collision and coalescence growth of precipitation by increasing aerosols as suggested by Twomey (1967) occurred in Korea only in nonprecipitating low-level stratocumulus clouds. Increased cloud amount is also confined to 6/10 to 8/10 units. However, no significant trend has been found in heavy rains or convective clouds, and occurrences of cloud amounts of 9/10 to 10/10 also show no variation or decreasing trends.
In terms of climate change studies, the indirect effect of aerosols is highly complicated and has a higher degree of uncertainty than the direct affect (radiation scattering). This is because there has been little direct observation linking aerosols and cloud properties. The relatively poor simulation of atmospheric clouds in the present climate is another reason for some concern, requiring a careful approach to investigate its impact. Our result is based on a semiquantitative approach with some corresponding error sources to some extents. Nevertheless, we believe that it can be valuable for studying the long-term implications of cloud–aerosol feedback for our understanding aerosol–cloud interactions over the northeast Asia.
Recently, more detailed information about clouds has become available from satellite instruments, which can reduce the uncertainties through the long period of records maintained. In addition, three-dimensional information on clouds can be obtained from satellites that observe the same scene from different angles, such as the Multi-angle Imaging Spectroradiometer (MISR). These instruments are useful for studying cloud–aerosol interactions but do not yet offer sufficiently long records. In this regard, our results can be valuable to study the qualitative long-term implications of cloud–aerosol feedback. Furthermore, our study also takes note of cloud type and coverage. Future studies of the effect of aerosols on cloud mass over northeastern Asia will require well-designed, long-term simulations and verification against relevant field experiments or satellite observations.
Funding
This work was supported by the Basic Science Research Program through the National Research Foundation of Korea (NRF) funded by the Ministry of Education (2013R1A1A2057732), and also supported by the Korea Ministry of Environment as the Climate Change Correspondence Program (2013001310001). The authors benefited from the National Institute of Supercomputing, and Network/Korea Institute of Science/Technology Information with supercomputing resources including technical support (KSC-2014-C1-009).
Additional information
Funding
Notes on contributors
Hyo-Jung Lee
Hyo-Jung Lee is a postdoctoral researcher, Jeong-Eon Kang is a graduate student, and Cheol-Hee Kim is a professor in the Department of Atmospheric Sciences at Pusan National University, Busan, Republic of Korea.
Jeong-Eon Kang
Hyo-Jung Lee is a postdoctoral researcher, Jeong-Eon Kang is a graduate student, and Cheol-Hee Kim is a professor in the Department of Atmospheric Sciences at Pusan National University, Busan, Republic of Korea.
Cheol-Hee Kim
Hyo-Jung Lee is a postdoctoral researcher, Jeong-Eon Kang is a graduate student, and Cheol-Hee Kim is a professor in the Department of Atmospheric Sciences at Pusan National University, Busan, Republic of Korea.
References
- Albrecht, B.A. 1989. Aerosols, cloud microphysics, and fractional cloudness. Science 245:1227–30. doi:10.1126/science.245.4923.1227
- Ackerman, A.S., M.P. Kirkpatrick, D.E. Stevens, and O.B. Toon. 2004. The impact of humidity above stratiform clouds on indirect aerosol climate forcing. Nature 432:1014–17. doi:10.1038/nature03174
- Ghim, S.Y., K.C. Moon, S.H. Lee, and Y.P. Kim. 2005. Visibility trends in Korea during the past two decades. J. Air Waste Manage. Assoc. 55:73–82. doi:10.1080/10473289.2005.10464599
- Granier, C., B. Bessagnet, T. Bond, A. D’Angiola, H. Denier van der Gon, G. J. Frost, A. Heil, J. W. Kaiser, S. Kinne, Z. Klimont, S. Kloster, J.-F. Lamarque, C. Liousse, T. Masui, F. Meleux, A. Mieville, T. Ohara, J.-C. Raut, K. Riahi, M.G. Schultz, S.J. Smith, A. Thompson, J. van Aardenne, G.R. van der Werf, and D.P. van Vuuren. 2011. Evolution of anthropogenic and biomass burning emissions of air pollutants at global and regional scales during the 1980–2010 period. Clim. Change 109(1–2):163–190. doi:10.1007/s10584-011-0154-1
- Holton, J.R., J.A. Curry, and J.A. Pyle. 2002. Encyclopedia of Atmospheric Sciences, Vol. 1. San Diego, CA: Academic Press.
- Hsu, H.H., and C.T. Chen. 2002. Observed and projected climate change in Taiwan. Meteorol. Atmos. Phys. 79:87–104. doi:10.1007/s703-002-8230-x
- Haywood, J., and O. Boucher. 2000. Estimates of the direct and indirect radiative forcing due to tropospheric aerosols: A review. Rev. Geophys. 38(4):513–43. doi:10.1029/1999RG000078
- Jiang, H., G. Feingold, and W.R. Cotton. 2002. Simulations of aerosol-cloud-dynamical feedbacks resulting from entrainment of aerosol into the marine boundary layer during the Atlantic Stratocumulus Transition Experiment, J. Geophys. Res. 107:4813. doi:10.1029/2001JD001502
- Kim, B.G., S.E. Schwartz, M.A. Miller, and Q. Min. 2003. Effective radius of cloud droplets by ground-based remote sensing: Relationship to aerosol. J. Geophys. Res. 108:4740. doi:10.1029/2003JD003721
- Korea Meteorological Administration (KMA). 2002. Guidance of surface meteorological observation. Seoul, Korea. (in Korean)
- Korean Ministry of Environment. 2010. Annual report of air quality in Korea. Gwacheon, Korea: Ministry of Environment and National Institute of Environmental Research.
- Lamarque, J.-F., T.C. Bond, V. Eyring, C. Granier, A. Heil, Z. Klimont, D. Lee, C. Liousse, A. Mieville, B. Owen, M.G. Schultz, D. Shindell, S. J. Smith, E. Stehfest, J. Van Aardenne, O.R. Cooper, M. Kainuma, N. Mahowald, J.R. McConnell, V. Naik, K. Riahi, and D.P. van Vuuren. 2010. Historical (1850–2000) gridded anthropogenic and biomass burning emissions of reactive gases and aerosols: methodology and application. Atmos. Chem. Phys. 10(15):7017–39. doi:10.5194/acp-10-7017-2010
- Lebsock, M.D., G.L. Stephens, and C. Kummerow. 2008. Multisensor satellite observations of aerosol effects on warm clouds. J. Geophys. Res. 113:d15205. doi:10.1029/2008JD009876
- Lee, S.S., J.E. Penner, and S.M. Saleeby. 2009. Aerosol effects on liquid-water path of thin strato-cumulus clouds. J. Geophys. Res. 114:D07204. doi:10.1029/2008JD010513
- Liepert, B. 1997. Recent changes in solar radiation under cloudy conditions. Int. J. Climatol. 17:1581–93. doi:10.1002/(ISSN)1097-0088
- Liou, K.N., S.C. Ou, and G. Koenig. 1990. An investigation of the climatic effect of contrail cirrus. In Air Traffic And the Environment: Background, Tendencies, and Potential Global Atmospheric Effects, ed. U. Schumann, 154–69. Berlin, Germany: Springer-Verlag.
- Liu, S.C., C.H. Wang. C.J. Shiu, H.W. Chang, C.H. Hsiao, and S.H. Liaw. 2002. Reduction in sunshine duration over Taiwan: Causes and implication. Terrestrial Atmos. Oceanic Sci. 13(4):523–45.
- Lohmann, U., L. Rotstayn, T. Storelvmo, A. Jones, S. Menon, J. Quaas, A.M.L. Ekman, D. Koch, and R. Ruedy. 2010. Total aerosol effect: Radiative forcing or radiative flux perturbation? Atmos. Chem. Phys. 10(7): 3235–46. doi:10.5194/acp-10-3235-2010
- Montgomery, D.C., E.A. Peck, and G.G. Vining. 2001. Introduction to Linear Regression Analysis, 3rd ed. New York, NY: John Wiley & Sons.
- Ohara, T., H. Akimoto, J. Kurokawa, N. Horii, K. Yamaji, X. Yan, and T. Hayasaka. 2007. An Asian emission inventory of anthropogenic emission sources for the period 1980–2020. Atmos. Chem. Phys. 7(16):4419–44. doi:10.5194/acp-7-4419-2007
- Quaas, J., O. Boucher, N. Bellouin, and S. Kinne. 2008. Satellite-based estimate of the direct and indirect aerosol climate forcing. J. Geophys. Res. 113:D05204. doi:10.1029/2007JD008962
- Quaas, J., Y. Ming, S. Menon, T. Takemura, M. Wang, J.E. Penner, A. Gettelman, U. Lohmann, N. Bellouin, O. Boucher, A.M. Sayer, G.E. Thomas, A. McComiskey, G. Feingold, C. Hoose, J.E. Kristjansson, X. Liu, Y. Balkanski, L.J. Donner, P.A. Ginoux, P. Stier, B. Grandey, J. Feichter, I. Sednev, S.E. Bauer, D. Koch, R.G. Grainger, A. Kirkevag, T. Iversen, O. Seland, R. Easter, S.J. Ghan, P.J. Rasch, H. Morrison, J.-F. Lamarque, M.J. Iacono, S. Kinne, and M. Schulz. 2009. Aerosol indirect effects—General circulation model intercomparison and evaluation with satellite data. Atmos. Chem. Phys. 9(22):8697–717. doi:10.5194/acp-9-8697-2009
- Rebetez, M., and M. Beniston. 1998. Changes in sunshine duration are correlated with changes in daily temperature range this century: An analysis of Swiss climatology data. Geophys. Res. Lett. 25:3611–13. doi:10.1029/98GL02810
- Rosenfeld, D., and I.M. Lensky. 1998. Satellite-based insights into precipitation formation processes in continental and maritime convective clouds. Am. Meteorol. Soc. 79:2457. doi:10.1175/1520-0477(1998)079
- Rosenfeld, D., U. Lohmann. B.R. Graciela, D.O. Colin, M. Kulmala, S. Fuzzi, A. Reissell, and O.A. Meinrat. 2008. Flood or drought: How do aerosols affect precipitation? Science 321:1309–13. doi:10.1126/science.1160606
- Schwartz, S.E., and A. Slingo. 1996. Enhanced shortwave cloud radiative forcing due to anthropogenic aerosols. In Cloud Chemistry and Climate, ed. by P.J. Crutzen and V. Ramanathan, 191–236. New York, NY: Springer.
- Sloan, C.S., and W.H. White. 1986. Visibility: An evolving issue. Environ. Sci. Technol. 20:760–66. doi:10.1021/es00150a600
- Small, J.D., P.Y. Chuang, G. Feingold, and H. Jiang, 2009: Can aerosol decrease cloud lifetime? Geophys. Res. Lett. 36:L16806. doi:10.1029/2009GL038888
- Stevens, B., and G. Feingold. 2009. Untangling aerosol effects on clouds and precipitation in a buffered system. Nature 461:607–13. doi:10.1038/nature08281
- Twomey, S. 1974. Pollution and the planetary albedo. Atmos. Environ. 8:1251–56. doi:10.1016/0004-6981(74)90004-3
- Twomey, S. 1977. The influence of pollution on the shortwave albedo of clouds. J. Atmos. Sci. 34:1149–52. doi:10.1175/1520-0469(1977)034
- van der Mensbrugghe, D. 2010. Climate change policy options for Asian economies: Findings from an integrated assessment model. Asian Econ. Policy Rev. 5(1):63–83. doi:10.1111/(ISSN)1748-3131
- van Vuuren, D.P., J. Edmonds, and M. Kainuma. 2011. Representative concentration pathways: An overview. Clim. Change 109:5–31. doi:10.1007/s10584-011-0148-z
- Warner, J., and S. Twomey. 1967. The production of cloud nuclei by cane fires and the effects on cloud droplet concentration. J. Atmos. Sci. 24:704–6. doi:10.1175/1520-0469(1967)024
- Warren, S.G., C.J. Hahn, J. London, R.M. Chervin, and R. Jenne. 1986. Global distribution of total cloud cover and cloud type amounts over land. NCAR tech. note TN-273 STR. 29pp.
- World Health Organization (WHO). 1994. Air pollution in the world’s megacities; Environment. 36. Geneva, Switzerland: United Nations Environment Programme.
- World Meteorological Organization (WMO). 1987. International Cloud Atlas, Vol. II. WMO No. 407. Geneva, Switzerland.
- World Meteorological Organization. 2008. Guide to meteorological instruments and methods of observation. WMO No. 8. Geneva, Switzerland.
- Zhao, B., S. Wang, J. Wang, J.S. Fu, T. Liu, J. Xu, X. Fu, and J. Hao. 2013. Impact of national NOx and SO2 control policies on particulate matter pollution in China. Atmos. Environ. 77:453–63. doi:10.1016/j.atmosenv.2013.05.012