
Abstract
The composition of exhaust emissions from nonroad engines and equipment varies based on a number of parameters, including engine type, emission control technology, fuel composition, and operating conditions. Speciated emissions data which characterize the chemical composition of these emissions are needed to develop chemical speciation profiles used for air quality modeling and to develop air toxics inventories. In this paper, we present results of an extensive review and analysis of available exhaust speciation data for total organic gases (TOG) for spark ignition (SI) engines running on gasoline/ethanol blends now in widespread use, and compression ignition (CI) engines running on diesel fuel. We identified two data sets best suited for development of exhaust speciation profiles. Neither of these data sets have previously been published. We analyzed the resulting speciation profiles for differences in SI engine exhaust composition between 2-stroke and 4-stroke engines using E0 (0% ethanol) and E10 (10% ethanol) blends, and differences in CI engine exhaust composition among engines meeting different emission standards. Exhaust speciation profiles were also analyzed to compare differences in maximum incremental reactivity (MIR) values; this is a useful indicator for evaluating how organic gases may affect ozone formation for air quality modeling. Our analyses found significant differences in speciated emissions from 2-stroke and 4-stroke SI engines, and between engines running on E0 and E10 fuels. We found significant differences in profiles from pre-Tier 1 CI engines, engines meeting Tier 1 standards, and engines meeting Tier 2 standards. Although data for nonroad CI engines meeting tier 4 standards with control devices such as particulate filters and selective catalyst reduction (SCR) devices were not available, data from highway CI engines suggest these technologies will substantially change profiles for nonroad CI engines as well (EPA, 2014c).
Implications: The nonroad engine data sets analyzed in this study will substantially improve exhaust speciation profiles used to characterize organic gas emissions from nonroad engines. Since nonroad engines are major contributors to ambient air pollution, these profiles can considerably improve U.S. emission inventories for gaseous air toxics emitted from nonroad engines. The speciation profiles developed in this paper can be used to develop more accurate emission inputs to chemical transport models, leading to more accurate air quality modeling.
Background
Non-highway-designated engines or equipment, also referred to as nonroad, make up a large portion of the mobile source volatile organic compound (VOC) emission inventory. Based on inventories developed for a recent U.S. Environmental Protection Agency (EPA) regulation (EPA, Citation2014a, Citation2014b), mobile sources (highway and nonroad) made up 36% of the VOC inventory in 2005, 47% of which was nonroad. Here, VOC is defined as total organic gas (TOG) minus the mass of methane, acetone, and ethane (EPA, Citation2014c). In the future, nonroad emissions are projected to become a larger portion of the mobile source emission inventory due to regulatory controls on light-duty (EPA, Citation2010, 2012, Citation2014b) and heavy-duty (EPA, Citation2011) on-road vehicles, as well as other factors such as increased emissions from goods movement. With current emission standards in place, mobile sources will make up 16% of the VOC inventory, with nonroad engines projected to account for 66% of this portion in 2030 (EPA, Citation2014a, Citation2014b).
Despite the current and expected contribution of the nonroad sector to pollutant inventories, speciated emissions of TOG and air toxic inventories developed using those speciated emissions are based on extremely limited data (EPA, Citation2005, Citation2014d). This is in contrast to the on-road sector, which has more well-characterized speciated emission data (EPA, Citation2008, Citation2013; Khalek et al., Citation2009). Our review found that many nonroad engine studies that have speciation data are for older technology engines, based on testing with fuels that are no longer representative of most of the market (Gabele, Citation1997; EPA, Citation2004; Volckens et al., Citation2008), or based on fuels that have never been widely used (Gordon et al., Citation2013; Margara-Gomez et al., Citation2012; Chai et al., Citation2013; Zhang and Balasubramanian, Citation2014). One federal test program reviewed did not have full speciation needed to develop exhaust gas speciation profiles (National Renewable Energy Laboratory [NREL] and Oak Ridge National Laboratory [ORNL], Citation2009). Our review concluded that the most suitable available data sets for recent-technology nonroad engines on representative fuels for the United States were from two test programs conducted by Southwest Research Institute (SwRI), under contract to the EPA. Despite the suitability of these speciated emission data sets, they have not been previously publicly available. These data sets were used to create engine exhaust speciation profiles and emission factors for a variety of nonroad spark-ignition (SI) engines (Carroll and Timmons, Citation2010) and compression-ignition (CI) engines (Starr, Citation2004a, Citation2004b).
Methods
Engines
Tests from seven small nonroad engines were used to create speciation profiles for 4-stroke engines without exhaust catalysts operated on E0 and E10 fuels (). These engines include two push mowers, two riding mowers, two generators, and a blower. Steady-state modal emission tests were performed using an engine dynamometer with speed conforming to Title 40 CFR 90 (Code of Federal Regulations, Citation1995a; Carroll and Timmons, Citation2010). Each type of equipment used different, weighted, steady-state engine operational modes for certification, listed in Table 18 of the SI test report (Carroll and Timmons, Citation2010). All engines were broken in for 8 hr on commercial premium nonoxygenated gasoline and moved through each mode every hour at a time according to its modal weighting factor. Since all engines were tested on both E0 and E10 fuels, impacts of fuel formulation could be isolated.
Table 1. Four-stroke nonroad spark-ignition test equipment and engines without exhaust catalysts.
Tests from four recreational equipment vehicles were used to create speciation profiles for 2-stroke engines without exhaust catalysts operating on E0 and E10 fuels (). These included two all-terrain vehicles (ATVs) and two nonroad motor cycles (NRMCs). Each recreational equipment vehicle was tested on a chassis dynamometer using the Urban Dynamometer Drive Schedule (UDDS) transient test cycle from Title 40 CFR, Part 86, Appendix I (Code of Federal Regulations, Citation1995b). The following preconditioning operations were performed (Carroll and Timmons, Citation2010):
The fuel tanks were drained and charged with the test fuel to half the tank capacity.
The vehicles were placed on the dynamometer and operated through one UDDS driving cycle.
The vehicles were then removed from the dynamometer, moved to the soak area, and parked. The vehicles remained in the soak area for 12–24 hr prior to each cold-start test at an ambient temperature of 72 ± 2 °F.
Table 2. Two-stroke nonroad spark-ignition recreational equipment engines without exhaust catalysts.
Two tests, not shown in , were excluded from the profiles due to incomplete data: a Briggs and Stratton walk behind mower test (indicated as 1-E10-759 in the test report) was missing seven low-weight paraffins and olefins, and a Honda walk behind mower test (2-E0-776) was missing all alcohol data.
Seven engines with older or no control technologies were used to create CI engine exhaust speciation profiles, including construction equipment and engines, a forklift truck, and an agricultural tractor (). These engines were tested using transient and steady-state cycles on an engine dynamometer. However only data from transient cycles were used to create the profiles because more data were available, and these cycles may better represent real-world conditions for the tested engines than steady-state cycles. Transient cycles used were the U.S. on-highway heavy-duty Federal Test Procedure (FTP) and nonroad backhoe loader duty cycle (BHL) in accordance with procedures outlined in Title 40 CFR, Part 86 (Code of Federal Regulations, Citation1995b) and the CI test reports, respectively (Starr, Citation2004a, Citation2004b). Prior to emission testing, engines were run over a preparatory target cycle, followed by a 20-min, engine-off soak period (Starr, Citation2004a, Citation2004b). After each test, a thorough fuel change procedure was completed by replacing fuel filters and operating the engine to purge the system of any previous fuel prior to emission testing on a different fuel (Starr, Citation2004a, Citation2004b).
Table 3. Nonroad compression-ignition test engines.
Fuels
Test fuels used with the SI engines included two E0 federal certification fuels, an EPA gasoline blend of E10 and four California Air Resources Board (ARB) fuels (two 7 psi Reid vapor pressure [RVP] E10 fuels, a 10 psi RVP E10 fuel, and an E0 blend). A brief description of the fuels and their properties is provided in . Nonoxygenated fuels were tested first and all remaining fuel in the system was drained, replaced with the next fuel, and then operated to flush out the previous fuel. Original equipment manufacturer (OEM) lubricating oils were used in the 2-stroke engines. Fuels used with the CI test programs were an emission certification test grade type 2D 390 ppm sulfur diesel fuel and a 2570 ppm high-sulfur nonroad type 2D diesel fuel. High-sulfur CI fuels used in the test program are not similar to current fuels, but high sulfur levels were not seen to interfere with TOG speciation in this study (described in the next section and in Table S.1). Fuel properties are described in .
Table 4. Spark-ignition test fuel properties.
Table 5. Compression-ignition test fuel properties.
Sampling and measurement
Exhaust samples were collected in bags according to the referenced test cycles above and analyzed for the presence of more than 200 different species, including C1–C12 hydrocarbons, aldehydes and ketones, and alcohols. C1–C12 species (including alcohols) were analyzed using four gas chromatography with a flame ionization detector (GC-FID) procedures similar to the Phase II Auto-Oil method (Fanick, Citation2005). Aldehydes and ketones were collected from the bag samples on cartridges packed with silica gel impregnated with 2,4-dinitrophenylhydrazine and a high-performance liquid chromatography procedure was used to analyze the collected aldehydes and ketones.
One complete emission test was performed with each test fuel with the SI engines and multiple emission tests were performed on each test fuel with the CI engines (one to two tests per fuel per FTP and BHL cycle; ). All engine exhaust emissions were measured using dilute exhaust test methodologies.
Profile development
A speciation profile composed of weight percents of TOG for every compound was created for each individual test by dividing each compound’s mass by the total mass of all the species. These individual test profiles for SI engines were averaged within their respective engine/fuel categories to obtain a composite profile representing that particular engine/fuel combination. Thus, composite profiles for 2-stroke engines running on E0 and E10 and 4-stroke engines on these fuels were developed. The number of tests for each SI composite profile are indicated in and . Toluene was highly variable across SI profiles. As a result of the high variability and limited sample set, toluene values were replaced with pre-Tier 2 emission standard (EPA, Citation2012) on-road gasoline vehicle profiles from SPECIATE4.4 profiles 8750a and 8751a (EPA, Citation2014d). Although emission test data from 2-stroke catalyzed engines were available, we were unable to use these tests to create speciation profiles due to many inconsistencies and abnormal values in the data. The composite exhaust speciation profiles for 2- and 4-stroke SI engines without exhaust catalysts on both E0 and E10 gasoline are provided in Supplemental Material (Table S.2).
Three composite profiles were developed from the nonroad CI engine test program (conducted prior to Tier 3 and Tier 4 standards) and are based on pre-Tier 1, Tier 1, and Tier 2 nonroad diesel emission control levels. Nonroad CI engine emission control standards are dependent upon rated power, pollutant, and model year; more information about the standards can be found on EPA’s Web site (EPA, Citation2014e). As with the SI engine data described above, individual test profiles were averaged within their respective emission control category to obtain a composite CI profile on diesel fuel, representing that particular control category under transient operating conditions. To increase the robustness of the composite profiles, the number of samples was doubled by including tests on both high- and low-sulfur fuel types after our analysis (Table S.1) found that speciated compounds were qualitatively similar between high- and low-sulfur fuel tests. After incorporating both high- and low-sulfur fuels, potential outliers were identified and addressed. The composite exhaust speciation profiles for CI engines are displayed in Supplemental Material (Table S.3). Supplemental Material also includes a discussion of how co-eluted and unknown species were addressed for all profiles.
Analysis
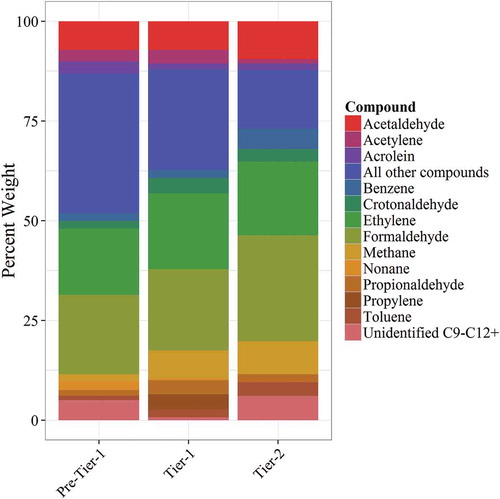
Comparisons of composite exhaust speciation profiles were made by broad chemical class ( and ) and by largest individual compounds contributing >1% of the TOG mass ( and ).
Figure 1. Comparison of spark-ignition profiles by compound class.
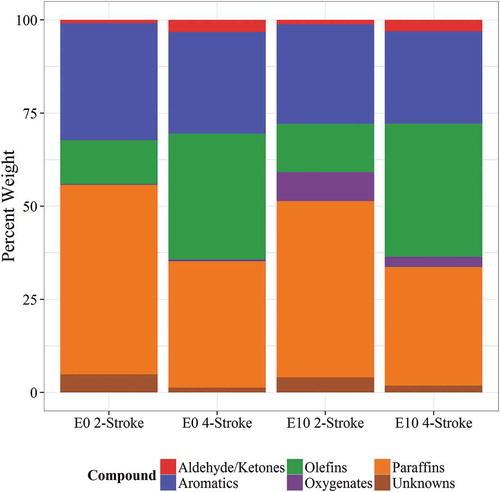
Figure 2. Compounds that are the largest contributors to spark-ignition profiles.
Figure 3. Comparison of compression-ignition profiles by compound class.
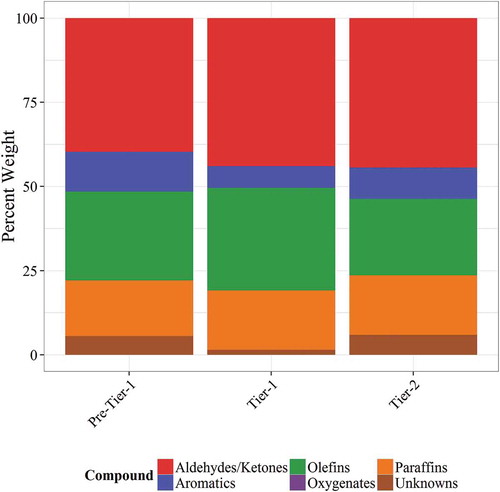
Figure 4. Compounds that are the largest contributors to compression-ignition profiles.
Differences between profiles were compared using a two-sample t-test assuming unequal variances. The tests for one compound in a profile were compared with the tests for the same compound in a different profile. Statistical comparisons between large contributors to SI and CI exhaust profiles are listed in and , respectively. Italicized p-values in the tables are statistically significant at a significance level of α = 0.05 (two-tailed p-value). For completeness, absolute emission rate levels of engine tests were compared and are displayed in Supplemental Material (Figures S.1, S.2, and S.3).
Table 6. Comparison of large contributors among spark-ignition profiles.
Table 7. Comparison of large contributors to compression-ignition engine profiles among engine control tiers.
In addition, exhaust speciation profiles were analyzed to compare differences in maximum incremental reactivity (MIR) of ozone (Carter, Citation2011). Each profile percent weight was multiplied by its respective MIR for ozone, and the resulting value was summed to obtain a total reactivity for that profile. Species unmatched to MIRs (including unknowns and a small number of other organic gases) were included by assigning them an MIR equal to the average MIR of the profile.
Results and Discussion
Spark-ignition engines
Composition by compound class () was similar between E0 and E10 fuels, with the exception of oxygenates (ethanol) showing up in the exhaust of E10 fuel. For 4-stroke engines, differences between chemicals in the two blends were not statistically significant (p-value < 0.05) except for ethanol, 2,4-dimethylpentane, benzene, and m- and p-xylene (). For 2-stroke engines, E0 and E10 emission tests were statistically different for 18 compounds, including ethanol, acetaldehyde, xylenes, and ethylbenzene. Increases in acetaldehyde and ethanol are expected with E10 fuel (EPA, Citation2013), and this is confirmed in 2-stroke engines, as the weight percentage of acetaldehyde more than doubles with E10 fuel and is statistically different (p-value = 0.004). In 4-stroke engines, this is confirmed with marginal statistical significance (p-value = 0.053) and strong statistical significance (p-value < 0.001) for acetaldehyde and ethanol, respectively. The marginal p-value for acetaldehyde is likely due to the limited sample size and weak statistical power to observe differences. In the SI engine profiles, the compounds that account for the greatest percentage of total mass emission were isopentane, 2,2,4-trimethylpentene, m- and p-xylene, and ethanol. Weight percentages of total mass emissions of these compounds were all statistically different between 2-stroke E0 and E10 profiles. Between the 4-stroke E0 and E10 profiles, benzene and m- and p-xylene were statistically different.
Potential reasons for the greater difference between E0 and E10 in 2-stroke engines compared with 4-stroke engines may be related to the large technology differences between the engine types. Moreover, the 2-stroke engines used in this study were not optimized to run on E10 fuel. In general, as ethanol in fuel increases, higher combustion temperatures and thus higher component temperatures will occur in engines that are not optimized for higher ethanol blends (NREL and OREL, Citation2009). High exhaust port temperatures and repeated engine failures with higher ethanol blends could cause the engines to exhaust more hydrocarbons over the duration of a test program (NREL and OREL, Citation2009). Fuel differences, such as a lower percentage of aromatics in the E10 fuels (), and the use of different test cycles, may also influence differences seen in the 2-stroke exhaust results.
SI engines were also compared by stroke engine type. Four-stroke engine exhaust was statistically different from 2-stroke engine exhaust for almost all of the largest contributors to each profile across fuel types (). Overall, 4-stroke SI engines had a higher percentage of olefins than 2-stroke engines (mostly due to higher propylene, ethylene, and acetylene) and also had much higher methane, likely due to incomplete combustion. Two-stroke engines had a higher percentage of paraffins mostly due to higher 2,2,4-trimethylpentane, 2-methylbutane, and 2-methylhexane. This is likely due to the increased contribution of unburned fuels that occurs with 2-stroke engine design. Two-stroke engines also had a higher percentage of unknowns, which is likely due to high-molecular-weight compounds from the unburned lubricating oil in the exhaust.
shows the VOCs with the highest contribution to SI engine exhaust speciation profiles. Consistent with comparisons by chemical class, the composition of these top compounds varied more between 2-stroke and 4-stroke engines than between fuel types. Methane, acetylene, ethylene, and toluene were the largest contributors to the 4-stroke profiles. 2-Methylbutane, 2,2,4-trimethylpentane, toluene, and ethanol were the largest contributors to the 2-stroke profiles. Of interest, the percentage of ethanol in the E10 2-stroke exhaust profile was 7.63%, which is close to the percentage of ethanol in the fuel. The high percentage of ethanol in 2-stroke exhaust suggests that a high percentage of fuel remained unburned.
We also compared the SI profiles with the pre-Tier 2 highway gasoline vehicle E0 (8750a) and E10 (8751a) profiles used in SPECIATE4.4 (Figures S.4 and S.5). Due to the 2-stroke engine qualities mentioned above, it was not surprising that the gasoline highway vehicle E0 and E10 profiles were better correlated with the 4-stroke nonroad E0 (R2 = 0.757, 95% confidence interval [CI] of the slope: 0.98, 1.22) and E10 (R2 = 0.748, 95% CI of the slope: 0.97, 1.21) profiles than the 2-stroke nonroad E0 (R2 = 0.399, 95% CI of the slope: 0.44, 0.70) and E10 (R2 = 0.282, 95% CI: 0.37, 0.68) profiles. An explanation of the computation of the correlations and slopes used to compare profiles is provided in Supplemental Material.
The differences in composition of the 2-stroke and 4-stroke engine exhaust speciation profiles are expected because in 2-stroke engines, lubricating oil (less combustible than gasoline) is mixed with the gasoline, substantially impacting the emissions profile (Manufacturers of Emission Controls Association [MECA], Citation2009). Additionally, as previously mentioned, in 2-stroke engines some of the fresh oil-gas mixture passes directly to the exhaust without being combusted, which contributes to high VOC emissions from 2-stroke engines (Heywood, Citation1988; MECA, Citation2009). It should also be noted that organic compounds (e.g., cycloalkanes, long-chain alkanes) that constitute unburned lubricating oil have low volatilities and contribute to semivolatile organic compound measurements and/or primary organic aerosol emissions, rather than VOC measurements analyzed in this report (Worton et al., Citation2014).
Finally, total MIRs of each profile are displayed in . Reactivity between ethanol blends differed more for 4-stroke engines (7.6–8.2% difference) than 2-stroke engines (2.3% difference) despite fewer statistically significant differences in chemical composition, supporting the use of different profiles for E0 and E10 fuels due to their impacts on air quality modeling. Reactivity differences between on-road and nonroad gasoline profiles were the most pronounced between the 4-stroke E10 profile and on-road gasoline E10 profile (11.6% difference), supporting the use of nonroad specific SI profiles due to their impacts on air quality.
Table 8. Total MIRs of ozone to compare reactivity between speciation profiles.
Compression-ignition engines
Speciation of diesel engines was compared across engine control tier. These comparisons were made by compound class () and by the largest contributors to the CI engine exhaust speciation profiles (). Among compound classes, aldehydes and ketones (39.7–46.6%) made up a larger percentage of the CI engine exhaust speciation profiles than the SI engine exhaust speciation profiles. Formaldehyde (19.9–26.6%) and ethylene (16.7–18.9%) made up a large percentage of the CI engine exhaust speciation profiles. Formaldehyde increased going from pre-Tier 1 to Tier 2. Other large contributors include acetaldehyde, methane, and acetylene. Statistical comparisons between engine control tiers were carried out for the largest contributors, and we found many compounds to be statistically different between profiles (). Although all the CI profiles have specific compounds that differ, the profiles that appear to be the most different from one another are the pre-Tier 1 and Tier 2 profiles (slope = 1.25, 95% CI of the slope: 1.10, 1.39) and the Tier 1 and Tier 2 profiles (slope = 1.15, 95% CI of the slope: 1.01, 1.28).
In the CI engine profiles, the compounds that account for the greatest percentage of total mass emissions were methane, ethylene, benzene, formaldehyde, and acetaldehyde. Between pre-Tier 1 to Tier 2 and Tier 1 to Tier 2 profiles, of these five major species benzene, formaldehyde, and acetaldehyde were statistically significant. However, between pre-Tier 1 to Tier 1 profiles, of these five major species only ethylene is statistically different. We also examined differences between Tier 1 engines above and below 50 horsepower, but outside of methane, no statistical difference between the largest contributing compounds was observed. As a result, all Tier 1 engines were grouped together regardless of horsepower.
The developed CI profiles were also compared with the current on-road pre-2007 heavy-duty diesel profile (8774). The developed profiles had significantly different slopes (further discussed in Supplemental Material) and had varying correlations to 8774 (Figure S.6). Finally, despite compositional differences, reactivity between CI engine control tiers was similar (). However, reactivity between on-road and nonroad CI engine profiles was not similar (8.2–11.3% difference), supporting the use of nonroad specific CI profiles due to their impacts on air quality.
Summary
Unpublished data from two test programs were analyzed and used to develop speciation profiles for use in air quality modeling and air toxic inventories. Two-stroke exhaust profiles were statistically different from 4-stroke exhaust profiles as well as profiles currently used for highway gasoline vehicles. In addition, the 2-stroke engine profiles exhibited a greater change in ethanol than the 4-stroke engine profiles, presumably because of the larger percentage of unburned fuel passing through the 2-stroke engine exhaust, which is not optimized to run on E10. The difference between 2-stroke and 4-stroke engines and E0 and E10 fuel provides evidence that using separate profiles for these engines is critical. The CI profiles developed were different from on-road pre-2007 diesel engine profiles and among engine control tiers. These results support the need to use the updated profiles developed in this study in future modeling efforts.
Limitations and data needs
Organic gas exhaust chemical speciation is resource intensive and rarely conducted on nonroad engines or equipment. As a result, only a limited number of test programs have included full exhaust speciation. The data selected for in-depth analysis in this study are limited by sample size; thus, statistical analysis in this paper has limited statistical power. Data cited in this paper are limited by a low number of tests, and future test programs could include repeat tests and additional engines to bolster the accuracy of the data. The lack of data on diesel engines with varying power ratings within a control tier may have resulted in engine size difference as a confounding factor in the results.
The age and type of lubricating oil may have an influence on exhaust emissions in the 2-stroke engine profiles; however, detailed information on the lubricating oils used in the SI study was unavailable.
There are many other types of engines and equipment that constitute the nonroad fleet that are not captured with the SI and CI test programs, such as outboard and stern-drive marine engines, SI engines with catalytic converters, CI engines meeting Tier 3 and 4 EPA standards, engines running on liquified petroleum gas, and compressed natural gas engines. Inventory projections suggest nonroad engines will become a larger contributor to the overall air toxics inventory in future years, due to control programs for on-road vehicles and point sources. Thus, robust detailed emissions characterization will become more important, and more speciation should be considered for future test programs.
Funding
This work was supported in part by an appointment to the ORISE participant research program support by an interagency agreement between EPA and the Department of Energy. This paper may not necessarily reflect the views of EPA and no official endorsement should be inferred.
Supplemental Material
Supplemental data for this article can be accessed on the publisher’s website.
Supplement
Download PDF (955.7 KB)Acknowledgment
The authors thank Cheryl Caffery, Kent Helmer, Marion Hoyer, Joseph McDonald, James Warila, and Margaret Zawacki of the EPA and James Carroll and Suzanne Timmons of Southwest Research Institute.
Additional information
Notes on contributors
Lawrence J. Reichle
Lawrence Reichle is an ORISE participant hosted by the EPA’s Office of Transportation and Air Quality.
Rich Cook
Rick Cook and Catherine A. Yanca are environmental scientists and Darrell B. Sonntag is an engineer at the National Vehicle Fuel Emissions Laboratory (NVFEL) in Ann Arbor, MI.
Catherine A. Yanca
Rick Cook and Catherine A. Yanca are environmental scientists and Darrell B. Sonntag is an engineer at the National Vehicle Fuel Emissions Laboratory (NVFEL) in Ann Arbor, MI.
Darrell B. Sonntag
Rick Cook and Catherine A. Yanca are environmental scientists and Darrell B. Sonntag is an engineer at the National Vehicle Fuel Emissions Laboratory (NVFEL) in Ann Arbor, MI.
References
- Carroll, J.N., and S.A. Timmons. 2010. Broad Emissions Testing Support for In-Use Vehicles and Engines. US EPA Contract EP-C-07-028, Work Assignments 1-07, 2-07, and 3-07. EPA-420-R-14-029.
- Carter, W.P.L. 2011. Development of the SAPRC-07 Chemical Mechanism and Updated Ozone Reactivity Scales. Table B-1. http://www.engr.ucr.edu/~carter/SAPRC/ (accessed December 8, 2014).
- Chai, M., M. Lu, F. Liang, A. Tzillah, N. Dendramis, and L. Watson. 2013. The use of biodiesel blends on a non-road generator and its impacts on ozone formation potentials based on carbonyl emissions. J. Environ. Pollut. 178:159–165. doi:10.1016/j.envpol.2013.03.021
- Code of Federal Regulations 90. 1995a. Code of Federal Regulations Title 40 Protection of the Environment.
- Code of Federal Regulations 86. 1995b. Code of Federal Regulations Title 40 Protection of the Environment.
- Gabele, P. 1997. Exhaust emissions from four-stroke lawn mower engines. J. Air Waste Manage. Assoc. 47:945–952. doi:10.1080/10473289.1997.10463951
- Fanick, R.E. 2005. Diesel Exhaust Standard—Phase II: CRC Project No. AVFL-10b. Final Report. Prepared for Coordinating Research Council, Inc. Project No. 03.10410.
- Gordon, T.D., D.S. Tkacik, A.A. Presto, M. Zhang, S.H. Jathar, N.T. Nguyen, J. Massetti, T. Truong, P. Cicero-Fernandez, C. Maddox, P. Rieger, S. Chattopadhyay, H. Maldonado, M.M. Maricq, and A.L. Robinson. 2013. Primary gas- and particle-phase emissions and secondary organic aerosol production from gasoline and diesel off-road engines. Environ. Sci. Technol. 47:14137–14146. doi:10.1021/es403556e
- Heywood, J.B. 1988. Internal Combustion Engine Fundamentals, 23. New York: McGraw-Hill.
- Khalek, I., T. Bougher, and P.M. Merritt. 2009. Phase 1 of the Advanced Collaborative Emissions Study. Prepared by Southwest Research Institute for the Coordinating Research Council and the Health Effects Institute.
- Margara-Gomez, K.T., M.R. Olson, T. Okuda, and K.A. Walz. 2012. Sensitivity of hazardous air pollutant emissions to the combustion of blends of petroleum diesel and biodiesel fuel. Atmos. Environ. 50:307–313. doi:10.1016/j.atmosenv.2011.12.007
- Manufacturers of Emission Controls Association (MECA). 2009. Emission Control of Small Spark-Ignited Off-Road Engines and Equipment. http://www.meca.org/galleries/files/sore_white_paper_0109_final.pdf (accessed December 8, 2014).
- National Renewable Energy Laboratory (NREL) and Oak Ridge National Laboratory (ORNL). 2009. Effects of Intermediate Ethanol Blends on Legacy Vehicles and Small Non-Road Engines, Report 1. NREL/TP-540-43543. ORNL/TM-2008/117. Golden, CO: National Renewable Energy Laboratory.
- Starr, M. 2004a. Air Toxic Emission from In-Use Nonroad Diesel Equipment. US EPA Contract 68-C-98-158, Work Assignment 3–04.
- Starr, M. 2004b. Nonroad Duty Cycle Testing For Toxic Emissions. US EPA Contract 68-C-98-158, Work Assignment 3–05.
- U.S. Environmental Protection Agency. 2004. Characterization of Emissions from Small, Hand-Held, In-Use 2-Cycle Engines. EPA/600/X-04-191. Washington, DC: U.S. Environmental Protection Agency.
- U.S. Environmental Protection Agency. 2005. EPA’s National Inventory Model (NMIM), A Consolidated Emissions Modeling System for Mobile6 and NONROAD. http://www.epa.gov/otaq/models/nmim/420r05024.pdf (accessed December 8, 2014).
- U.S. Environmental Protection Agency. 2008. Kansas City PM Characterization Study: Final Report. EPA420-R-08-009. Ann Arbor, MI: Assessment and Standards Division, Office of Transportation and Air Quality. http://www.epa.gov/oms/emission-factors-research/420r08009.pdf (accessed December 1, 2014).
- U.S. Environmental Protection Agency. 2010, 2012. Model Years 2012–2016 and 2017–2025 Light-Duty Vehicle Greenhouse Gas Emissions Standards and Corporate Average Fuel Economy Standards. http://www.epa.gov/otaq/climate/regs-light-duty.htm (accessed December 1, 2014).
- U.S. Environmental Protection Agency. 2011. Greenhouse Gas Emissions Standards and Fuel Efficiency Standards for Medium- and Heavy-Duty Engines and Vehicles http://www.epa.gov/otaq/climate/regs-heavy-duty.htm (accessed December 1, 2014).
- U.S. Environmental Protection Agency. 2012. Light-Duty Vehicle, Light-Duty Truck, and Medium-Duty Passenger Vehicle—Tier 2 Exhaust Emission Standards. http://www.epa.gov/otaq/standards/light-duty/tier2stds.htm (accessed December 5, 2014).
- U.S. Environmental Protection Agency. 2013. Assessing the Effect of Five Gasoline Properties on Exhaust Emissions from Light-Duty Vehicles certified to Tier-2 Standards: Analysis of Data from EPAct Phase 3 (EPAct/V2/E-89). Final Report. EPA-420-R-13-002. Ann Arbor, MI: Assessment and Standards Division, Office of Transportation and Air Quality, April 2013.
- U.S. Environmental Protection Agency. 2014a. Motor Vehicle Emission Simulator. http://www.epa.gov/otaq/models/moves/ (accessed December 1, 2014).
- U.S. Environmental Protection Agency. 2014b. Tier 3 Vehicle Emission and Fuel Standards Program. http://www.epa.gov/otaq/tier3.htm (accessed December 1, 2014).
- U.S. Environmental Protection Agency. 2014c. Speciation of Total Organic Gas and Particulate Matter Emissions from On-road Vehicles in MOVES2014. http://www.epa.gov/otaq/models/moves/documents/420r14020.pdf (accessed December 11, 2014).
- U.S. Environmental Protection Agency. 2014d. SPECIATE version 4.4. http://www.epa.gov/ttn/chief/software/speciate/index.html (accessed December 1, 2014).
- U.S. Environmental Protection Agency. 2014e. Nonroad Compression-Ignition Engines—Exhaust Emission Standards. http://www.epa.gov/otaq/standards/nonroad/nonroadci.htm (accessed December 1, 2014).
- Volckens, J., D.A. Olson, and M.D. Hays. 2008 Carbonaceous species emitted from handheld two-stroke engines. Atmos. Environ. 42:1239–1248. doi:10.1016/j.atmosenv.2007.10.032
- Worton, D.R., G. Isaacman, D.R. Gentner, T.R. Dallmann, W.H. Chan, C. Ruehl, T.W. Kirchstetter, K.R. Wilson, R.A. Harley, and A.H. Goldstein. 2014. Lubricating oil dominates primary organic aerosol emissions from motor vehicles. Environ. Sci. Technol. 48:3698–3706. doi:10.1021/es405375j
- Zhang, Z.H., and R. Balasubramanian. 2014. Influence of butanol-diesel blends on particulate emissions of a non-road diesel engine. J. Fuel. 11:130–136. doi:10.1016/j.fuel.2013.10.059