
Abstract
Estimates of emissions for processes and point sources at petroleum refineries and chemical plants provide the foundation for many other environmental evaluations and policy decisions. The most commonly used method, based on emission factors, results in unreliable estimates. More information regarding the actual emissions within a facility is necessary to provide a foundation for improving emission factors and prioritizing which emission factors most need improvement. Identification of which emission factors both perform poorly and introduce the largest error is needed to provide such a prioritization. To address this need, benzene and volatile organic compound (VOC) emissions within a major chemical plant/refinery were measured and compared with emission factor estimates. The results of this study indicate estimated emissions were never higher and commonly lower than the measured emissions. At one source location, VOC emissions were found to be largely representative of those measured (i.e., the catalytic reformer), but more often, emissions were significantly underestimated (e.g., up to 448 times greater than estimated at a floating roof tank). The sources with both the largest relative error between the estimate and the measurement and the largest magnitude of emissions in this study were a wastewater treatment process, an aromatics concentration unit and benzene extraction unit process area, and two sets of tanks (sets 7 and 8). Emission factors for these sources are priorities for further evaluation and improvement in this chemical plant/refinery. This study presents empirical data that demonstrate the need to validate and improve emission factors. Emission factors needing improvement are prioritized by identifying those that are weak models and introduce the largest error in magnitude of emissions. The results can also be used to prioritize evaluations of the emissions sources and controls, and any operational conditions or erroneous assumptions that may be contributing to the error.
Implications: Emissions measured at processes and point sources at a major petrochemical plant complex were compared to emission factor estimates. The results of this study indicate estimated emissions were never higher and commonly lower than the measured emissions. The comparison was used to prioritize emission factors needing improvement by identifying those that were weak representations and that introduce the largest error in emissions. The results can also be used to prioritize evaluations of the emissions sources and controls, and any operational conditions or erroneous assumptions that may be contributing to the error.
Introduction
Emission estimation methods for specific processes and point sources (Environmental Protection Agency [EPA], Citation1995) provide the foundation for many environmental evaluations and policy decisions. These estimates have many uses, including support for permit decisions and evaluation of the efficacy of control technologies. They also provide the input data for modeling of criteria pollutant emissions and estimating emissions impacts on public health. The current method of estimating source emissions is largely through the use of emission factors. Emission factors relate readily available process information, such as throughput, to mass emission rates using physical and/or chemical characteristics of the substances being stored or processed, with consideration for the characteristics of equipment and the efficiency of emissions controls, if present. The emission factor estimate is a simple proxy for a complicated process with multiple variables. Emissions factors are used in lieu of measured data because it is too expensive to measure everything all the time. However, the results of this project indicate there is clearly a need to periodically go through a process to evaluate the emissions estimates in use. According to a report by the Environmental Protection Agency (EPA) Inspector General, the emission factor method results in a large degree of error and many emissions factors are unreliable. Misuse of emissions factors resulted in significant underestimates of actual emissions from major industry sectors, including petroleum refining. Therefore, the Inspector General recommended improved management of emissions factor usage. The report recommendations included improving the planning and prioritization of emissions data collection, as well as improving emissions factor guidance and increasing the funding for EPA’s emissions factor program (EPA, Citation2006b). This error identified by the EPA Inspector General directly propagates through to other evaluations or decisions relying upon these results.
Measurements of emissions are needed to assess the accuracy and quantify the uncertainty of the emissions estimates derived from use of emission factors. When the uncertainty is expressed in terms of relative error, it provides an indication of how close an estimate is to the magnitude of the measured value. This error value may be used in conjunction with the emission estimate creating the largest under- or overestimation error (i.e., pounds per hour [lb/hr] underestimated) to prioritize which emission factors, when refined, would be most beneficial.
This paper presents a case in point, in which emissions of benzene and other volatile organic compounds (VOC) from sources at a combined petroleum refinery and chemical plant complex were measured using Differential Absorption Light Detection and Ranging (DIAL). Subsequently, these measured emissions were compared with emission factors for specific processes. The complex represents one plant and focuses on the units in that plant that already have high emissions as identified in a prescreening process.
The DIAL method has been used to measure mass flux of benzene and VOC from refineries and other benzene sources in Canada and Europe, and has recently been applied in the United States. The results from the use of DIAL in Canada and Europe indicate measured VOC emission rates were 5 to 20 times higher than reported by the same refineries using standard emission factors and estimating techniques (Cuclis, Citation2012; Frisch, Citation2003; Robinson et al., Citation2011; Chambers, Citation2006; Chambers et al., Citation2006; Chambers et al., Citation2008; Moncrieff, Citation2007; Ramsey and Hashmonay, Citation2009; Chereisinoff and Rosenfeld, Citation2009). Although this project did include other measurement technologies that in many instances confirmed data used for the DIAL-based emission rate estimates, the plume locations and scan planes dictated by wind directions, and space limitations at the site precluded using much of the data from these other measurement technologies to directly validate DIAL-based data, except as noted in Innocenti et al. (Citation2010), where Differential Optical Absorption Spectroscopy (DOAS) benzene measurements agreed well with DIAL benzene measurements. This paper focuses only on the DIAL measurements. Details of the other results of other methods and how they compare with the DIAL results are outlined in (Raun and Hoyt, Citation2011).
Study site
The subject 1,500-acre site (Shell, Citation2014a), located on the Houston Ship Channel (HSC) in Houston, TX, includes a refinery with an atmospheric crude oil distillation capacity of 340,000 barrels per day (U.S. Department of Energy, Citation2013), and integrated chemical manufacturing facilities that produce approximately 8,000 tons of chemicals and petrochemicals per day (EPA, Citation2013). The site produces a variety of fuels, including gasoline, diesel, jet fuel, and petroleum coke, and a variety of base chemicals, including ethylene, propylene, butylene, isoprene, butadiene, benzene, toluene, xylene, phenol, acetone, and cumene (Shell, Citation2014b).
The study site is one of the largest petrochemical complexes in the world, situated in an ozone nonattainment area among many other large petrochemical complexes, which makes predicting emissions in this area particularly difficult. Stationary source emission estimates in the area are fraught with uncertainty. Air quality studies conducted beginning in 2000 (Cowling et al., Citation2007; Allen et al., Citation2003; Johansson et al., Citation2014; Karl et al., Citation2003; Parrish et al., Citation2009; Mellqvist et al., Citation2010; Washenfelder et al., Citation2010; Wert et al., Citation2003; Ryerson et al., Citation2003; Cuclis, Citation2012) have measured ambient VOC concentrations in the vicinity of this site and similar sites at levels as much as one to two orders of magnitude greater than the levels predicted by modeling the reported emissions inventory estimates (Cuclis, Citation2012). The emission inventory estimates indicate that Harris County, where the site is located, was exposed in 2012 to more than 11 million lb of hazardous air pollutants, including 327,275 lb of benzene (EPA, Citation2012). In addition, local researchers and the EPA National-Scale Air Toxics Assessment (NATA) indicate that ambient air concentrations of benzene exceed acceptable health levels in the area (EPA, Citation2014). Given the potential public health risks, it’s important to accurately characterize emissions here and at other sites. The complicated mix of multiple petrochemical complexes each consisting of many point sources highlights the need for accuracy and identification of unknown/underestimated emission sources to effectively prioritize emission reduction measures and protect public health. The DIAL study was conducted by the City of Houston Bureau of Pollution Control and Prevention and the EPA in collaboration with site management. Representatives of the site provided the emission factor estimates for comparison with the DIAL measurements and reviewed the report from the study. This paper focuses on presenting a methodology to evaluate the effectiveness of the use of emission factors based on data taken at the site and provided in the report. The site management was provided a copy of the paper.
Differential absorption light detection and ranging
DIAL, the measurement method used, is a laser-based remote monitoring technique that enables range-resolved concentration measurements to be made of a wide span of atmospheric species. While other measurement methods were available, DIAL was selected for this study for a variety of reasons. DIAL was selected because of its long history dating back more than 30 years in Europe that demonstrates it is a reliable way to measure emissions, especially from a wide-area emissions source. DIAL allows for upwind and downwind measurements, in certain circumstances without even moving the measurement apparatus. DIAL measures the pollutants of interest, namely, VOC and benzene, which are particularly relevant for the selected site. DIAL does not require retro-reflectors, which are cumbersome and would need to be moved around the site and elevated above ground level to ensure that all emissions are measured. And lastly, DIAL does not require controlled releases to estimate emission rates.
In the DIAL technique, the laser is operated alternately at two adjacent wavelengths. One of these, the “on-resonant wavelength,” is chosen to be at a wavelength that is absorbed by the target species. The other, the “off-resonant wavelength,” is chosen to be at a wavelength that is not absorbed significantly by the target species, and is not interfered with by other atmospheric constituents. Pairs of on- and off-resonant signals are then acquired and averaged separately until the required signal-to-noise ratio is achieved. The range-resolved concentration is derived by differentiating the path-integrated concentration along the line-of-sight, averaged over the spatial resolution (typically in increments of 3.75 m). This technique provides the concentration gradient across a plane. For a detailed description of the technique refer to Robinson et al. (Citation2011), and for general validation and verification of DIAL results refer to Smithers et al. (Citation1995), the Chief Engineer’s Office of the Texas Commission on Environmental Quality (Citation2010), Spectrasyne (Citation2007), and Ramsey and Hashmonay (Citation2009).
Methods
DIAL was used to measure emissions of alkane VOCs and benzene from various industrial areas. A detailed accounting of this DIAL campaign measurements and related assumptions and calculations is available at Innocenti et al. (Citation2010). The DIAL service provider helped identify the likely sources. Our analyses were rigorous in an attempt to identify only the most likely sources, conservatively including data that is likely biased low, excluding data that could be considered to be extreme outliers, and correcting emissions estimates based on upwind measured emissions. Wind speed and direction shifts may have caused the plume size and location to change, causing the scan plane to potentially miss some of the plume or the entire plume. This can bias the measurements low. When we identified wind conditions, or plume elevations that may have caused some or the entire plume to be missed, we conservatively kept those data in the analysis. A description of the emission points and the chemical emissions measured at each one is provided in . These areas were targeted after an initial screening of the entire site indicated that these locations had the most significant emissions. Measurements of these emission points that would be evaluated by this study were then conducted multiple times within 6- to 8-hr periods.
Table 1. Industrial areas targeted for DIAL measurements of alkane VOC and benzene emissions and their descriptions.
Measurements occurred along a vertical plane, perpendicular to the predominant wind direction and downwind from the source(s) of interest. This provided spatial plume attributes including either alkane VOC or benzene concentrations along the plane. Benzene and VOC emissions rates were estimated by integrating DIAL measured concentrations along the vertical plane with the wind data. Wind speed attributes were measured primarily with a fixed mast in an open field adjacent to the site at elevations of 3 and 11 m. Wind direction attributes were primarily based on the wind direction measurements made at an elevation of 12 m at the DIAL unit. If the wind direction and speed data were determined to be not representative of the winds at the location of the plume measurements because of wind obstructions, the most representative wind data were used, including consideration of wind data collected at the DIAL unit (12 m elevation) or by a portable 2-m mast placed along the DIAL line of site.
Table 2. Summary statistics of measured benzene emissions by emission location (lb/hr).
Typically the DIAL can distinguish sources by measuring along a line of site upwind and downwind. One of the issues inside a dense structured refinery is obstruction to the line of sight. In order to confirm the source locations, the DIAL was moved to different locations as wind directions changed. The DIAL configuration used during this study does not accommodate taking upwind measurements simultaneously with downwind measurements, which would be ideal. The limited resources associated with this project required careful selection of locations where repeat measurements were conducted. As a result, the ratio of upwind to downwind scans may be small, especially if both the upwind and downwind sides of a source cannot be scanned from the same location.
DIAL VOC measurements were based on the spectral characteristics of carbon–hydrogen (C-H) bonds associated with alkane hydrocarbons with three or more carbons. The alkane C-H bond measurements were used to estimate a mass concentration based on an assumed molecular mass and optical absorption coefficient of the measured species.
Each day of DIAL VOC measurements also included pumped Perkin Elmer Automatic Thermal Desorption (ATD) tube samples, collected where DIAL and photoionization detector monitoring indicated the plume was located. The ATD samples were analyzed by gas chromatography and mass spectrometric or flame ionization detector methods. The ATD sample results and the molecular mass and optical absorption coefficient of each component in the samples were used to calculate an average molecular mass (75.1 ± 10.1) and an average optical absorption coefficient (1.23 ± 0.31 (ppm km)−1) for the entire VOC monitoring campaign. The calculated averages compared well to the vapor molecular mass and absorption coefficient for gasoline (73.3 and 1.47, respectively), indicating that the use of the gasoline absorption coefficient and molecular mass for the VOC emissions calculations was appropriate.
The DIAL measurements were validated for alkane VOC using an inline gas calibration cell audit, where the calibration cell was filled with a specific concentration of propane, unknown to the DIAL team. The DIAL team then estimated the propane concentration using the DIAL equipment. DIAL measurements of benzene were validated using simultaneous ultraviolet differential optical absorption spectroscopy (UV DOAS) measurements along a similar linear path common to both the DIAL and UV DOAS measurements (Innocenti et al., Citation2010).
Emissions measurements that appeared anomalous were differentiated from routine emissions via interpretation of the DIAL emission results in comparison to process/management details supplied by site representatives. Important process/management details provided by the site representatives that correlated with elevated emissions rates included tank filling, equipment malfunctions, and maintenance activities. Both the routine and anomalous emissions provide important information.
The measured concentrations were converted by calculation to mass rates, which were then compared to emissions calculated using EPA-approved emission factors. The emission factor emission estimates were calculated by engineers at the site. Where multiple emissions factor estimates are calculated for a single tank or process area because of varying temperatures and/or throughput data, only the emissions factor estimate with the highest emissions rate is used for the comparison with the DIAL measured emissions.
Process area emissions factor estimates include the sum of all sources in the area (e.g., tanks, flares, fugitive emissions, cooling water tower), and used the approved EPA methodologies and the monthly average ambient temperature for the month when the DIAL measurements were made. Emissions from tanks in the process areas were calculated using EPA’s Tanks 4.0. Emissions from flares relied on measured flow and composition of waste gas routed to the flare during the DIAL measurements, assuming a 98% combustion efficiency. Fugitive emissions were estimated using leak monitoring data recorded with data-logging software. Cooling water tower emissions were based on measured inlet and outlet cooling water concentration data. Wastewater emissions factor estimates were calculated with factors from EPA-approved wastewater protocols that consider the physical characteristics of the equipment, flow rates, temperatures, and composition data.
The emissions factor estimate for each tank set is a sum of the individual estimates of each tank in the set. The emissions factor estimates for each tank used EPA’s Tanks 4.0 method, including actual physical characteristics, storage temperatures, and movement data for the tanks. Vapor pressure estimates were based on each tank’s maximum actual storage temperature for each period of DIAL measurements, and external solar absorption factors were obtained from EPA’s Tanks 4.0. Fixed roof tank emissions factors estimates accounted for breathing losses and, except for one fixed roof tank that was static, working losses. Floating roof tank emissions estimates accounted for rim seal losses, deck fitting losses, deck seam losses (where applicable), and, except for one floating roof tank that was static, withdrawal losses.
Summary statistics of the measured emissions were calculated at each emission location. EPA ProUCL software version 4.1 (EPA, Citation2010) was used to evaluate the sample distribution shape and the associated 95th percentile upper confidence limit (UCL) of the mean. The emission factor estimates were statistically compared with the measured emissions to test the null hypothesis that the measured emissions were equal to or less than the emission factor derived emission estimate. The comparison was conducted using either a one-sample t-test if the data were considered normally distributed or the nonparametric Wilcoxon signed rank test for other distributional shapes.
Next, the underestimation error and relative error between the DIAL measurements and the estimate from the emission factor were calculated. The relative error provides a measure the representativeness of the estimate (eq 1) and the bulk error indicates the magnitude of underestimated emissions (eq 2). The measured emissions are represented with the 95th percentile upper confidence limit (UCL) of the mean.
The two errors for each emission location were graphically assessed to prioritize those emission factors most in need of further evaluation. Finally, the measured average total emission rate of VOC and benzene combined was compared with the estimate reported to the emission inventory for this facility for year 2010 (Texas Commission on Environmental Quality [TCEQ], Citation2014).
Results and Discussion
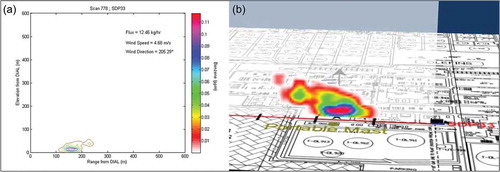
and provide examples of DIAL emission scan measurements, one at Wastewater Process 1 (for alkane VOC) and one at Tank Set 4 (for benzene) (Innocenti et al., Citation2010). The following DIAL measurements were excluded from the evaluation presented in this paper. Study measurements considered to be extreme outliers or with background emissions contributions were excluded from further analysis of measurements compared with estimated emissions by location. Study measurements were not compared with emissions inventory estimates when equipment problems were identified by site representatives. In the emissions inventory comparison, extreme outliers were excluded, such as a single scan during tank cleaning that measured 4,000 lb/hr of alkane VOC.
Figure 1. Wastewater 1 unit: (a) Contour plot of DIAL concentration profile. (b) Visualization of the flux measurement.
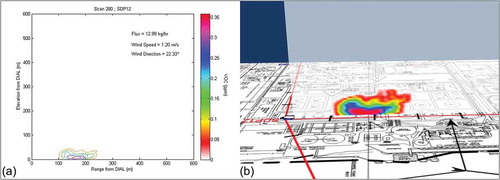
Figure 2. Tanks Set 4: (a) Contour plot of DIAL concentration profile. (b) Visualization of the flux measurement.
Statistical summary of measured emissions
The valid emission measurements which represented routine operations were aggregated by process emission location for statistical analysis. and list the statistics of the benzene emissions and VOC emissions, respectively.
Table 3. Summary statistics of measured alkane VOC emissions by emission location (lb/hr).
The highest and most variable benzene emissions were measured at Tank Set 3. An emission estimate outlier of 140.9 lb/hr was measured at this location (and excluded from the data analysis). The 95th percentile UCL of the mean of benzene emissions ranged from a high of 26.20 lb/hr, based on a normal distribution, at Tank Set 3 to a low of 6.44 lb/hr at the Wastewater Process 1 area, based on a normal distribution. The results for Tank Set 4 are likely biased low because lower elevation scan angles were partially blocked by structures during 28 of the 58 measurements.
The highest and most variable VOC emissions were measured at the Wastewater Process 1 area with a maximum of 1,420 lb/hr and a 95th percentile UCL of the mean of 964.60 lb/hr, based on a nonparametric distribution estimate. Unfavorable winds caused the emissions plume from Tank Set 8 to pass too close to the DIAL unit, resulting in 14 measurements that likely did not measure the entire plume. These measurements were conservatively included in the analysis, even though they were likely biased low.
Comparison of emission factor estimates to measured emissions
The emission factor estimates were statistically compared to the measured emissions to determine if the measured emissions were less than or equal to the emission factor derived emission estimate. Analyses were conducted using either the one-sample t-test or the Wilcoxon signed rank test as appropriate based on distribution shape.
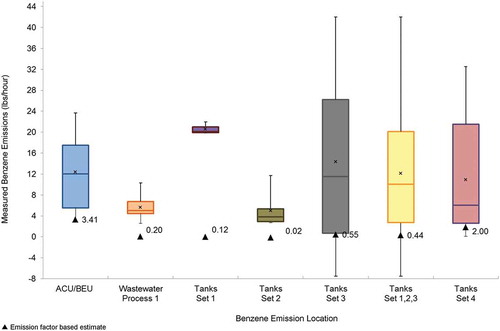
The hypothesis test results for benzene emissions are shown in . The results indicate that the measured benzene emissions are statistically higher (P < 0.0001, compared with Bonferroni corrected significance level of 0.0083) than the benzene emission factor estimate at three process areas. The table also includes summary statistics and statistics for comparing the measured estimates with the emission factor: a multiplier, underestimation error, and percent relative error. The multiplier, how many times higher the measured emission is to the estimated emission, indicates that the measured benzene emissions are between approximately 4.40 and 448.00 times higher than the emission factor estimate, depending upon the process area. At the Tank Set 2 area, Tank Set 3 area, and Tank Set 1,2,3 area, the relative error is highest (>97%). The emission factor underestimates the benzene emissions between 6.24 lb/hr at the Wastewater Process 1 area to 25.65 lb/hr at Tank Set 3. The distribution of the benzene emissions in relation to the emission factor estimate (black triangle) is shown in .
Table 4. Comparison of benzene emission factor emission estimate and measured emissions of by emission location (lb/hr).
Figure 3. Distribution of measured benzene emissions in relation to emission factor estimate (lb/hr).
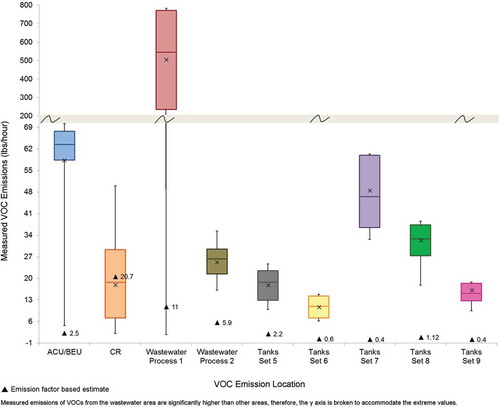
Similar analyses were conducted for the VOC measurements. The statistics and hypothesis test results for VOC emissions are shown in . The results indicate that the measured VOC emissions are statistically higher (P < 0.001 to P < 0.0001, compared with Bonferroni corrected significance level of 0.0083) than the emission factor estimate at each process area except the CR process area. The multiplier indicates that the measured VOC emissions are between approximately 1.15 to 145.30 times higher than the emission factor estimate, depending upon the process area. Of the 10 emission locations evaluated, six areas exhibited relative error greater than 90%. The largest underestimation from the emission factor occurred at the Wastewater Process 1 area. The distribution of the VOC emissions in relation to the emission factor estimate (black triangle) is shown in .
Table 5. Comparison of alkane VOC emission factor emission estimate and measured emissions of by emission location (lb/hr).
Figure 4. Distribution of measured VOC emissions in relation to emission factor estimate (lb/hr).
Prioritization of emission factors to be refined
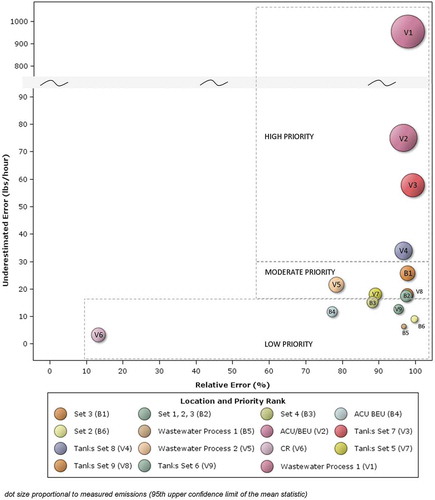
To achieve optimal reduction in error, refinement of emission factor estimates should be prioritized by both underestimation error and relative error. First, locations where the emission underestimation errors are highest are identified. Those identified with high underestimation error are then ranked by high relative error. Emission locations with a high underestimation error but low relative error may not be as easily refined. Low relative error indicates an estimate is good relative to the magnitude of the measured emissions. In these cases, refinement may not be easy to achieve since the emission factor estimate, a simple proxy for a complicated process with multiple variables, may be as good as could be expected. There is a greater need to refine emission factors with high relative error because high relative error is an indication that the current method used to develop the emission factors is not representative of the process. In this study, the emission factors with both the largest underestimation error and relative error are ranked as high priority, followed by moderate and low priority (). The emission factors for VOCs associated with the Wastewater Process 1, ACU/BEU process area, and Tank Set 7 and the emission factor for benzene for Tanks Set 7 are designated as highest priority because they produce the greatest underestimation error and the greatest relative error.
Figure 5. VOC and benzene emissions: underestimation and relative error, magnitude of measured emissions, and revision prioritization.
A simple comparison of the DIAL emissions estimates to the emissions factors is not appropriate for the purpose of improving or evaluating the emissions factors, until the root cause of the emissions is fully evaluated. Verification of represented emissions estimates is clearly needed, to promptly find, prioritize, and fix equipment problems, when the emissions estimates are not consistent with what is really happening. Only after no equipment issues are discovered is it appropriate to rigorously evaluate the emissions factors and their application.
The first step in evaluating potential issues with emissions factors is ruling out equipment problems. For example, equipment problems were identified with the tanks in Tank Set 4, where significant gaps in the internal floating roof seals were subsequently found to be larger than the assumed seal gap sizes associated with the emissions factor estimation. These equipment problems explain the differences between the emissions factor estimate and the DIAL-based emissions; therefore, corrective action regarding the equipment problem is necessary, but further evaluation of the emissions factor is not.
The data associated with this project point to potential issues with emissions factors and/or their application. For example, for crude oil, the use of EPA Tanks 4.0 software’s Reid vapor pressure (RVP) default of 5.0 psi may not be appropriate. The RVP of crude oil can vary substantially from this default value, and can, depending on the type of crude and how it’s been handled and processed, be more than twice as much as the default (Eastern Research Group, Inc., and The TGB Partnership, Citation2012).
Another area for evaluation is how the true vapor pressure (TVP) of materials, used for tank emissions factor estimates, is determined, especially when very low vapor pressures are assumed. Higher vapor pressure cutter stock may be added to heavy, high-molecular-weight materials to lower viscosities and facilitate pumping. The methodology for testing vapor pressures of heavy, high-molecular-weight materials, ASTM D2789, may be inadequate because light, high-vapor-pressure compounds may not be accounted for (Eastern Research Group, Inc., and The TGB Partnership, Citation2012). Very low vapor pressures were used for the emissions factor estimates that were much lower than the DIAL-based emissions estimates in this project for the catalytic cracker feed in Tank Set 7 (0.06 to 0.56 psia), and for the distilling kerosene and hydrocracker feed/gas oil in Tank Set 8 (0.01 psia or less).
Another area for evaluation of the emissions factors that were used includes investigating how wastewater composition data is collected and what analyses are used. Samples should be collected with precautions that prevent splashing, turbulence, and head space in the sample bottle. The analyses used should be appropriate for low-molecular-weight species, and there should be quality control steps like a total organic carbon analysis, to ensure that all of the species with significant concentrations in the wastewater are accounted for. Some of the wastewater analyses that may have been used include an air purging step prior to the analysis, which would not be appropriate because the most volatile, light hydrocarbon species would not be accounted for. Sampling and analysis procedures should be selected and followed to ensure that all compounds present in significant concentrations are accounted for, and so that volatilization of lower molecular weight species is minimized prior to and during the analysis.
Emission inventory impact
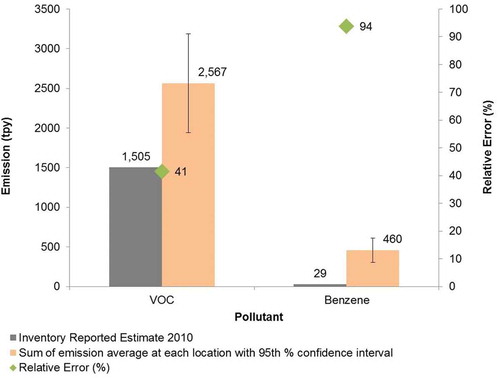
After excluding maintenance and malfunction emissions, the average total emissions rate measured during the project were 586 lb/hr VOC, 105 lb/hr benzene, and an average total emissions rate for all species of 691 lb/hr. Extrapolated to an annual figure, the rate is 2,567 tons per year (tpy) for VOC and 460 tpy for benzene. In comparison, the 2010 emissions inventory reported 1,505 tpy VOC and 28.7 tpy benzene for this location (TCEQ, Citation2014). presents the relative error in the inventory emissions as 41% and 94% for VOC and benzene, respectively.
Figure 6. Measured vs. emission inventory reported site emissions.
Although the measured emissions significantly exceeded reported emissions, the amounts by which the reported emissions appear to be underestimated are less than those documented in other studies conducted in Europe and Canada (Cuclis, Citation2012). However, the measured emissions are potentially biased low because the DIAL method is expected to slightly underestimate hydrocarbon mass flux. DIAL validation studies conducted using a known mass release have confirmed this slight underestimation (by 3–12%), based on six separate studies conducted in Europe (EPA, Citation2006b; Spectrasyne, Citation2007; Raun and Hoyt, Citation2011; Ramsey and Hashmonay, Citation2009). The alkane VOC measurements are also biased low because they only include alkane VOC, whereas the VOC emissions estimates for the emissions inventory include all VOC, including alkane VOC as well as many other types of VOC, such as olefins, aromatics, alcohols, and so on.
The largest factors impacting DIAL-based emissions rate data uncertainty involve a potential failure to accurately characterize the wind field, including turbulent eddies, and variations in wind speed and direction. As an example, if measurements are too close to a large obstruction, the circular motion associated with turbulent eddies could result in the same vapor molecules passing through the scan plane multiple times. Despite the dense structures at the site, care was taken to locate scan planes as far away as possible from large obstructions to minimize the impacts of turbulent eddies. The characterization of the wind field could have been improved had the wind speed and direction been measured at multiple locations in the scan plane. However, limited project resources precluded this option for the project. Another source of uncertainty for the alkane VOC measurements is the varying combination of chemicals being measured, spatially and temporally. These changes cause the molecular weight, the optical absorption coefficient, and DIAL detection limits to vary. Innocenti et al. (Citation2010) present the data regarding the variability of alkane VOC species being measured so that the molecular mass and optical absorption coefficient assumptions could be evaluated for each measurement location, but that is beyond the scope of this analysis. Innocenti et al. (Citation2010) do, however, confirm that the assumed molecular weight and optical absorption coefficient that were used for the VOC alkane measurements are appropriate when all of the data from the various measurement locations are evaluated together. Also, because the DIAL sensitivity for benzene is around 10 parts per billion by volume (ppbv) and about 40 ppbv for alkane VOC, many of the smaller emissions sources are not detected and therefore not included in the DIAL measurements.
The DIAL measurements, especially tank emissions, driven by evaporative losses could be biased high because measurements were only conducted during daylight hours. Collection of data over a finite time period of hours to days and then annualizing to compare to the annual emissions inventory data could also bias the data. However, previous studies indicate DIAL measured emissions do not vary significantly at nighttime (EPA, Citation2006a; Bosch, Citation2008; Cuclis, Citation2012; TCEQ, Citation2010; Robinson et. al., Citation2011). These biases are not likely to greatly change the overall finding that emission factors underestimate the measured emissions and the relative priority of emission factors needing refinement.
Conclusions
The results of this study add to the scientific literature in two main ways. First, these results add empirical evidence regarding the degree of underestimation of estimates of emissions by emission source area. This information is necessary to revise the emission factor process and identify which emission factors are based on the weakest models. It is also important information for the facility studied and may inform managers of other facilities with similar processes about potential areas of concern. Second, the introduction of prioritization based on underestimation error and relative error provides a useful tool for emission factor revision plans. Both of these findings can be used to reduce error in the emission inventory and improve regulatory tools which rely on it.
Acknowledgments
This project was completed through the effort and support of many scientists and engineers. The authors thank Arturo Blanco and Don Richner for their support. While the project was conducted within the Bureau of Pollution Control and Prevention (BPCP), many outside individuals readily provided their scientific insight. These individuals include Alex Cuclis, Ram A. Hashmonay, Steve Ramsey, and Cary Secrest. Finally, we thank Rice University staff scientist Laura Campos, Rice University graduate student Karina Subieta, and BPCP interns Taylor Kastensmidt, Ada Lee, Qiusi (Sophia) Lu, Christoph B. Meyer, and Leanne M. Piña, who have helped us through all phases of the project.
Additional information
Notes on contributors
Daniel Hoyt
Daniel Hoyt is an environmental engineer in the Air Enforcement Division of the U.S. EPA, Office of Enforcement and Compliance Assurance. The views expressed in the paper do not necessarily represent the views of the U.S. EPA.
Loren H. Raun
Loren H. Raun is a senior environmental analyst at the City of Houston Bureau of Pollution Control and Prevention in Houston, Texas and a research faculty fellow at Rice University Department of Statistics.
References
- Allen, D., C. Durrenberger, and Texas Natural Resource Conservation Commission, Technical Analysis Division. 2003. Accelerated science evaluation of ozone formation in the Houston–Galveston area: Emission inventories. Version 3.0, February 5. http://www.utexas.edu/research/ceer/texaqsarchive/pdfs/Emission%20Inventoryv3.pdf
- Bosch, J. 2008. 2nd International Workshop on remote sensing of emissions: New technologies and recent work. U.S. Environmental Protection Agency, Research Triangle Park, NC, April 1–3. Contract no. 68-W-03-038. http://www.epa.gov/ttnchie1/efpac/workshops/remotewkshp08/voc_fugitive_losses_2nd_wkshp_5-29-08.pdf
- Bosch, J., and T. Logan. 2006. VOC fugitive losses: New monitors, emission losses, and potential policy gaps. U.S. Environmental Protection Agency’s 2006 International Workshop, Washington, DC, October 25–27. Contract no. 68-W-038.
- Chambers, A. 2006. Measuring fugitive emissions of hydrocarbons at gas processing plants. Presentation, 15th International Emission Inventory Conference Reinventing Inventories—New Ideas, New Orleans, LA, May 15–18.
- Chambers, A., M. Strosher, T. Wootton, J. Moncrieff, and P. McCready. 2006. DIAL measurements of fugitive emissions from natural gas plants and the comparison with emission factor estimates. http://www.epa.gov/ttn/chief/conference/ei15/session14/chambers.pdf
- Chambers, A., M. Strosher, T. Wootton, J. Moncrieff, and P. McCready. 2008. Direct measurement of fugitive emissions of hydrocarbons from a refinery. J. Air Waste Manage. Assoc. 58(8):1047–56. doi:10.3155/1047-3289.58.8.1047
- Cheremisinoff, N. and P. Rosenfeld. 2009. Best practices in the petroleum industry. In Handbook of pollution prevention and cleaner production, Vol. 1. Elsevier, Inc. http://books.google.co.uk/books?id=vhKJwPVGSxIC&q=dial#v=onepage&q&f=false
- Cowling, E., C. Furiness, B. Dimitriades, and D. Parrish. 2007. Final rapid science synthesis report: Findings from the Second Texas Air Quality Study (TexAQS II). Southern Oxidants Study Office of the Director at North Carolina State University. Prepared for Texas Commission on Environmental Quality, contract no. 582-4-65614, August 31.
- Cuclis, Al. 2012. Why emission factors don’t work at refineries and what to do about it. Paper presented at U.S. EPA Emissions Inventory Conference, Tampa, FL, August 13–16.
- Eastern Research Group and The TGB Partnership. 2012. DIAL study evaluation storage tank results and model evaluation. Report prepared for Texas Commission on Environmental Quality Air Quality Division.
- Frisch, L. 2003. Fugitive VOC-emissions measured at oil refineries in the Province of Västra Götaland in South West Sweden—A success story: Development and results 1986–2001. Prepared for The County Administration of Väastra Götaland, report no. 2003:56. http://www.clu-in.org/programs/21m2/projects/rapport200356-Final_VOC.pdf
- Innocenti, F., R. Robinson, T. Gardiner, and J. Wang. 2010. Differential absorption lidar (DIAL) measurements of VOC and benzene emissions from a refinery site in Houston, TX, US, January/February/March 2010. Draft. Report AS (RES) 050, National Physical Laboratory (NPL), Analytical Science Division, Teddington, Middlesex, UK, June. http://www.greenhoustontx.gov/dial-appendixa.pdf
- Johansson, J., J. Mellqvist, J. Samuelsson, B. Offerle, B. Lefer, B. Rappenglück, J. Flynn, and G. Yarwood. 2014. Emission measurements of alkenes, alkanes, SO2, and NO2 from stationary sources in Southeast Texas over a 5 year period using SOF and mobile DOAS. J. Geophys. Res. Atmos. 119(4):1973–91. doi:10.1002/2013JD020485
- Karl, T., T. Jobson, W. Kuster, E. Williams, J. Stutz, R. Shetter, S. Hall, P. Goldan, F. Fehsenfeld, and W. Lindinger. 2003. Use of proton-transfer-reaction mass spectrometry to characterize volatile organic compound sources at the La Porte super site during the Texas Air Quality Study 2000. J. Geophys. Res. Atmos. 108(D16), August. doi:10.1029/2002JD003333
- Mellqvist, J., J. Samuelsson, J. Johansson, C. Rivera, B. Lefer, S. Alvarez, and J. Jolly. 2010. Measurements of industrial emissions of alkenes in Texas using the solar occultation flux method. J. Geophys. Res. Atmos. 115(D7), April. doi:10.1029/2008JD011682
- Moncrieff, J. 2007. Reflections on 20 years of DIAL VOC measurements in the oil and gas industries. Presentation, Houston Area Monitoring Group meeting, Houston, TX, September 26.
- Parrish, D., et al. 2009. Overview of the Second Texas Air Quality Study (TexAQS II) and the Gulf of Mexico Composition and Climate Study (GoMACCS). J. Geophys. Res. Atmos. 114(D7), April. doi:10.1029/2009JD011842
- Ramsey, S., and R. Hashmonay. 2009. Optical remote sensing of fugitive VOC losses. American Institute of Chemical Engineers (AIChE), 2009 Spring Meeting & 5th Global Congress on Process Safety, 21st Ethylene Producers’ Conference, Ethylene Plant Environmental Issues Paper Session, April 28.
- Raun, L., and D. Hoyt. 2011. Measurement and analysis of benzene and voc emissions in the Houston ship channel area and selected surrounding major stationary sources using DIAL technology to support ambient HAP concentrations reductions in the community—Final report. City of Houston, Bureau of Pollution Control and Prevention, Houston, TX, July 20.
- Robinson, R., T. Gardiner, F. Innocenti, P. Woods, and M. Coleman. 2011. Infrared differential absorption lidar (DIAL) measurements of hydrocarbon emissions. J. Environ. Monit. 13(8):2213–20. doi:10.1039/C0EM00312C
- Ryerson, T., et al. 2003. Effect of petrochemical industrial emissions of reactive alkenes and NOx on tropospheric ozone formation in Houston, Texas. J. Geophys. Res. Atmos. 108(D8), April. doi:10.1029/2002JD003070
- Shell. 2014a. Deer Park manufacturing site. July 7. http://www.shell.us/aboutshell/projects-locations/deerpark.html
- Shell. 2014b. Shell Chemical LP—Deer Park (TX), USA. January 7. http://www.shell.com/global/products-services/solutions-for-businesses/chemicals/about-shell-chemicals/manufacturing-locations/deerpark.html
- Smithers, B., J. McKay, G. Van Ophem, and K. Van Parijs. 1995. VOC emissions from external floating roof tanks: Comparison of remote measurements by laser with calculation methods. Prepared for CONCAWE Air Quality Management Group, report no. 95/52, Brussels, Belgium, January.
- Spectrasyne. 2007. Quality assurance project plan for the 2007 TCEQ DIAL study. Document available by request from TCEQ.
- Texas Commission on Environmental Quality, Chief Engineer’s Office. 2010. Differential absorption LIDAR study—Final report. March 29. https://www.tceq.texas.gov/assets/public/implementation/air/am/contracts/reports/ei/DIAL.pdf
- Texas Commission on Environmental Quality. 2014. Central registry air emissions inventory. January 7. http://www15.tceq.texas.gov/crpub
- U.S. Department of Energy. U.S. Energy Information Administration. 2013. Refinery capacity report. Petroleum & Other Liquids. Washington, DC, June. http://www.eia.gov/petroleum/refinerycapacity
- U.S. Environmental Protection Agency, Office of Air Quality Planning and Standards. 1995. Compilation of air pollutant emission factors. In AP-42, Vol. I: Stationary point and area sources. Research Triangle Park, NC, January.
- U.S. Environmental Protection Agency, Office of Inspector General. 2006a. EPA can improve emissions factors development and management. Report no. 2006-P-00017. Washington, DC, March 22.
- U.S. Environmental Protection Agency. 2006b. TANKS emissions estimation software, Version 4.09D. Technology Transfer Network: Clearinghouse for Inventories & Emissions Factors. October 6. http://www.epa.gov/ttnchie1/software/tanks
- U.S. Environmental Protection Agency, Office of Research and Development. 2010. ProUCL Version 4.1.00. http://www.epa.gov/osp/hstl/tsc/software.htm#Documentation
- U.S. Environmental Protection Agency. 2012. TRI Explorer. Release reports. http://iaspub.epa.gov/triexplorer/tri_release.chemical
- U.S. Environmental Protection Agency. 2013. Shell Deer Park settlement. July 10. http://www2.epa.gov/enforcement/shell-deer-park-settlement
- U.S. Environmental Protection Agency. 2014. 2005 National-scale air toxics assessment. Technology Transfer Network Air Toxics. August 21. http://www.epa.gov/ttn/atw/nata2005
- Washenfelder, R., et al. 2010. Characterization of NOx, SO2, ethene, and propene from industrial emission sources in Houston, TX. J. Geophys. Res. Atmos. 115(D16), August. doi:10.1029/2009JD013645
- Wert, B., et al. 2003. Signatures of terminal alkene oxidation in airborne formaldehyde measurements during TexAQS 2000. J. Geophys. Res. Atmos. 108(D3), February. doi:10.1029/2002JD002502