
Abstract
In this study, activated carbon was prepared from Chinese chestnut burs assisted by microwave irradiation with potassium hydroxide (KOH) as activator, and the process conditions were optimized employing Box-Behnken design (BBD) and response surface methodology (RSM). The optimized variables were irradiation time, impregnation time, and mass ratio of alkali-to-carbon, and the iodine adsorption value was used to evaluate the adsorption property of activated carbon. The optimal preparation conditions were determined as follows: irradiation time 17 min, impregnation time 240 min, and mass ratio of alkali-to-char 1.5:1. Meanwhile, the relatively high iodine adsorption value (1141.4 mg/g) was also obtained. Furthermore, the pore structural characterization of activated carbon was analyzed. The analyzed results showed a larger Brunauer-Emmett-Teller (BET) specific surface area (1254.5 m2/g) and a higher microporosity ratio (87.2%), a bigger total pore volume (0.6565 m3/g), but a smaller average pore size (2.093 nm), which demonstrated the obtained activated carbon possessed strong adsorption capacity and well-developed microporous structure. This research could not only establish the foundation of utilizing chestnut burs to prepare activated carbon, but also provide the basis for exploitation of Chinese chestnut by-products.
Implications: Because Chinese chestnut burs are the by-products and usually discarded upon harvesting subsequently, the utilization of chestnut burs as a potential source of activated carbon is of great profit to the chestnut processing industries.
Introduction
Activated carbon, one of the most useful adsorbent, can play very important roles in many industrial applications. As an adsorbent with high surface area and affluent pore volumes, it has been widely applied to various fields such as catalysis (Lima et al., Citation2013; Calvino-Casilda et al., Citation2010), food industry (Mudoga et al., Citation2008), medical (Awwad et al., Citation2015; Xiao et al., Citation2015), and environmental protection (Singh et al., Citation2008; Karatepe et al., Citation2008; Liu et al., Citation2014; Nieto-Marquez et al., Citation2014; Denyes et al., Citation2013). Specially, activated carbon contributes a lot to the core material (Sun and Jiang, Citation2009; Jurado-Sánchez et al., Citation2015; Sim et al., Citation2014) of water purifiers, refrigerator deodorants, protective masks, antiodor insoles, and cigarette filters. Recently, activated carbon has become more attractive because of its environmental benefits. Therefore, it is necessary to look for more extensive, cheap material source for the preparation of activated carbon. In recent years, the preparation of activated carbon from cheap agricultural and forestry wastes has drawn wide attention, such as corn cob (Cao et al., Citation2006), rice husks (Foo and Hameed, Citation2011a), durian shell (Chandra et al., Citation2009), walnut shells (Bae et al., Citation2014), rice bran (Suzuki et al., Citation2007), olive seed (Stavropoulos and Zabaniotou, Citation2005), and Tunisian olive-waste cakes (Baccar et al., Citation2009). Among these precursors, some of the waste materials could potentially be used to make higher-value products.
Chinese chestnut (Castanea mollissima Blume), which is native in China, is one of the important economic crops and widely cultivated in Europe, North American, and Asia (Zhao et al., Citation2011). In China, Chinese chestnuts are widely cultivated in Hubei, Shandong, Hunan, Hebei, Anhui, and Shaanxi provinces, with a total annual production of up to 1,620,000 tons in 2010, contributing to approximately 83% of the global production (Dai and Liu, Citation2012). When 1 ton chestnut is harvested, more than 1 ton chestnut burs with 1–2-cm-long, 1–2-mm-thick spines, and hard texture can be produced as by-products, which are usually discarded upon harvesting subsequently. Chestnut has been extensively studied in various commercial forms for food service industry (Gao et al., Citation2006). However, the development and utilization of chestnut by-products are seldom reported. Therefore, the utilization of chestnut burs as a potential source of activated carbon is of great profit to the chestnut processing industries.
As a statistical approach, the response surface methodology (RSM) is an effective method for optimizing the technological conditions and is widely used to study the interaction effects between multiple single factors (Karacan et al., Citation2007). Moreover, the main advantage of RSM is that the reduced number of experiments or trials require to evaluate multiple parameters and their interactions (Pilkington et al., Citation2014). Microwave heating technology, a mature preparation technology, has been widely applied in materials science, food processing, analytical chemistry, as well as the preparation of activated carbon (Yuen and Hameed, Citation2009). To obtain the optimal processing conditions for chestnut burs–based activated carbon (CBAC), RSM based on Box-Behnken design (BBD) was used. In this study, chestnut burs were selected as raw material and carbonized at 400 °C under anoxic conditions. The char produced was activated into activated carbon with potassium hydroxide (KOH) as activator by microwave radiation. Based on the results of single-factor experiments, RSM was used to optimize the preparation conditions of activated carbon. Moreover, pore structural characterization of the obtained activated carbon was analyzed to verify the method feasibility of preparing activated carbon from chestnut burs.
Materials and Methods
Materials
Chestnut burs (CB) were obtained from the Chestnut Demonstration Station Base of Northwest A & F University (Shaanxi, China).
Activated carbon preparation
CB were cleaned and dried at 80 ± 5 °C for 24 hr. The dried sample was carbonized at 400 °C under anoxic conditions. The char produced was ground and sieved to discrete sizes (200 mesh size). According to the preestablished mass ratio of alkali-to-char, a certain amount of KOH was dissolved in 10 mL distilled water to prepare the alkaline solution, which was mixed with 5 g char produced uniformly and then immersed at 100 ± 5 °C for the selected time. Subsequently, the activation was conducted in a 100-mL crucible reactor with cover clamp placed in microwave oven (G80F23CN2P-13M1; 800 W; Galanz, Guangdong, China). The activated products were immersed in hydrochloric acid (0.1 mol/L) by stirring for 15 min, and then washed with warm distilled water (70 °C) for several times until the pH of the washing solution was about 7. Finally, the activated products were dried at 100 ± 5 °C for 24 hr and stored in desiccators for further use. The dried products were named as CBAC.
Experimental design
The single-factor experiments were performed in order to screen out the more significant parameters for the preparation process of CBAC. Three major influence factors (irradiation time, impregnation time, and mass ratio of alkali-to-char) were selected, and their effects on iodine adsorption value of CBAC were evaluated. One factor was changed while the other factors were kept constant in each experiment. Based on the results of single-factor experiments, BBD experiments were carried out to further optimize preparation conditions of CBAC. The ranges of the three investigated factors were assessed as shown in .
Table 1. Factors and levels in Box-Behnken design (BBD) of experiment.
The three factors selected in this study were designated as x1, x2, x3, and prescribed into three levels, coded as +1, 0, −1 for high, intermediate, and low, respectively. The variable levels Xi were coded as xi according to eq 1.
where xi is the coded value of the variable, Xi is the uncoded value of the variable, X0 is the value of Xi at the center point, and X is the step change of an independent variable, i = 1, 2, 3.
RSM was employed to optimize the preparation conditions in order to obtain activated carbon with high iodine adsorption value. The experimental results were analyzed by RSM using software Design-Expert 8.0.6 (State-Ease Inc., Minneapolis, MN, USA). A 3-factor–3-level BBD with a total of 17 trials were used to study the effects of the independent variables. The response values were assumed by iodine adsorption value (Y), which was recorded as the mean of triplicates. According to the experimental data, a second-order polynomial model was established for expressing the relationship between iodine adsorption value and preparation variables. Meanwhile, experimental data were analyzed using RSM by eq 2.
where Y is the predicted response value; k0 is the intercept term; x1, x2, and x3 are independent variables; k1, k2, and k3 are linear term coefficients; k12, k13, and k23 are cross-product term coefficients; and k11, k22, and k33 are quadratic term coefficients.
Adsorption equilibrium studies
The adsorptive properties of CBAC were assessed by iodine adsorption value, which was normally one of specification parameters for commercial activated carbons. Equilibrium sorption studies were conducted in a set of 250-mL Erlenmeyer flask with stopper containing 0.5 g CBAC and 50 mL iodine standard solution (0.1 mol/L). The flasks were agitated in a shaker (SHA-B; Shanghai, China) at 250 rpm for a certain time until the equilibrium. According to GB/T12496.8-1999 (China), the iodine adsorption value, A (mg/g), was calculated using eq 3.
where C1 (mol/L) is the concentration of iodine standard solution, C2 (mol/L) is the concentration of sodium thiosulfate standard solution (0.1 mol/L), V2 (mL) is the volume of the sodium thiosulfate standard solution, and m (g) is the mass of CBAC.
Characterization analyses
The pore structural characterization of CBAC obtained under optimum conditions was determined by an automatic specific surface area and pore size analyzer (V-Sorb 2800P; Gold App Instruments, Beijing, China). With purified nitrogen (99.999%) as adsorption gas, Brunauer-Emmett-Teller (BET) specific surface area (m2/g), t-plot micropore area (m2/g), total adsorption average pore size (nm), single point adsorption total pore volume (m3/g), and t-plot micropore volume (m3/g) were measured at −196 °C. Prior to gas adsorption measurements, the samples were degassed at 120 °C in a vacuum condition for 5 hr by helium (99.999%) as sweeping gas. Meanwhile, the adsorption isotherms and HK-pore size distribution of CBAC were graphed. Moreover, the microporosity ratio, θ (%), was also calculated by eq 4.
where Vmic (m3/g) is the t-plot micropore volume, Vt (m3/g) is the single point adsorption total pore volume.
Scanning electron microscopic (KYKY3800B; KYKY Technology Co., Ltd, Beijing, China) analysis was performed to study the textural structure of the char and CBAC. The samples were observed at current of 100 μA, lens aperture of 100 μm, condenser aperture of 300 μm, and working distance of 13 mm. Furthermore, the surface functional groups of CBAC was detected by Fourier transform infrared (FTIR) spectroscopy (Vetex70; Bruker, Karlsruhe, Germany) from the scanning range of 4000–400 cm−1.
Results and Analysis
Single-factor experiments
Effect of irradiation time on the iodine adsorption value
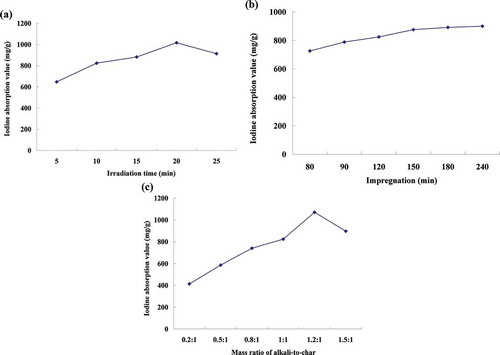
One of the important factors influencing the preparation process is irradiation time, which plays an important role in activation reaction (Deng et al., Citation2010a). To investigate the effect of irradiation time on the iodine adsorption value of the prepared activated carbon, microwave irradiation time was respectively set at 5, 10, 15, 20, and 25 min, while other parameters were set as follows: impregnation time 120 min and mass ratio of alkali-to-char 1:1. As can be seen from , the iodine adsorption value increased with the increment of irradiation time, and the highest value was obtained at the irradiation time 20 min. This might be due to that the adequate irradiation time contributed to the requirement of complete activation of char produced into activated carbon. However, after 20 min, the increment of the irradiation time had negative effect on the iodine adsorption value. A possible explanation was that the longer reaction time might lead to the appearance of the carbon ashing and the formation of the sintering. The similar phenomenon was also observed from other previous studies (S.Q. Li et al., Citation2012). Therefore, 20 min was selected as the center point of the irradiation time in the BBD experiment.
Figure 1. Effects of (a) irradiation time, (b) impregnation time, and (c) mass ratio of alkali-to-char on the iodine adsorption value.
Effect of impregnation time on the iodine adsorption value
Impregnation time is another important factor influencing the preparation process of activated carbon. It has been reported that a longer impregnation time could increase the diffusion of activator in the char produced (An, Citation2002). To study the effect of impregnation time on the iodine adsorption value, the preparation process of CBAC was carried out at different impregnation times (i.e., 80, 90, 120, 150, 180, and 240 min), while other parameters were set as follows: irradiation time 10 min and mass ratio of alkali-to-char 1:1. indicated that the iodine adsorption value increased with the increment of impregnation time, which suggested that the impregnation time presented positive effect on the iodine adsorption value. A possible explanation was that the increment of impregnation time was beneficial to the activator dipping into the inside pore of char produced, so as to promote the activation reaction. However, the iodine adsorption value had no noticeable change when the impregnation time was longer than 150 min. Therefore, 150 min was selected as the center point of the impregnation time in the BBD experiment.
Effect of mass ratio of alkali-to-char on the iodine adsorption value
The mass ratio of alkali-to-char would also significantly affect the preparation process of activated carbon (Deng et al., Citation2010a,Citationb). In this study, the mass ratio of alkali-to-char was set at 0.2:1, 0.5:1, 0.8:1, 1:1, 1.2:1, and 1.5:1 to investigate the effect of different mass ratios of alkali-to-char on the iodine adsorption value, while other parameters were set as follows: irradiation time 10 min and impregnation time 120 min. According to , the iodine adsorption value increased with the increasing of the mass ratio of alkali-to-char from 0.2:1 to 1.2:1, which implied that the activation efficiency was strengthened with the increment of the mass ratio of alkali-to-char. However, with more than 1.2:1, the iodine adsorption value was not increased but slightly decreased. This might be due to the excessive activator, which was accumulated on the surface of the char produced, resulted in the enhancement of carbon burn-off and the transformation of miropore into mesopore. This tendency was in good agreement with the literature results (Baccar et al., Citation2009; Chandra et al., Citation2009). Therefore, 1.25:1 was selected as the center point of the mass ratio of alkali-to-char in the BBD experiment, as a larger mass ratio of alkali-to-char would decrease the iodine adsorption value and also increase the cost of the preparation process.
Statistical analysis of RSM
Model building and statistical analysis
A 3-factor–3-level BBD with 17 sets of experiments was carried out, which was employed to further optimize the preparation process of CBAC, accompanying by analyses of RSM. Each experiment in the design matrix was performed and the experimental data were obtained as shown in .There was a considerable variation of iodine adsorption value under the different preparation conditions. The iodine adsorption value ranged from 790.07 to 1123.14 mg/g.
Table 2. Experimental design and results for response surface methodology (RSM).
Based on the experimental data, multiple regression analysis was performed by using the software of Design Expert 8.0.6 to get a polynomial equation (eq 5), which correlated the relationship between response variable (Y) and tested variables. The polynomial equation was as follows:
The statistical significance of the quadratic model equation was evaluated by the F-test analysis of variance (ANOVA) as presented in ,which revealed that the model (P = 0.0001) was highly significant and the lack-of-it (P = 0.3252) was not significant. In addition, the model presented a high determination coefficient (R2 = 0.9727) and a high adjusted determination coefficient (R2adj = 0.9377) but a low coefficient of variation (CV [%] = 2.21). The goodness-of-fit of the model can be checked by the determination coefficient (R2), adjusted determination coefficient (R2adj), and coefficient of variation (Li et al., Citation2012). The closer the value of R2 is to 1, the better the model fits the experimental data (Karacan et al., Citation2007). The smaller the difference between the determination coefficient (R2) and adjusted determination coefficient (R2adj), the higher the goodness-of-fit of the model. The smaller the coefficient of variation, the better the precision and reliability of the model. In this research, the results suggested that the obtained quadratic regression equation was highly significant, and the model was adequate for predicting the process within the range of the variables employed.
Table 3. Analysis of variance for the regression equation.
The significance of each variable was assessed using the P value. Value of “P” less than 0.05 demonstrates that the corresponding term is significant. The smaller the P value, the more significant the corresponding term (Li et al., Citation2012). It can be concluded from that the variables with the highly significant effects on the iodine adsorption value (Y) are x3, x1x3, and x12, indicating that their influences on the response function are extremely large. It also can be seen that the influences of x1, x22, and x32 are significant, whereas the influences of x2, x1x2, and x2x3 are not significant.
Response surface plot analysis
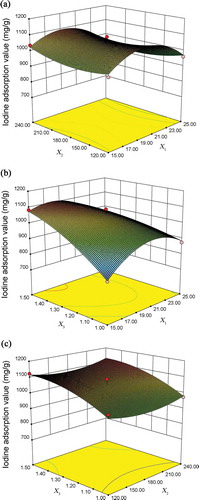
The three-dimensional response surfaces and two-dimensional contours were plotted by the software of Design-Expert 8.0.6 as shown in ,which designated the interactions of variables and the optimal level of each variable for the maximum response. The influences of various variables on experimental results are related to the surface steepness. The larger tilting angle and the bigger, steeper surface indicate the more significant influence (Ferreira et al., Citation2007). In this case, showed that the interaction between the irradiation time (X1) and mass ratio of alkali-to-char (X3) was significant. Obviously, the mass ratio of alkali-to-char (X3) affected the iodine adsorption value (Y) of CBAC more than that of the irradiation time (X1), for it displayed a larger tilting angle. From and , the interaction between irradiation time (X1) and impregnation time (X2) as well as the interaction between impregnation time (X2) and the mass ratio of alkali-to-char (X3) were not significant. These results were consistent with the analysis results of ANOVA regression equation provided in .
Figure 2. Response surface polts showing the effects of variables (X1 = irradiation time, min; X2 = impregnation time, min; and X3 = the mass ratio of alkali-to-char) on the iodine adsorption value.
The optimal conditions obtained with RSM and verification of the model
With iodine adsorption value as the response value, the optimal preparation process conditions of CBAC by RSM were determined as follows: the irradiation time 17 min, impregnation time 240 min, and mass ratio of alkali-to-char 1.5:1. Under the selected optimal conditions, the maximum iodine adsorption value of CBAC was predicted to be 1155.8 mg/g.
To verify the reliability of the optimal conditions of CBAC with RSM, three groups of verification experiments were performed according to the optimal conditions and the mean value of iodine adsorption value was 1141.4 mg/g. Its relative error to the predicted value (1155.8 mg/g) was 1.25%, demonstrating that the obtained quadratic polynomial model was satisfactory and adequate for reflecting the expected optimization.
Characterization of CBAC
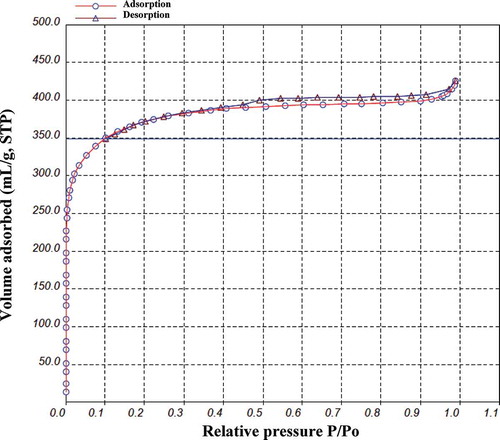
Identifying the pore structures by N2 adsorption at −196 °C is an essential procedure to understand the characteristics of CBAC. shows the adsorption isotherm of CBAC prepared under optimal conditions. The shape of adsorption isotherm curve could provide preliminary qualitative information on the adsorption mechanism as well as on the porous structure of carbon (Chandra et al., Citation2009). According to International Union of Pure and Applied Chemistry (IUPAC) classification, this adsorption isotherm belonged to type I and its hysteresis belonged to H4-type, implying that CBAC not only possessed well-developed microporous structure but also had narrow fissure pores. Obviously, in a relatively low-pressure region (P/P0 < 0.1), gas adsorption capability showed a rapid enhancement, which might be due to the effect of the predominantly microporous nature of the carbons. Under a low pressure, the adsorption amount was increased, which contributed to the micropore filling. When the P/P0 increased gradually (P/P0 > 0.4), the isotherm was nearly in the horizontal platform status, suggesting that reaction system reached equilibrium states.
Figure 3. Adsorption isotherms of CBAC prepared under optimal conditions.
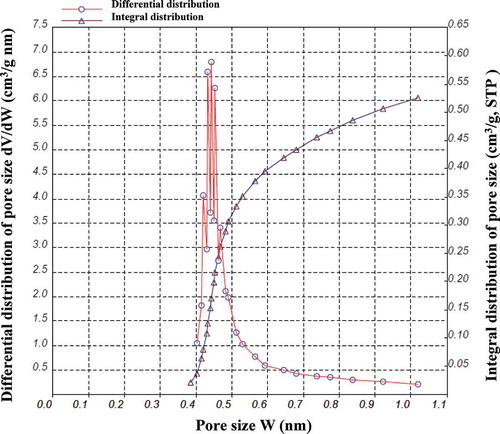
The pore structure of activated carbon can be further investigated by Horvath-Kawazoe (HK) equation. In this paper, the HK method was used to confirm the micropore size distribution. As can be seen from , the pore size of the prepared activated carbon was mostly in the range of 0.4–0.6 nm, which reveals that the CBAC sample obtained contained a large amount of micropores. This result was consistent with the adsorption isotherm (). Moreover, the structural parameters of CBAC in the present research were summarized in , which were BET specific surface area (1254.5 m2/g), t-plot micropore area (1204.8 m2/g), total adsorption average pore size (2.093 nm), single point adsorption total pore volume (0.6565 cm3/g), and t-plot micropore volume (0.5727 cm3/g), respectively. With the microporosity ratio of 87.2%, it can be further illuminated that CBAC prepared under optimal conditions was mostly made up of microporous. Similar results were also depicted by and .
Table 4. Comparisons of activated carbons for the characterization of the microstructure.
Figure 4. HK-pore size distribution of CBAC prepared under optimal conditions.
The activation time, BET surface area, pore volume, and average pore size in our present investigation were compared with those of previous reported studies as shown in , all of which were under the same microwave activation method with KOH as activator. Although the activation time in our study was longer than the previous research, the larger value of BET surface area (1254.5 m2/g) and the bigger total pore volume (0.6565 m3/g) of CBAC in this work than those of the previous studies and a relatively smaller average pore size (2.093 nm) indicated that CBAC obtained in our research exhibited relatively strong adsorption capacity.
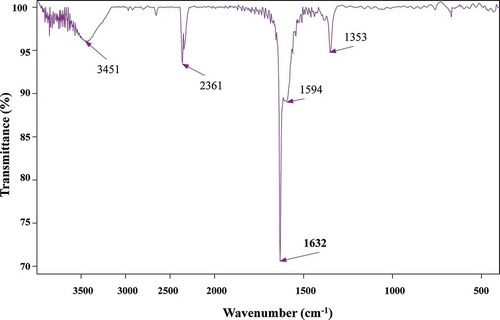
The surface morphology of adsorbent before and after the activation process was characterized using scanning electron microscope (SEM). The SEM micrograph () showed that a small amount of pore was created on the external surface of the char, but a well-developed pore structure was exhibited on the textural structure of CBAC. The obtained Fourier transform infrared (FTIR) spectrum of CBAC () revealed the peaks at 3451, 2361, 1632, 1594, and 1353 cm−1. The band at around 3451 cm−1 can be attributed to –OH stretching vibration (Deng et al., Citation2009). The peak at 2361 cm−1 is assigned to the C≡C stretching (Foo and Hameed, Citation2011d). The peaks occurring at 1632 and 1594 cm−1 are the characteristics of the C=O stretching vibration (Deng et al., Citation2010a,Citationb). The peak at 1353 cm−1 is ascribed to oxygen functionalities such as highly conjugated C–O stretching, C–O stretching in carboxylic groups, and carboxylate moieties (Deng et al., Citation2010a,Citationb).
Figure 5. SEM micrographs of (a) char (2000×) and (b) CBAC (2000×).
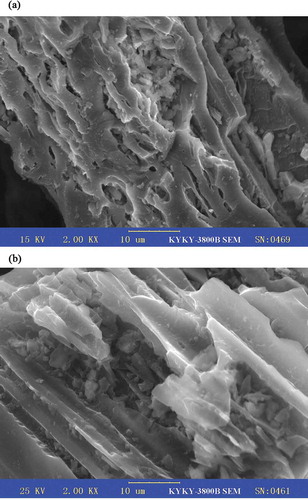
Figure 6. FTIR spectrum of CBAC.
Conclusion
In this paper, the preparation conditions of activated carbon from chestnut burs were optimized by BBD and RSM analyses. The optimal preparation conditions were determined as follows: irradiation time as 17 min, impregnation time as 240 min, and mass ratio of alkali-to-char as 1.5:1; the corresponding highest iodine adsorption value was 1141.4 mg/g. In addition, BET specific surface area, t-plot micropore area, total adsorption average pore size, single point adsorption total pore volume, t-plot micropore volume, and microporosity ratio of CBAC were further evaluated, the corresponding values of which were respectively 1254.5 m2/g, 1204.8 m2/g, 2.093 nm, 0.6565 cm3/g, 0.5727 cm3/g, and 87.2%. The present research demonstrated that activated carbon with a large amount of micropores could be prepared from chestnut burs, and the prepared chestnut burs–based activated carbon possessed excellent adsorption performance. This research could not only establish the foundation of utilizing chestnut burs to prepare activated carbon, but also provide the basis for exploitation of chestnut by-products. Further experiments on structure-adsorption relationship of CBAC as well as the industrial application of Castanea mollissima burs are in progress.
Funding
Funding for this research was provided by the Popularization Fund of Agricultural Science and Technology (grant no. Z222021316), Natural Science Fund of Shaanxi Province (grant no. 2013JQ3018), and National Science & Technology Support Project of “the Twelfth-Five Year” (grant no. 2013BAD14B0404).
Acknowledgment
The authors wish to acknowledge the extensive help given by the Key Laboratory of Shaanxi Province of Economic Plant Resources Development and Utilization, and the Chestnut Demonstration Station Base of Northwest A & F University.
Additional information
Funding
Notes on contributors
Xiuhong Li
Xiuhong Li is a doctoral graduate student in botany from Northwest A&F University.
Fangxia Yang
Fangxia Yang is an associate professor of forestry engineering department in the College of Forestry, Northwest A&F University. Xiuhong Li and Fangxia Yang contributed equally to this work.
Peiqin Li
Peiqin Li, Xiuping Yang, Jialin He, and Hongzhe Wang are scientific researchers in the Forestry College of Northwest A&F University.
Pinghui Lv
Pinghui Lv is the Chief of the Chestnut Demonstration Station Base of Northwest A&F University.
References
- An, X.N. 2002. Chemistry and Technology of Forest Products. Beijing: China Forestry Press.
- Awwad, M., F. Al-Rimawi, K.J. Dajani, M. Khamis, S. Nir, and R. Karaman. 2015. Removal of amoxicillin and cefuroxime axetil by advanced membranes technology, activated carbon and micelle-clay complex. Environ. Technol. 36(15):2069–2078. doi:10.1080/09593330.2015.1019935
- Baccar, R., J. Bouzid, M. Feki, and A. Montiel. 2009. Preparation of activated carbon from Tunisian olive-waste cakes and its application for adsorption of heavy metal ions. J. Hazard. Mater. 162:1522–1529. doi:10.1016/j.jhazmat.2008.06.041
- Bae, W., J. Kim, and J. Chung. 2014. Production of granular activated carbon from food-processing wastes (walnut shells and jujube seeds) and its adsorptive properties. J. Air Waste Manage. Assoc. 64:879–886. doi:10.1080/10962247.2014.897272
- Calvino-Casilda, V., A.J. Lopez-Peinado, C.J. Duran-Valle, and R.M. Martin-Aranda. 2010. Last decade of research on activated carbons as catalytic support in chemical processes. Cat. Rev. Sci. Eng. 52:325–380. doi:10.1080/01614940.2010.498748
- Cao, Q., K.C. Xie, Y.K. Lv, and W.R. Bao. 2006. Process effects on activated carbon with large specific surface area from corn cob. Bioresour. Technol. 97:110–115. doi:10.1016/j.biortech.2005.02.026
- Chandra, T.C., M.M. Mirna, J. Sunarso, Y. Sudaryanto, and S. Ismadji. 2009. Activated carbon from durian shell: Preparation and characterization. J. Taiwan Inst. Chem. Eng. 40:457–462. doi:10.1016/j.jtice.2008.10.002
- Dai, Y.W., and W.P. Liu. 2012. Study on current status and promotion strategy of international competitiveness of Chinese chestnut industry. Res. Agric. Modern. 33:456–460. doi:10.3969/j.issn.1000-0275.2012.04.016
- Deng, H., G.X. Li, H.B. Yang, J.P. Tang, and J.Y. Tang. 2010a. Preparation of activated carbons from cotton stalk by microwave assisted KOH and K2CO3 activation. Chem. Eng. J. 163:373–381. doi:10.1016/j.cej.2010.08.019
- Deng, H., L. Yang, G. Tao, and J. Dai. 2009. Preparation and characterization of activated carbon from cotton stalk by microwave assisted chemical activation-application in methylene blue adsorption from aqueous solution. J. Hazard. Mater. 166:1514–1521. doi:10.1016/j.jhazmat.2008.12.080
- Deng, H., G. Zhang, X. Xu, G. Tao, and J. Dai. 2010b. Optimization of preparation of activated carbon from cotton stalk by microwave assisted phosphoric acid-chemical activation. J. Hazard. Mater. 182:217–224. doi:10.1016/j.jhazmat.2010.06.018
- Denyes, M.J., A. Rutter, and B.A. Zeeb. 2013. In situ application of activated carbon and biochar to PCB-contaminated soil and the effects of mixing regime. Environ. Pollut. 182:201–208. doi:10.1016/j.envpol.2013.07.016
- Ferreira, S.L.C., R.E. Bruns, H.S. Ferreira, G.D. Matos, J.M. David, G.C. Brandao, E.G.P. da Silva, L.A. Portugal, P.S. dos Reis, and A.S. Souza. 2007. Box-Behnken design: An alternative for the optimization of analytical methods. Anal. Chim. Acta 597:179–186. doi:10.1016/j.aca.2007.07.011
- Foo, K.Y., and B.H. Hameed. 2011a. Utilization of rice husks as a feedstock for preparation of activated carbon by microwave induced KOH and K2CO3 activation. Bioresour. Technol. 102:9814–9817. doi:10.1016/j.biortech.2011.07.102
- Foo, K.Y., and B.H. Hameed. 2011b. Microwave-assisted preparation of oil palm fiber activated carbon for methylene blue adsorption. Chem. Eng. J. 166: 792–795. doi:10.1016/j.cej.2010.11.019
- Foo, K.Y., and B.H. Hameed. 2011c. Preparation and characterization of activated carbon from pistachio nut shells via microwave-induced chemical activation. Biomass Bioenergy 35:3257–3261. doi:10.1016/j.biombioe.2011.04.023
- Foo, K.Y., and B.H. Hameed. 2011d. Preparation of activated carbon from date stones by microwave induced chemical activation: Application for methylene blue adsorption. Chem. Eng. J. 170:338–341. doi:10.1016/j.cej.2011.02.068.
- Foo, K.Y., and B.H. Hameed. 2011e. Preparation of oil palm (Elaeis) empty fruit bunch activated carbon by microwave-assisted KOH activation for the adsorption of methylene blue. Desalination 275:302–305. doi:10.1016/j.desal.2011.03.024
- Gao, H.S., X.D. Chang, J.X. Cai, J.T. Zhu, and X.F. Liu. 2006. Production situation and development trend of chestnut processing. J. Chin. Inst. Chem. Eng. 6:429–436. doi:10.3969/j.issn.1009-7848.2006.01.088
- Jurado-Sánchez, B., S. Sattayasamitsathit, W. Gao, L. Santos, Y. Fedorak, V.V. Singh, J. Orozco, M. Galarnyk, and J. Wang. 2015. Self-propelled activated carbon janus micromotors for efficient water purification. Small 11:499–506. doi:10.1002/smll.201402215
- Karacan, F., U. Ozden, and S. Karacan. 2007. Optimization of manufacturing conditions for activated carbon from Turkish lignite by chemical activation using response surface methodology. Appl. Therm. Eng. 27:1212–1218. doi:10.1016/j.applthermaleng.2006.02.046
- Karatepe, N., I. Orbak, R. Yavuz, and A. Ozyuguran. 2008. Sulfur dioxide adsorption by activated carbons having different textural and chemical properties. Fuel 87:3207–3215. doi:10.1016/j.fuel.2008.06.002
- Li, P.Q., S. Lu, T. Shan, Y. Mou, Y. Li, W. Sun, and L. Zhou. 2012. Extraction optimization of water-extracted mycelial polysaccharide from endophytic fungus Fusarium oxysporum Dzf17 by response surface methodology. Int. J. Mol. Sci. 13:5441–5453. doi:10.3390/ijms13055441
- Li, S.Q., B. Huang, G.F. Lin, Y.D. Chen, W.Q. Chen, and C.X. Chen. 2012. Preparation and characterization of activated carbon by mechanochemical process with zinc chloride as activator. Chem. Ind. Forest Prod. 32(2):110–116.
- Lima, S.B., S.M.S. Borges, M.D. Rangel, and S.G. Marchetti. 2013. Effect of iron content on the catalytic properties of activated carbon-supported magnetite derived from biomass. J. Braz. Chem. Soc. 24:344–354. doi:10.5935/0103-5053.20130044
- Liu, X.L., J.X. Guo, Y.H. Chu, D.M. Luo, H.Q. Yin, M.C. Sun, and R. Yavuz. 2014. Desulfurization performance of iron supported on activated carbon. Fuel 123:93–100. doi:10.1016/j.fuel.2014.01.068
- Mudoga, H.L., H. Yucel, and N.S. Kincal. 2008. Decolorization of sugar syrups using commercial and sugar beet pulp based activated carbons. Bioresour. Technol. 99:3528–3533. doi:10.1016/j.biortech.2007.07.058
- Nieto-Marquez, A., E. Atanes, A. Fernandez, S. Lopez-Villa, A. Cambra, and F. Fernandez-Martinez. 2014. Effective adsorption of sulfur dioxide by activated carbons containing calcium carbonate from deinking paper sludge. Ind. Eng. Chem. Res. 53:15620–15628. doi:10.1021/ie502955p
- Pilkington, J.L., C. Preston, and R.L. Gomes. 2014. Comparison of response surface methodology (RSM) and artificial neural networks (ANN) towards efficient extraction of artemisinin from Artemisia annua. Ind. Crop. Prod. 58:15–24. doi:10.1016/j.indcrop.2014.03.016
- Sim, K.M., K.H. Kim, G.B. Hwang, S. Seo, G.N. Bae, and J.H. Jung. 2014. Development and evaluation of antimicrobial activated carbon fiber filters using Sophora flavescens nanoparticles. Sci. Total. Environ. 493:291–297. doi:10.1016/j.scitotenv.2014.06.002
- Singh, K.P., A. Malik, S. Sinha, and P. Ojha. 2008. Liquid-phase adsorption of phenols using activated carbons derived from agricultural waste material. J. Hazard. Mater. 150:626–641. doi:10.1016/j.jhazmat.2007.05.017
- Stavropoulos, G.G., and A.A. Zabaniotou. 2005. Production and characterization of activated carbons from olive-seed waste residue. Microporous Mesoporous Mater. 82: 79–85. doi:10.1016/j.micromeso.2005.03.009
- Sun, K., and J.C. Jiang. 2009. Review on research progress and development trend of activated carbon at home and abroad. Chem. Ind. Forest Prod. 29:98–104. doi:10.3321/j.issn:0253-2417.2009.06.021
- Suzuki, R.M., A.D. Andrade, J.C. Sousa, and M.C. Rollemberg. 2007. Preparation and characterization of activated carbon from rice bran. Bioresour. Technol. 98:1985–1991. doi:10.1016/j.biortech.2006.08.001
- Xiao, Y., C. De Araujo, C.C. Sze, and D.C. Stuckey. 2015. Controlling a toxic shock of pentachlorophenol (PCP) to anaerobic digestion using activated carbon addition. Bioresour. Technol. 181C:303–311. doi:10.1016/j.biortech.2015.01.080
- Yuen, F.K., and B.H. Hameed. 2009. Recent developments in the preparation and regeneration of activated carbons by microwaves. Adv. Colloid Interface Sci. 149:19–27. doi:10.1016/j.cis.2008.12.005
- Zhao, S., J.Y. Liu, S.Y. Chen, L.L. Shi, Y.J. Liu, and C. Ma. 2011. Antioxidant potential of polyphenols and tannins from burs of Castanea mollissima Blume. Molecules 16:8590–8600. doi:10.3390/molecules16108590