
ABSTRACT
It is estimated that there is sufficient in-state “technically” recoverable biomass to support nearly 4000 MW of bioelectricity generation capacity. This study assesses the emissions of greenhouse gases and air pollutants and resulting air quality impacts of new and existing bioenergy capacity throughout the state of California, focusing on feedstocks and advanced technologies utilizing biomass resources predominant in each region. The options for bioresources include the production of bioelectricity and renewable natural gas (NG). Emissions of criteria pollutants and greenhouse gases are quantified for a set of scenarios that span the emission factors for power generation and the use of renewable natural gas for vehicle fueling. Emissions are input to the Community Multiscale Air Quality (CMAQ) model to predict regional and statewide temporal air quality impacts from the biopower scenarios. With current technology and at the emission levels of current installations, maximum bioelectricity production could increase nitrogen oxide (NOx) emissions by 10% in 2020, which would cause increases in ozone and particulate matter concentrations in large areas of California. Technology upgrades would achieve the lowest criteria pollutant emissions. Conversion of biomass to compressed NG (CNG) for vehicles would achieve comparable emission reductions of criteria pollutants and minimize emissions of greenhouse gases (GHG). Air quality modeling of biomass scenarios suggest that applying technological changes and emission controls would minimize the air quality impacts of bioelectricity generation. And a shift from bioelectricity production to CNG production for vehicles would reduce air quality impacts further. From a co-benefits standpoint, CNG production for vehicles appears to provide the best benefits in terms of GHG emissions and air quality.
Implications: This investigation provides a consistent analysis of air quality impacts and greenhouse gas emissions for scenarios examining increased biomass use. Further work involving economic assessment, seasonal or annual emissions and air quality modeling, and potential exposure analysis would help inform policy makers and industry with respect to further development and direction of biomass policy and bioenergy technology alternatives needed to meet energy and environmental goals in California.
Introduction
The State of California mandated the proliferation of clean energy technologies with the adoption of the Global Warming Solutions Act Assembly Bill 32. California has a long history of environmental innovations and regulations that have improved air quality significantly throughout the last four decades, and there is a renewed commitment to environmental stewardship that includes reducing greenhouse gas (GHG) emissions. Sustainable bioenergy is being considered as part of the mix of renewable energy technologies that will help reduce GHG emissions. Bioenergy technologies and resources can provide a range of economic and environmental benefits to the state. Bioenergy can be garnered from digester gas, landfill gas, and biomass resources to produce electric power, heat, and/or renewable gaseous or liquid fuels. Renewable liquid or gaseous biofuels can be used for stationary or vehicular applications. The California Air Resources Board (ARB) has adopted regulations to promote renewable electric power and renewable transportation fuels through the Renewable Electricity Standard and the Low Carbon Fuel Standard. These standards require significant reductions in greenhouse gas emissions. A suite of solutions will be required, including the use of biomass and biogas, among other types of renewable resources. The use of bioresources could introduce additional emissions that need to be assessed in order to meet strict clean air standards while reducing greenhouse gas emissions. Few studies have addressed the air pollution aspects of biomass use in California (Springsteen et al., Citation2011; Watson et al., Citation2011). This study provides a first look at the combined potential effects of various biomass use pathways on greenhouse gas and air pollutant emissions and resulting effects on air quality.
This modeling study assesses the potential implementation of biomass infrastructure to determine preferred uses and strategies for use of California’s renewable resources. First, biomass resources are described and potential for electric power and fuel production is evaluated. Then, emissions of greenhouse gases and criteria pollutants of different fuel paths for biomass and biogas utilization are quantified. Finally, the resulting emissions are spatially and temporally resolved for subsequent use in air quality modeling to account for atmospheric chemistry and transport to determine the overall air quality impacts of the new biomass and biogas infrastructure. The analysis of both greenhouse gases and criteria pollutants provides a scientific basis to evaluate the potential co-benefits of biomass and biogas use for air pollution control and climate change mitigation strategies.
Biomass resources
Biomass contributes more than 5700 gigawatt-hour (GWhr) to California’s in-state renewable power (this is about 19% of in-state renewable power and 2% of full California power mix) (California Energy Commission [CEC], Citation2010). The main biomass resources that contribute to biopower are solid residues—forest and agricultural waste and urban green clippings—and biogas sources from landfills, wastewater treatment plants, and animal manure. The location of existing biomass facilities are presented in .
Figure 1. Capacity and location of existing biomass facilities in California. (Data from CBC, Citation2013.)
Forestry, agricultural waste, and urban green clippings, which constitutes the largest portion of solid biomass available in the state of California, is mostly distributed along the Central Valley and the northern part of the state. In the Central Valley, there is a high concentration of agricultural activities that generate high volumes of waste. The northern counties of California are populated with forests that provide a source of forestry waste that can be utilized for biopower. The total capacity installed by these installations is 725 MW, from which 155 MW are co-produced with heat for process heating. Approximately half of the bioelectricity capacity is produced with stokers, which is the oldest technology, whereas the other half is produced by fluidized bed technology. Only one small installation of 100 kW consists of a gasification unit.
Municipal solid waste (MSW) constitutes the second major contributor to total biomass in California. The main process for disposal of MSW in the state is accomplished by landfills. MSW decomposes, producing biogas that is collected, and then it is flared or fueled to an engine to produce power. The location of major landfills is generally in the outskirts of highly populated areas. Thus, in California, the largest landfills are around the Los Angeles metropolitan area, San Diego, and the Bay Area. Currently, the total capacity of bioelectricity installed or planned in landfills is 371 MW, largely produced by gas turbines and reciprocating engines. Typically, the heat demand in landfills and surroundings is low, which is a disincentive for combined heat and power plants.
Biogas from wastewater treatment plants (WWTPs) and animal manure is another source of bioresources. WWTPs are generally located around highly populated areas, and the largest facilities are around the Los Angeles metropolitan area, San Diego, Sacramento, and the Bay Area. The largest fraction of bioelectricity is generated by gas turbines and reciprocating engines. The current bioelectricity capacity from WWTP facilities is 85 MW, and, in addition, there are three facilities that produce 7.8 million standard cubic feet per day (MMscfd) of clean gas that is pipelined to adjacent installations to produce heat (California Biomass Collaborative [CBC], Citation2013). Bioelectricity facilities that operate on biogas from the anaerobic digestion of animal manure are mainly located in the Central Valley. These installations add a total of 3.8 MW of bioelectricity, which is typically produced by reciprocating engines.
In addition to bioelectricity facilities, there are nine facilities in the state that produce biogas from anaerobic digestion of food processing residue. The gas is used primarily to produce process heat that can be utilized for industrial processing. In addition, there are 17 facilities in California that use a variety of feedstocks that include waste oils and fats, corn, and sorghum, to produce a total of 179 million gallons per year (MGY) of ethanol and 62.1 MGY of biodiesel (CBC, Citation2013).
Potential for renewable natural gas production
Potential for renewable synthetic natural gas (RSNG) production is calculated assuming a fraction of carbon mass in solid residue (). For this study, the carbon content in grass is assumed as a conservative estimate for forest and agricultural wastes. From the total carbon content in the residue, RSNG plants can achieve methane yields that range from 60% to 73% of maximum methane forming potential (Zwart et al., Citation2006). The range in yields depends on the configuration of the gasification process and the management of ashes formed. For this study, RSNG potential is calculated using the lowest value as a conservative estimate.
Table 1. Carbon contents of selected solid residues.
presents the maximum technical potential for biomethane production via RSNG from biogas and biomass resources in the state of California. The total biomethane potential from biogas and biomass is more than 1.1 × 10⁶ million British thermal units (MMBTU)/day. Assuming that compressed natural gas (CNG) has an equivalency of 7.74 and 6.81 gallons of gasoline and diesel equivalent per MMBTU, respectively, this potential translates to approximately 8.9 and 7.8 million gallons of gasoline and diesel equivalent, respectively. Considering that projections from the Emissions Factor (EMFAC) (ARB, Citation2014) suggest that gasoline consumption in 2020 will be 56.4 million gallons per day of gasoline and 12.9 million gallons of diesel per day, CNG from biomass could potentially meet fuel demand of nearly 16% of gasoline vehicles or of 61% of diesel vehicles in California.
Table 2. Maximum technical potential for biomethane production from biogas and biomass and potential for cellulosic ethanol production from solid biomass.
Biomass scenarios
Description of biomass scenarios
The list of scenarios analyzed in this study is designed to estimate the potential impacts of biomass use for bioelectricity using current technologies and the potential effects of technological improvements for bioelectricity production and of switching from bioelectricity to biofuel production. The analysis is solely based on air pollutant and greenhouse gas emissions and does not consider economic parameters to determine the plausibility of the technology options. Throughout the paper, the maximum potential for biomass utilization refers to the maximum technically recoverable bioresources. Maximum potential considered in this paper includes resources that are practical to recover in a sustainable manner and excludes bioresources from steep slopes and riparian zones in forests and from agricultural residue that is left in the field.
The list of scenarios is the following:
No biomass: this case removes the emissions from current biomass installations. This scenario is simulated to estimate the contribution of current biomass facilities on air quality. The bioelectricity capacity removed from the state is compensated with an increase in power production in the state, which includes natural gas power plants. Emissions from natural gas extraction are assumed to occur outside of California because most natural gas is imported.
Current bioelectricity capacity: this case assumes that current biomass installations are operating to produce power. This case is considered the reference (baseline) case for the analysis of biomass scenarios. Installed capacity of biogas-to-energy in the state is estimated to be 371 MW from landfill gas, 85 MW from digester gas from wastewater treatment plants, and nearly 4 MW from animal manure digester gas. There are approximately 725 MW of installed and operating solid-fuel bioenergy capacity in California (consuming forest, agricultural and urban residue) (CBC, Citation2013).
Maximum technical potential for bioelectricity production with current technology: this scenario represents the worst-case scenario, as it assumes the highest penetration of biomass use with the highest emissions for bioelectricity production. Potential biogas power capacity is approximately 175 MW from cow/cattle manure, 650 MW from landfill gas, 185 MW from food waste/green waste in current disposal stream, and 120 MW from waste water treatment plants (does not include potential from food processing residues). Potential solid-fuel power generation capacity is approximately 620 MW from agricultural residues, 1910 MW from forestry resources, and 1000 MW from the organic fraction of municipal solid waste (Williams et al, Citation2008). The total capacity in this case is 4660 MW, which represents the maximum power capacity based on current biogas resources.
Maximum technical potential for bioelectricity production with technology and emissions upgrade: this case assumes a shift in technology for both biogas and solid-fuel installations with respect to case 3. For biogas installations, fuel cells are used instead of internal combustion engines. For biomass installations, biomass integrated gasification combined cycle system is used instead of solid-fuel boilers. The end product is electricity. This scenario represents the best-case scenario for bioelectricity production, as it assumes the highest penetration of biomass use with the lowest emissions for bioelectricity production. This case illustrates the potential air quality benefits of technology improvements with respect to the worst case.
Maximum production of CNG from biomass for vehicle consumption: This scenario assumes that biogas is cleaned and upgraded to biomethane and compressed to be used for CNG vehicle fueling. Solid biomass is converted to Renewable Synthetic Natural Gas (RSNG) through gasification and methanation and then compressed for fuel for CNG vehicles. Emissions from CNG vehicles are added and emissions from gasoline vehicles are displaced. Emissions from gasoline marketing in California are also reduced due to the shift to CNG. Emissions from petroleum refining are not modified, because it is assumed that the refining capacity will remain the same, and the excess gasoline will be exported.
Emissions from biomass scenarios
The analysis of the emissions from all scenarios includes four major contributors to total emissions from biomass use: (1) feedstocks, (2) collection and transport, (3) conversion, and (4) savings.
Feedstocks: emissions from feedstocks refer to all the upstream emissions that occur during the production of (1) diesel required by machinery used for biomass collection and transport; and (2) electricity required by processing plants, compressors, and blowers. For this study, sources of feedstock emissions include full-cycle emissions from diesel production and emissions from electricity production. These include all upstream emissions: extraction of crude oil, coal, and natural gas required for diesel and electricity production.
Collection and transport: emission from collection and transport is only considered for the collection of forest residue. This study assumes that any other solid residue (e.g., MSW, agricultural residue) is collected regardless of whether the residue is used for biopower production. As a result, production of power or fuels from residues other than forestry waste does not incur in additional collection and transportation emissions; hence, no emissions from this stage are accounted for.
Conversion: emissions from conversion include all direct emissions that occur in the biomass processing plant. Conversion processes include combustion of biomass or biogas in bioelectricity production, partial oxidation of biogas in the biogas cleanup process, and gasification of biomass for the production of synthesis natural gas.
Savings: emission savings include all the emissions displaced by the production of power and fuels from biomass. When biogas and biomass are used to produce bioelectricity, emissions from the production of the same amount of power using California’s grid should be subtracted. Similarly, when biogas and biomass are used to produce pipeline-grade natural gas, emissions from the production of California natural gas are subtracted. In the specific case that biomass is used to produce CNG to fuel gasoline vehicles, emissions from the production of equivalent gasoline fuel need to be subtracted. In addition, emissions from switching from conventional gasoline vehicles to CNG vehicles need to be accounted for.
The analysis is focused on the emissions of nitrogen oxides (NOx), particulate matter (PM), and greenhouse gases expressed as emissions of carbon dioxide (CO2) equivalent. NOx and PM are particularly relevant criteria pollutants for the formation of ozone and PM in California. Emissions of CO2 equivalent include contribution of methane (CH4) and nitrous oxide (N2O).
Conversion of solid biomass
Emissions from forest residue for electricity production are presented in . Emissions from biomass collection are based on a comprehensive life-cycle assessment of biomass collection in California (Cooper, Citation2008). The life-cycle analysis included an estimate of fuel use, hours of operation, and mass of forest residue collected and processed by over 20 different types of off-road equipment. Collection of forest biomass included both commercial thinning in plantations and industrial forest lands and fire prevention operations in public lands. Emission factors from biomass collection equipment are based on agricultural and logging equipment included in ARB’s off-road emissions model, OFFROAD 2007 (ARB, Citation2015b). Biomass transportation assumes an average trip length of 60 miles from collection site to biomass plant. The biomass boiler emissions are based on the values used by CA-GREET 1.8b (ARB, Citation2015c), which is in the range of emissions of biomass boilers inventoried by the California Biomass Collaborative.
Table 3. Emissions from forest biomass use for bioelectricity production.
In addition to direct emissions, presents indirect emissions from the production of fuels required to operate the equipment to collect, preprocess, and transport the forest residue. In total, collection and transport use 3.32 and 0.22 gallons of diesel per bone-dry ton (BDT) of biomass, respectively. Emissions from diesel production are based on the values used by CA-GREET 1.8b. More than 90% of NOx, carbon monoxide (CO), PM, and sulfur oxides (SOx) occur during combustion of biomass to produce power. Conversion also contributes to nearly 98% of total greenhouse gas emissions. Hence, any emission reductions in the conversion stage will reduce the potential impacts of solid biomass use.
Combustion of solid biomass can be substituted with a gasification unit, which could reduce emissions of air pollutants. Schueltze et al. (Citation2010) conducted an analysis of several technological options for forest residue, and the overall performance characteristics are presented in . Just using current technology, switching from a direct fired boiler to an integrated gasification combustion unit, criteria pollutant emissions are reduced by an order of magnitude. In addition, next-generation thermochemical conversion of solid biomass based on an integrated biofuels and energy production (IBEP) plant, NOx and SOx emissions from bioelectricity from solid biomass could be further reduced. An additional benefit of using integrated gasification is an increase in efficiency in electricity production. Increasing power production from biomass will reduce the electricity needed from central power plants, hence potentially reducing emissions from the electric grid.
Table 4. Performance characteristics and emission factors for four different biomass energy plants (Schuetzle et al. Citation2010).
The IBEP plant (Shueltze et al., 2008) is an example of next-generation biofuel production facility that integrates power and ethanol production. Other applications for biomass include the production of synthetic natural gas, which can then be used for heat and power generation. Natural gas can also be compressed to produce CNG for vehicle or used in the synthesis of Fischer-Tropsch fuels. There are numerous pilot plants and full-scale operations in Europe and the United States (European Biofuels Technology Platform [EBTP], Citation2015). Because there is no available information on emissions from a synthesis gas installation, emissions for synthetic natural gas production are assumed to be similar to those from the next-generation thermochemical bioalcohol plant reported by Schueltze et al. (Citation2010).
Conversion of biogas
Generation of bioelectricity from biogas—landfill gas or digester gas—involves generally two steps: transmission from the point of biogas generation to the bioelectricity plant, and conversion of the biogas in an engine, turbine, fuel cell, or boiler.
presents the emissions from bioelectricity production from landfill gas using a Best Available Control Technology (BACT) engine (South Coast Air Quality Management District [SCAQMD], Citation2003). The only direct emissions from this process occur in the combustion of biogas in the engine. Indirect emissions are accounted for the production of the electricity consumed by an electric blower. The emissions correspond to California marginal grid, obtained from CA-GREET 1.8b. The required power to transmit the biogas to the bioelectricity plant is based on estimates by ARB, following the recommended Low Carbon Fuel Standard pathway for CNG from landfill gas (ARB, Citation2015a). Except for PM10 (PM with an aerodynamic diameter < 10 μm), direct emissions contribute to more than 95% of total emissions of criteria pollutants. Indirect PM10 emissions are largely dominated by extraction of natural gas and petroleum products to produce the electricity in California. Finally, direct emissions of greenhouse gases constitute 98.5% of total emissions from bioelectricity production from landfill gas.
Table 5. Emissions from landfill gas (LFG) use for bioelectricity production.
Use of biogas from manure to produce bioelectricity is similar to the process for landfill gas-to-energy applications. The two main processes required for bioelectricity generation from digester gas are compression using an electric blower and conversion of biogas in an engine to produce power. The emissions assumed for the engine using digester gas are based on BACT guidelines (SCAQMD, Citation2002) and are comparable to the emissions from a landfill gas engine. Based on ARB estimates for a dairy biogas installation, the energy required for the electric blower is 22,209 BTU per MMBTU of recovered biogas (ARB, Citation2015a). Per unit of energy in the biogas, the required energy for the electric blower in a manure digester gas installation is more than twice the energy required in a landfill gas installation. As a result, the indirect emissions from digester gas recovery are more than twice as much as the emissions from collection of landfill gas. Because digester gas recovery is more energy intensive than landfill gas recovery, the contribution of indirect emissions from digester gas doubles the contribution of indirect emissions from landfill gas recovery for bioelectricity production. For example, indirect emissions of NOx add up to 4.4% of total emissions, and indirect emissions of PM10 correspond to 19.6% of total emissions. It is important to note, however, that a large fraction of indirect emissions from electricity use are related to the extraction of natural gas and other fuels required for electricity production. California imports over 90% of the natural gas it consumes (CEC, Citation2013); hence, most of the extraction of natural gas occurs outside of the state, thus having no effect on local air quality.
Table 6. Performance and emission comparison between a biogas engine and a fuel cell.
As in the case of solid biomass, emissions from bioelectricity using biogas are dominated by the conversion stage. Reduction in the emissions from combustion of biogas in engines will reduce the overall impact of bioelectricity on air quality. California Air Resources Board established emission standards for distributed generation facilities that limit the emissions from biogas generators substantially (ARB, Citation2006). These limits are applicable for installations that are exempt from air district regulations, but the South Coast Air Quality Management District adopted the same restrictive limits. There are already several installations that use biogas to run microturbines to generate power and heat and which have been certified by ARB to meet the restrictive air emission standards (ARB, Citation2013). In addition to microturbines, biogas can be used in fuel cells, which emit at a lower rate than any other technology. In particular, emissions from fuel cells are 2 orders of magnitude lower than a biogas engine. Hence, the use of fuel cells to produce power from biogas would significantly reduce the emissions from bioelectricity production. presents a comparison of emissions between an engine and a fuel cell.
Emissions displacement from biomass use
The assessment of the impacts of biomass needs to account for any displacement of emissions that the use of biomass may provide. For example, new bioelectricity production from biomass will displace power generation that otherwise would have been produced by the existing California grid. New fuel production from biomass, whether it is CNG or ethanol, will displace fuel production and consumption that otherwise would have been produced by the current infrastructure of oil refineries in the state. For CNG vehicles, in addition to the emissions displaced from gasoline marketing, emission changes due to the shift from gasoline to CNG engines must also be accounted for. It is unlikely that a decrease in gasoline demand would translate into a decrease in petroleum refining. For the full-fuel-cycle assessment of emissions, this study assumes that use of CNG would displace petroleum production. Emission displacement is based on CA-GREET 1.8b values for gasoline production and marketing in California (). However, for air quality modeling, even though CNG from biomass could displace up to 16% of gasoline consumed in the state, petroleum refining will remain unaffected, as the excess in production could be exported to other parts of the United States. Emissions from petroleum marketing that involves transporting fuel to fueling stations would be affected if gasoline is displaced significantly by CNG. Finally, evaporative and exhaust emissions of volatile organic compounds (VOCs) from CNG vehicles are reduced by 50% and 10%, respectively, relative to conventional gasoline vehicles (reported by CA-GREET 1.8b).
Table 7. Emissions from gasoline production assumed to determine emissions displacement of CNG production for vehicles (from CA-GREET1.8b).
Summary of emissions from biomass scenarios
presents the full-fuel-cycle emissions for all scenarios. As described above, emissions from conversion dominate the overall emissions from bioelectricity production. Direct emissions of NOx from current facilities (conversion) are approximately 45 tons/day and increase to up to 157 tons/day in the case of maximum technical potential for bioelectricity production. Total statewide emissions for 2012 are 2162 tons/day and are expected to decrease to 1610 tons/day by 2020 (ARB, Citation2014). This implies that emissions from current bioelectricity plants contribute to 2.1% of total statewide NOx emissions. In addition, assuming that the maximum technical potential could be achieved by 2020 using current technology, potentially direct emissions from bioelectricity would contribute to 10% of total statewide NOx emissions by 2020. If indirect emissions and emission savings are accounted, maximum emissions would contribute 128 tons/day, nearly 8% of total statewide NOx emissions by 2020.
Figure 2. Summary of emissions from biomass scenarios.
Emissions of PM from current facilities are approximately 5 tons/day and increase to up to 17 tons/day in the case of maximum technical potential. Statewide PM emissions are 1963 tons/day in 2012 and 1921 tons/day in 2020. Hence, the contribution from bioelectricity could grow from 0.3% with current facilities to 0.9% in 2020 with maximum technical potential for bioelectricity production using current technology. The impact of bioelectricity on primary PM is less pronounced than the effect on NOx emissions. However, it is important to note that NOx can participate in the formation of secondary PM. Consequently, to account for the overall effect of biomass use on PM concentrations in the state, air quality simulations are required to quantify the formation of secondary PM in addition to the contribution from direct PM emissions.
Emissions of CO2 equivalent are approximately 37,000 tons/day and could increase up to 151,700 tons/day in the maximum technical potential case. Statewide GHG emissions are 460 million tons of CO2,eq per year in 2012 (1.2 million tons/day) and projected to grow up to 600 million tons/year in 2020 (1.64 million tons/day), in a business-as-usual projection (ARB, Citation2014b). With these GHG emission estimates, bioelectricity production contributes to nearly 3% in total in-state CO2,eq emissions currently and could increase to 9.2% in 2020.
NOx and CO2 emissions from bioelectricity using current technology are higher than the sum of direct and indirect emissions generated from producing the same amount of electric power by the existing grid. On the contrary, savings in PM for both biogas and biomass applications are larger than direct emissions, and as a result, net PM emissions from bioelectricity the entire fuel cycle are negative. However, it is important to note that for NOx and PM, some of the emission savings occur out of state. Emission savings include emissions from the extraction of natural gas and other fuels in other parts of the country and the world that are required for power generation.
Implementing technology upgrades results in a significant decrease in direct emissions of criteria pollutants with respect to the case with current technology. Direct GHG emissions do not change, as the same amount of carbon is converted into CO2, but because of the increase in efficiency in power generation, emission savings are also increased with respect to the case with maximum technical potential and current technology.
Maximum production of CNG from biomass for vehicle consumption produces considerably lower direct emissions from conversion and higher emissions from feedstocks than in the previous cases, because more energy is required to clean up biogas and synthesis gas and to compress them. Emission displacement is due to the savings in gasoline production and marketing needs that production of CNG from biomass provides. In addition, the case includes savings in VOC emissions from vehicles switching from gasoline to CNG consumption (not shown). If CNG substitutes diesel, higher emission savings would be attained as full-fuel-cycle emissions of GHG during diesel production are 16% higher than for gasoline production, based on GREET estimates.
presents the total net emissions of scenarios that assume maximum technical potential for biomass use. For NOx and PM, only the emission savings within the state are accounted for. In summary, from a full-fuel-cycle perspective, the use of biomass to produce vehicle fuels appears as the best option to minimize GHG emissions. Applying technology upgrades and emission controls for bioelectricity production can mitigate criteria pollutant emissions, but CNG from biogas and gasification of biomass achieves comparable emissions of criteria pollutants and lower GHG emissions. In addition to direct emission savings due to the production of bioelectricity and biofuels, additional emission credits should be considered when balancing air pollutant emissions from biomass use. Biogas should be at least flared if not used for bioelectricity or CNG; hence, flare emissions should be considered as an additional emission savings or credit. For solid biomass, credits are not as clear as in the case for biogas. Springsteen et al. (Citation2011) used prescribed burning as a reference of emission credits for woody biomass waste. However, prescribed burning is being limited in California due to air quality concerns, and if permitted, it occurs in specific days to minimize air quality impacts. Thus, emission credits for criteria pollutants may not be applicable during smog episodes. Potential emission credits from flaring and prescribed burning are included in . All scenarios present lower emissions of GHG than the corresponding emission credits, indicating that all scenarios would result in a net reduction in GHG emissions.
Table 8. Summary of net emissions from selected scenarios (in tons/day for NOx and PM, and 103 tons/day for CO2,eq).
Air quality modeling
Modeling framework
Tropospheric ozone is a product of photochemistry between NOx and volatile organic compounds (VOCs) in the ambient atmosphere in the presence of sunlight. In California, NOx and VOCs are mostly emitted from anthropogenic sources such as on-road and off-road vehicles, power plants, and industrial operations, although there are significant biogenic sources of VOCs (ARB, Citation2009b). Ozone concentrations depend on spatial and temporal profiles of precursor emissions, meteorological conditions, transport of precursors and reaction products through, and removal processes such as deposition and chemical reaction.
This study uses the Community Multiscale Air Quality (CMAQ, version 4.7.1) model (Byun and Ching, Citation1999). CMAQ is a comprehensive air quality modeling system that solves numerically atmospheric chemistry and transport and is used in air quality regulatory applications (Appel et al., Citation2008; Foley et al., Citation2010). The chemical mechanism selected in this study to be used with CMAQ is CB05CL (Sarwar et al., Citation2008), which includes the photochemical formation of ozone, oxidation of volatile organic compounds, and formation of organic aerosol precursors. The spatial resolution of the modeling domain is 4 km × 4 km over the entire state, and a vertical height of 10,000 m above ground, with 30 layers of variable height based on pressure distribution.
Meteorological input data for CMAQ was obtained from the Advanced Research Weather Research and Forecasting Model, WRF-ARW (Skamarock et al., Citation2005). The National Centers for Environmental Prediction (NCEP) Final Operational Global Analysis 1° × 1° grid data (NCEP, Citation2005) were used for WRF-ARW initial and boundary conditions. Two meteorological episodes were simulated: July 7–13, 2005, a summer period with high observed ozone concentrations, and December 1–7, 2005, a winter period with high PM concentrations.
Baseline emissions were obtained from the 2005 U.S. Environmental Protection Agency (EPA) National Emissions Inventory (EPA, Citation2011) and processed using the Sparse Matrix Operational Kernel Emissions (SMOKE) model (www.smoke-model.org). For the biomass scenarios, 2005 baseline emissions were projected to the year 2020, using ARB estimates (ARB, Citation2014a).
Model performance evaluation was conducted using observations from ARB’s air quality monitoring network. Hourly measurements for ozone from 145 stations and daily average for PM2.5 (PM with an aerodynamic diameter <2.5 μm) from 17 stations were used to calculate mean normalized bias (MNB) and mean normalized gross error (MNGE), recommended by the EPA for model evaluation (EPA, Citation2007). Model performance is within acceptable parameters recommended by EPA. Results are shown in .
Table 9. Summary of model performance for ozone and PM2.5.
Air quality impacts of biomass scenarios
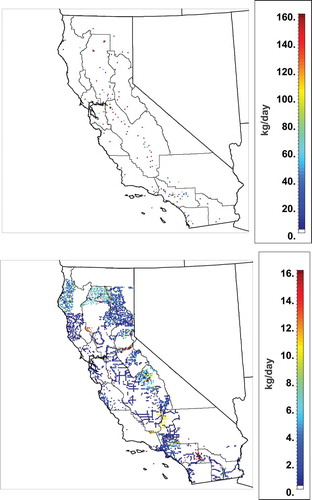
The emissions resulting from the biomass facilities and collection are spatially allocated in the modeling domain (). For the air quality impacts, it is assumed that the existing facilities will absorb the increase in biomass capacity. The increase in bioelectricity capacity assumed in the maximum technical potential bioelectricity cases is then scaled up from the existing facilities. This approach concentrates emissions from bioelectricity in some locations, which could overestimate the air quality impacts of some facilities. In addition to emissions from conversion, emissions from forest residue collection are also included. The spatial allocation of collection and transport is based on the forest residue potential at a county level and location of rural and urban roads in each county. All biomass facilities are assumed to operate constantly during the day, whereas collection and transport is assumed to occur from 8:00 a.m. to 6:00 p.m.
Figure 3. Locations of emissions from bioelectricity production for the maximum technical potential for bioelectricity production with current technology. (Top) NOx emissions from bioelectricity facilities. (Bottom) NOx emissions from forest residue collection.
The air quality results are discussed using the current bioelectricity capacity case as reference. Air quality impacts are expressed as the difference between a study case minus the reference case. Analysis of ozone is based on the difference in ozone concentration at the time where the maximum 1-hr average over the entire domain occurs. This way differences in ozone concentration are paired in time. Analysis of PM2.5 is based on average 24-hr difference between the cases. Simulations are conducted for two different episodes: a 1-week episode in July, which represents a high-ozone event with high PM concentrations, and a 1-week episode in December, which represents a high-PM episode, with low ozone concentrations. Discussion of results focuses on ozone in the summer episode and PM in both summer and winter. Concentration of ozone in the winter is generally low, and changes in ozone concentrations due to biomass use have no significance regarding the attainment of air quality standards. These simulations are meant to represent high smog events, for both summer and winter, to illustrate potential maximum air quality impacts. Namely, the impacts presented here should be considered as upper bounds for potential air quality impacts from biomass use. In spring or fall, during weather conditions that are not conducive to high pollutant concentrations, effects of these scenarios would be lower than what is presented here.
presents the impacts on ozone concentration produced by the four scenarios for the summer episode. The no biomass case leads to reduction in ozone concentrations in most of the northern half of the state (). Decreases in ozone are due to the removal of bioelectricity plants. Emissions from added central power generation to compensate for the loss of 1.26 GW do not cause a noticeable effect on ozone concentrations. Decreases in ozone levels surpass 3 ppb, which are important in areas such as the San Joaquin Valley, where high ozone concentrations occur constantly throughout the summer months.
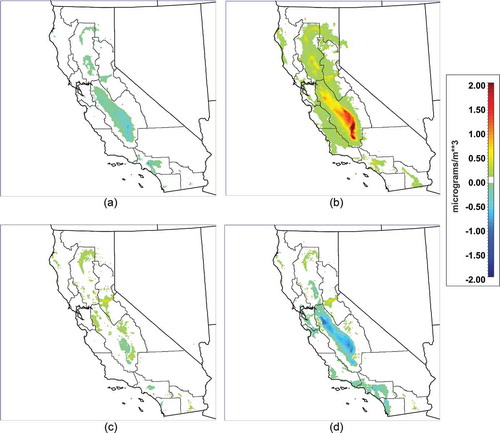
Figure 4. Changes in peak ozone concentrations due to biomass scenarios in a summer episode with respect to the baseline case: (a) no biomass case; (b) maximum bioelectricity production with current technology; (c) maximum bioelectricity production with enhanced technology; (d) maximum production of CNG from biomass for vehicle consumption.
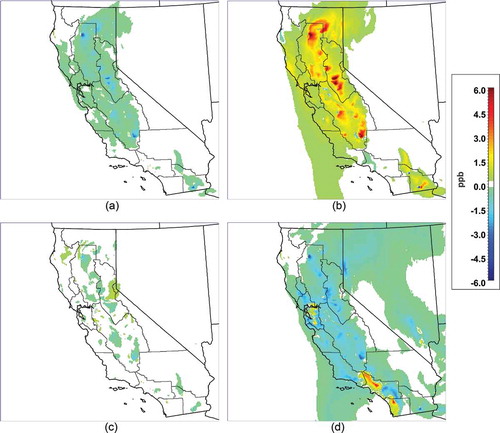
As expected, the case with maximum bioelectricity production with current technology experiences the highest impacts on ozone concentration (). Increases in peak ozone occur in large areas of Sacramento and San Joaquin Valley, the Mountain counties basin, and in the Salton Sea air basin in Southern California. Increases in ozone are localized around the bioelectricity facilities and downwind areas, and the magnitude of the increases exceeds 6 ppb. These increases in ozone concentration could seriously hinder the effort of air pollution control districts to attain ozone standards in areas such as the Central Valley.
The case of maximum bioelectricity production with technology and emission upgrade illustrates how emission controls could minimize the impacts of bioelectricity production on air quality (). The effect of this case on ozone concentration results in changes in ozone concentrations along the Central Valley that are 1 ppb or less. The increase in emissions from bioelectricity production is offset by decreases in the emissions from the existing bioelectricity plants. The result is that there are some areas in the Central Valley that experience decreases of over 1 ppb in peak ozone concentrations.
The case of maximum production of CNG from biomass for vehicle consumption illustrates the benefits of switching from bioelectricity production to fuel production (). The emissions from current biomass facilities are significantly reduced due to a much less emission-intensive CNG production compared with bioelectricity production. In addition, emissions from gasoline marketing, which are mostly VOC emissions, are reduced, as well as VOC evaporative and exhaust emissions from CNG vehicles. As a result, ozone concentrations are reduced throughout most of the state, achieving reductions similar to the no biomass case. Reductions in peak ozone are on the order of 4 pbb in areas close to some bioelectricity plants, in the Sacramento and San Joaquin valleys. There are two distinct regions in the South Coast Air Basin and San Diego, where ozone increases by nearly 5 ppb. This is due to the VOC-limited regime that predominates in those two regions. In a VOC-limited regime, moderate decreases in NOx emissions lead to an increase in ozone concentrations. CNG could be used also as a substitute of diesel. Emission savings from petroleum refining would be very similar to the emission reductions achieved by substituting gasoline emissions. In addition, total VOC emission reductions due to shifting from diesel to CNG would be similar to the reductions attained by switching to gasoline. As a result, the air quality benefits of switching from diesel to CNG are very similar to the ones obtained by switching from gasoline to CNG (results not shown).
presents the effects of the four scenarios on 24-hour average PM2.5 in the summer episode. As in the case of ozone concentration, the worst case as expected is the scenario with maximum bioelectricity production with current technology. The greatest changes in PM concentrations occur in the Central Valley. Even though bioelectricity production and forest residue collection generates emissions of PM, the biggest effects on PM are due to the formation of ammonium nitrate. Nitric acid is formed from the oxidation of NOx and then reacts with ammonia present in agricultural regions such as the San Joaquin Valley. Removal of bioelectricity production in the no biomass case leads to maximum reductions of PM2.5 concentrations that are less than 1 μg/m3 (). Conversely, the case with maximum technical potential with current technology produces increases in PM2.5 that exceed 2 μg/m3 in areas around Bakersfield and Visalia (). The San Joaquin Valley experiences the highest increases in PM2.5 amongst all air basins in California. This is important to note as the San Joaquin Valley experience high PM2.5 concentrations throughout the year, and efforts to curb PM2.5 concentrations could be hindered by widespread use of highly emitting biomass technologies.
Figure 5. Changes in 24-hr average PM2.5 concentrations due to biomass scenarios in a summer episode: (a) no biomass case; (b) maximum bioelectricity production with current technology; (c) maximum bioelectricity production with enhanced technology; (d) maximum production of CNG from biomass.
The effect of technology upgrade is minimal as well for PM2.5, with changes that are less than 0.5 μg/m3 (). Finally, the effect of switching from bioelectricity generation to CNG production shows moderate decreases in PM2.5 of 1 μg/m3 in the Central Valley and the South Coast Air Basin and decreases of less than 1 μg/m3 in San Diego, South Central, and San Francisco basins ().
presents the effects of the four scenarios on 24-hour average PM2.5 during the winter episode. Unlike ozone, formation of PM dynamics follows similar patterns in both summer and winter episodes. The no biomass case produces decreases of up to 1 μg/m3 in 24-hour average PM2.5 concentrations along the Central Valley, due to the removal of NOx emissions from bioelectricity plants (). The case with maximum technical potential with current technology produces increases of nearly 4 μg/m3 in most of the San Joaquin Valley and nearly 4 μg/m3 in the Sacramento Valley.
Figure 6. Changes in 24-hr average PM2.5 concentrations due to biomass scenarios in a winter episode: (a) no biomass case; (b) maximum bioelectricity production with current technology; (c) maximum bioelectricity production with enhanced technology; (d) maximum production of CNG from biomass.
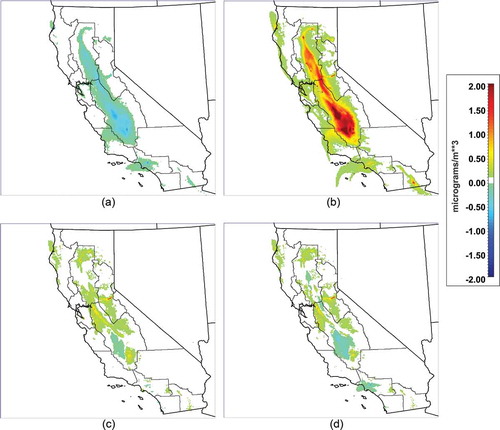
In addition, localized increases of 1–2 μg/m3 appear in the South Coast and Salton Sea air basins (). The other two cases—technology upgrade and shift to CNG for vehicles—present similar trends ( and ). Both cases experience moderate decreases of less 0.5 μg/m3 in PM2.5 in some areas of the San Joaquin Valley and increases of up to 1 μg/m3 in some areas of the Central Valley east from the Bay Area. The increases are attributed to direct emissions from collection and transport of forest residue.
Conclusion
This study assesses the emissions of greenhouse gases and air pollutants and estimates the resulting air quality impacts of new and existing bioenergy capacity throughout California. Bioresources are used to produce of bioelectricity and renewable NG. Emissions of criteria pollutants and greenhouse gases are quantified for a set of scenarios that span the emission factors for power generation and the uses of renewable natural gas for vehicle fueling. Emissions are estimated for the entire fuel cycle.
From the technically recoverable biomass resources, there is a potential for up to 4.66 GW of bioelectricity that could be installed in the state. With current technology and at the emission levels of current installations, maximum bioelectricity production could increase NOx emissions by 10% in 2020. Among the alternatives for biomass use, technology upgrades would obtain the lowest net emissions of criteria pollutant emissions among the scenarios. Conversion of biomass to CNG for vehicles would achieve emission reductions of criteria pollutants comparable to the case with enhanced technology but would achieve the lowest emissions of greenhouse gases. In summary, from a full-fuel-cycle perspective, use of biomass to produce vehicle fuels appears as the best option to minimize GHG emissions. Applying technology upgrades and emission controls for bioelectricity production can mitigate criteria pollutant emissions, but CNG from biogas and gasification of biomass achieves comparable emissions of criteria pollutants and lower GHG emissions. However, a large portion of emission savings for criteria pollutants occur outside the state. If only the emission savings within the state are accounted for, the case with technological advances for bioelectricity production becomes the most favorable scenario to minimize the impact of biomass use on criteria pollutant emissions, but CNG production for vehicles is still the most favorable for greenhouse gas emissions. Therefore, to determine the most favorable option between enhanced technology for bioelectricity and production of CNG for vehicles, it is a matter of a policy decision to determine what is most important for the state: to minimize GHG or to minimize air pollutant emissions.
Installing the maximum technical potential of bioelectricity production with current technology by 2020 would cause increases of over 6 ppb in ozone and 2 μg/m3 in PM concentrations in large areas of the Central Valley, where ozone and PM concentrations exceed air quality standards constantly throughout the year. Negative effects on PM would be expected in both summer and winter episodes. Air quality modeling results show that applying technological changes and emission controls would minimize the air pollutant emissions and resulting quality impacts of bioelectricity generation. A shift from bioelectricity production to CNG production for vehicles would reduce air quality impacts further, even though net emissions of NOx and PM from the CNG case are higher than in the enhanced technology case. Decreases in ozone concentrations due to CNG vehicles are partly due to decrease in VOC emissions from petroleum marketing and from evaporative and exhaust emissions from vehicles switching from gasoline to CNG. From a co-benefits standpoint, CNG production for vehicles appears to provide the benefits in terms of GHG emissions and air quality. However, GHG emission savings obtained from the CNG for vehicles scenario depend strongly on the RSNG yields in the biomass processing plants. These yields are based on experimental plants, as there are no commercial RSNG plants active in the United States.
Recently, assembly bill AB341 was passed to achieve 75% recycling of all waste including organic material by the year 2020, and AB1826 was targeted specifically to increase the diversion of organic waste and hence reducing the amount of waste sent to landfills. Before AB341 and AB1826 were passed, the CBC estimated that a capacity of 1690 MW could be met by landfill gas from MSW. The implementation of these new assembly bills will likely reduce the amount of biodegradable waste reaching landfills and, as a result, reducing the capacity for long-term production of landfill gas.
The California Biomass Collaborative reviewed the emission permits of 30 biomass facilities in the state of California. NOx emission factors range from 1.05 to 7.75 lbs/MWhr, with a capacity-weighted average of 2.3 lbs/MWhr. Installations in the Central Valley and Southern California tend to have stricter emission limits, whereas installations in northern counties can emit at higher levels. Maximum potential of biomass was based on the average value for emission factors. If new biomass facilities adopted the stricter limits (1.05 lbs/MWhr) instead of the average, increases in NOx direct emissions due to the maximum potential scenario would be half of what is shown in . Even with this lower emission factor, the case of maximum potential with current technology would be the case with highest total emissions of NOx.
Direct emissions of CO2 per unit of electricity are directly related to the carbon content of biomass and inversely proportional to plant efficiency. Per unit of energy in biomass, CO2 emissions from biomass combustion have low uncertainty (AP-42; EPA, Citation2003). Hence, uncertainty in CO2 direct emissions is expected to be significantly lower than CO2 indirect emissions and savings.
Emission savings are based on CA-GREET 1.8b, which is being used in the calculation of Low Carbon Fuel Standard (LCFS) pathway emissions by the California Air Resources Board. A newer version, CA-GREET 2.0, is being considered by ARB to replace the previous version (ARB, Citation2015c). Total full-fuel-cycle emissions from electricity production are higher in CA-GREET 1.8b than in CA-GREET 2.0. Even though emissions of CH4 and N2O increase considerably from feedstock procurement, full-cycle emissions of greenhouse gases decrease by 9.3%, if the current technology mix installed in California is assumed. Also, emissions of NOx decrease by 24% and emissions of PM decrease by 77%. This would results in lower full-cycle emission savings from bioelectricity production in California.
In addition, GHG emission savings obtained from the CNG for vehicles scenario depend strongly on the RSNG yields in the biomass processing plants. These yields are based on experimental plants, as there are no commercial RSNG plants active in the United States. With information from new plants such as the GoBiGas in Sweden (EBTP, Citation2015), the potential GHG savings could be refined by using real-world biomass-to-RSNG yields.
Biomass could be a large contributor to the renewable portfolio standard for the state. However, if California is to meet the air quality goals for nonattainment areas such as the San Joaquin Valley, it should minimize the impact of using biomass with advanced technologies such as fuel cells for biogas and gasification systems for solid residue. This investigation provides a consistent analysis of air quality impacts and greenhouse gas emissions for scenarios examining increased biomass use. These preliminary findings indicate that production of CNG from biomass is competitive with enhanced technologies for biopower in terms of minimizing air pollutant emissions. Further work involving economic assessment, seasonal or annual emissions and air quality modeling, and potential exposure analysis would help inform policy makers and industry with respect to further development and direction of biomass policy and bioenergy technology alternatives needed to meet energy and environmental goals in California.
Acknowledgment
The authors graciously acknowledge the guidance of their project manager, Ralph Propper.
Funding
This study was funded in whole by the California Air Resources Board, contract number 11-307. Results and discussion in this article do not necessarily reflect the views and policies of the California Air Resources Board.
Additional information
Funding
Notes on contributors
Marc Carreras-Sospedra
Marc Carreras-Sospedra is a research scientist in the Department of Mechanical and Aerospace Engineering of the University of California, Irvine.
Robert Williams
Robert Williams is a development engineer with the Department of Biological and Agricultural Engineering and the California Biomass Collaborative at the University of California, Davis.
Donald Dabdub
Donald Dabdub is a professor in the Department of Mechanical and Aerospace Engineering of the University of California, Irvine.
References
- Appel K.W., P.V. Bhave, A.B. Gilliland, G. Sarwar, and S.J. Roselle. 2008. Evaluation of the community multiscale air quality (CMAQ) model version 4.5: Sensitivities impacting model performance; Part II—Particulate matter. Atmos. Environ. 42:6057–6066.
- Bahor, B., M. Van Brunt, K. Weitz, and A. Szurgot. 2010. Life-cycle assessment of waste management greenhouse gas emissions using municipal waste combustor data. J. Environ. Eng. 136:749–755.
- Byun, D.W., and J.K.S. Ching. 1999. Science algorithms of the EPA Models—3. Community Multiscale Air Quality (CMAQ) Modeling System. EPA/600/R-99/03. Washington, DC: U.S. Environmental Protection Agency.
- California Air Resources Board. 2006. DG emission regulations. http://www.arb.ca.gov/energy/dg/2006regulation.pdf (accessed June 2015).
- California Air Resources Board. 2009b. CEPAM: 2009 Almanac—Standard Emissions Tool. http://www.arb.ca.gov/app/emsinv/fcemssumcat2009.php (accessed December 2013).
- California Air Resources Board. 2013. Current DG Executive Orders. http://www.arb.ca.gov/energy/dg/eo/eo-current.htm
- California Air Resources Board. 2014. EMFAC model. http://www.arb.ca.gov/msei/categories.htm#emfac2014.
- California Air Resources Board. 2014a. Emissions Inventory Data. http://www.arb.ca.gov/ei/emissiondata.htm.
- California Air Resources Board. 2014b. California Greenhouse Gas Emission Inventory Program. http://www.arb.ca.gov/cc/inventory/inventory.htm.
- California Air Resources Board. 2015a. Low Carbon Fuel Standard Program Pathways. http://www.arb.ca.gov/fuels/lcfs/workgroups/workgroups.htm#pathways.
- California Air Resources Board. 2015b. OFFROAD model documentation. http://www.arb.ca.gov/msei/categories.htm.
- California Air Resources Board. 2015c. CA-GREET model documentation. http://www.arb.ca.gov/fuels/lcfs/ca-greet/ca-greet.htm.
- California BiomassCollaborative. 2011. Unpublished estimates.
- California BiomassCollaborative. 2013. Unpublished internal database. http://biomass.ucdavis.edu/files/2013/09/11-20-2013-cbc-facilities-database_1May_2013_update.xlsx (last accessed January 2015).
- California Energy Commission. 2013. Natural gas supply to California, Energy Almanac. http://energyalmanac.ca.gov/naturalgas/natural_gas_supply.html.
- California Energy Commission. Energy Almanac. 2010. http://energyalmanac.ca.gov/electricity/total_system_power.html.
- Cooper, J. 2008. LCA of Producing Electricity from CA Forest Wildfire Fuels Treatment, Appendix 4. Biomass to Energy: Forest Management for Wildfire Reduction, Energy Production and Other Benefits. CEC-500-2009-080-AP4. Sacramento, CA: California Energy Commission.
- European Biofuels, Technology Platform. 2015. Bio-SNG (synthetic natural gas) and gasification technologies. http://www.biofuelstp.eu/bio-sng.html.
- Foley, K.M., S.J. Roselle, K.W. Appel, P.V. Bhave, J.E. Pleim, T.L. Otte, R. Mathur, G. Sarwar, J.O. Young, R.C. Gilliam, C.G. Nolte, J.T. Kelly, A.B. Gilliland, and J.O. Bash. 2010. Incremental testing of the Community Multiscale Air Quality (CMAQ) modeling system version 4.7. Geosci. Model Dev. 3:205–226. doi:10.5194/gmd-3-205-2010
- Fuel Cell Energy. 2013. Emission specifications for a fuel cell fueled with biogas. http://www.fuelcellenergy.com/why-fuelcell-energy/benefits/ultra-clean/.
- National Centers for Environmental Prediction. 2005. National Centers for Environmental Prediction/National Weather Service/National Center for Atmospheric Research/U.S. Department of Commerce. 2000, updated daily. NCEP FNL Operational Model Global Tropospheric Analyses, continuing from July 1999. Research data archive at the National Center for Atmospheric Research, Computational and Information Systems Laboratory. http://rda.ucar.edu/datasets/ds083.2 (accessed January 2012).
- Sarwar, G., S. Roselle, R. Mathur, W. Appel, R.L. Dennis, and B. Vogel. 2008. A comparison of CMAQ HONO predictions with observations from the northeast oxidant and particle study. Atmos. Environ. 42:5760–5770. doi:10.1016/j.atmosenv.2007.12.065
- Schuetzle, D., G. Tamblyn, and F. Tornatore. 2010. Appendix 10: Power plant analysis for conversion of forest remediation biomass to renewable fuels and electricity. In Report to the Biomass to Energy Project (B2E). Report to the California Energy Commission, January 2010. CEC-500-2009-080-AP10. Sacramento, CA: California Energy Commission.
- Skamarock, W.C., N.J. Klemp, J. Dudhia, D.O. Gill, D.M. Barker, W. Wang, and J.G. Powers. 2005. A Description of the Advanced Research WRF Version 2. NCAR technical note NCAR/TN-468+STR. Boulder, CO: University Corporation for Atmospheric Research, NCAR-UCAR.
- South Coast Air Quality Management District. 2002. Best available control technology (BACT) guidelines for a digester gas engine in the South Coast Air Quality Management District. http://www.aqmd.gov/docs/default-source/bact/laer-bact-determinations/aqmd-laer-bact/ic-engine-an-388050-1408-hp.doc.
- South Coast Air Quality Management District. 2003. Best available control technology (BACT) guidelines for a landfill gas engine in the South Coast Air Quality Management District. http://www.aqmd.gov/docs/default-source/bact/laer-bact-determinations/aqmd-laer-bact/ic-engine-a-n-391009-1850-hp.doc.
- Springsteen, B., T. Christofk, S. Eubanks, T. Mason, C. Clavin, and B. Storey. 2011. Emission reductions from woody biomass waste for energy as an alternative to open burning. J. Air Waste Manage. Assoc. 61:63–68. doi:10.3155/1047-3289.61.1.63
- Thomas, S.C., and A.R. Martin. 2012. Carbon content of tree tissues: A synthesis. Forests 3:332–352. doi:10.3390/f3020332
- U.S. Environmental Protection Agency. 2003. Wood Residue Combustion in Boilers, AP 42, Fifth Edition, Volume I, Chapter 1: External Combustion Sources. Technology Transfer Network, Clearinghouse for Inventories and Emission Factors. Research Triangle Park, NC: Office of Air Quality Planning and Standards, Office of Air and Radiation, U.S. Environmental Protection Agency, update 2003.
- U.S. Environmental Protection Agency. 2007. Guidance on the Use of Models and Other Analyses for Demonstrating Attainment of Air Quality Goals for Ozone, PM2.5, and Regional Haze. EPA-454/B-07-002. Research Triangle Park, NC: Regional Haze Office of Air Quality Planning and Standards, Air Quality Analysis Division, Air Quality Modeling Group, U.S. Environmental Protection Agency, April 2007.
- U.S. Environmental Protection Agency. 2011. Emissions Modeling Clearinghouse. 2005-based Modeling Platform. Research Triangle Park, NC: Technology Platform Network, Clearinghouse for Inventories and Emissions Factors, U.S. Environmental Protection Agency.
- Watson, J.G., J.C. Chow, A.L.-W. Chen, D.H. Lowenthal, E.M. Fujita, H.D. Kuhns, D.A. Sodeman, D.E. Campbell, H. Moosmüller, D. Zhu, and N. Motallebi. 2011. Particulate emission factors for mobile fossil fuel and biomass combustion sources. Sci. Total Environ. 409:2384–2396. doi:10.1016/j.scitotenv.2011.02.041
- Williams, R.B., M. Gildart, and B.M. Jenkins. 2008. An Assessment of Biomass Resources in California, 2007. California Biomass Collaborative, CEC PIER Contract 500-01-016.
- Zwart, R.W.R, H. Boerrigter, E.P. Deurwaarder, C.M. van der Meijden, and S.V.B. van Paasen. 2006. Production of Synthetic Natural Gas (SNG) from Biomass. ECN-E-06-018. Petten, the Netherlands: Energy Research Centre of The Netherlands.