
ABSTRACT
This study reports ambient concentrations of 63 air toxics that were measured in Canada by the National Air Pollution Surveillance (NAPS) program over the period 2009–2013. Measured concentrations are compared with ambient air quality guidelines from Canadian jurisdictions, and compounds that exceeded guidelines are identified and discussed. Although this study does not assess risk or cumulative effects, air toxics that approached guidelines are also identified so that their potential contribution to ambient air toxics pollution can be considered. Eleven air toxics exceeded at least one guideline, and an additional 16 approached guidelines during the study period. Four compounds were measured using methods whose detection limits exceeded a guideline value, three of which could not be compared with guidelines, since they were not detected in any samples. The assessment of several metal(loid) concentrations is tentative, since they were measured only in fine particulate matter (PM) but compared with guidelines based on coarse or total PM. Improvements to sampling and analysis techniques for the latter compounds as well as for those whose methods are subject to known uncertainties would improve confidence in reported concentrations and their relation to applicable guidelines. Analysis of sampling strategies for all compounds found to exceed or approach guidelines would contribute to ensuring that their spatiotemporal coverage is adequate. Examination of the air toxics not measured by NAPS but having guidelines in Canadian jurisdictions or being included in other programs such as the U.S. National-Scale Air Toxics Assessment (NATA) would contribute to ensuring that the full suite of pollutants relevant to ambient air quality in Canada is subject to adequate study. The results of this study can be applied to evaluating the effectiveness of toxic substances management in Canada.
Implications: Recent measurements of 63 air toxics in Canada by the National Air Pollution Surveillance (NAPS) program showed that 11 compounds exceeded daily or annual ambient air quality guidelines and that an additional 16 compounds approached such guidelines within an order of magnitude. The results of this study can be applied to evaluating the effectiveness of toxic substances management in Canada and to identifying compounds that merit further investigation.
Introduction
Air toxics, also known as hazardous air pollutants (HAPs), are contaminants that are known or suspected to cause cancer or other serious health effects (U.S. Environmental Protection Agency [EPA], Citation2012). In the United States, one way that HAPs are assessed is through the National-Scale Air Toxics Assessment (NATA) program, which models ambient concentrations, converts them to exposure values, and compares them with health-based reference values (EPA, Citation2013). Air toxics in that country have also been assessed using measured ambient air concentrations directly (Kyle et al., Citation2001; McCarthy et al., Citation2009; Kavouras et al., Citation2015).
Canada’s National Air Pollution Surveillance (NAPS) program is a joint federal/provincial/territorial initiative established in 1969. The program initially focused on measuring sulfur dioxide and particulate matter (Environment Canada, Citation2013). Since then, it has grown in scope and now tracks 340 compounds. The purpose of the NAPS program is to coordinate the collection of air quality data from existing provincial, territorial, and municipal air quality monitoring networks and to provide a unified Canada-wide air quality data set of uniform quality. Environment Canada coordinates the operation of the program, provides air monitoring instrumentation, calibration expertise and reference standards, operates laboratories for sample analysis, directs a national quality assurance program that includes field site auditing, coordinates the development of equipment specifications, and maintains the publicly available dataset.
Many air toxics are measured at NAPS sites, although the impetus for their inclusion has often been their potential contribution to air quality issues such as tropospheric ozone and particulate matter (PM). This study reports ambient HAPs concentrations measured by NAPS from 2009 to 2013 and compares them with ambient air quality guidelines from Canadian jurisdictions. The goal of the study is to identify air toxics that warrant further investigation in Canada. Such investigation could include detailing spatiotemporal variations for individual pollutants, evaluating the representativeness of network measurements, and determining cumulative risk.
Data and methods
Air toxics (HAPs) under consideration
The compounds considered in this study are the same as those considered in the U.S. National Air Toxics Assessment (NATA) program (EPA, Citation2013). The latter are drawn from the List of Hazardous Air Pollutants of the U.S. Clean Air Act (CAA) Amendments of 1990 (EPA, Citation2010) with the addition of diesel particulate matter.
The initial list of 188 NATA compounds has been narrowed to the 63 that were measured by the NAPS program over the study period. Polychlorinated biphenyls (PCBs) have been excluded, since only the 12 dioxin-like PCBs have been measured by NAPS and these represent a small fraction of total PCB mixtures (Schulz et al., Citation1989). Their contribution to dioxin total equivalents (TEQs) has been retained as described below. Two xylene isomers (m- and p-) were considered together, since the NAPS method used for these compounds measures them in combination.
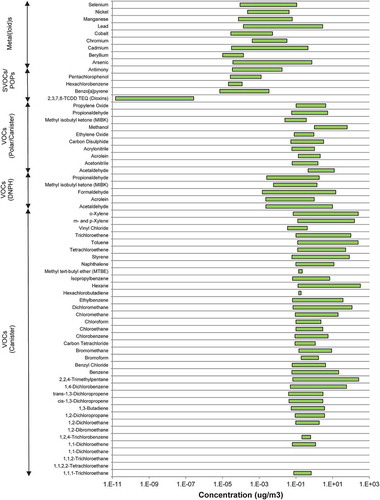
Ambient air concentrations for the 63 air toxics that have been considered in this study are shown in and listed in Table S1. Note that polycyclic organic matter (POM) is represented by benzo[a]pyrene and that 2,3,7,8-tetrachlorodibenzo-p-dioxin (2,3,7,8-TCDD) is represented by toxic equivalents calculated using the 2005 World Health Organization factors for dioxins, furans, and dioxin-like PCBs (Van den Berg et al., Citation2006). The cis- and trans-isomers of 1,3-dichloropropene have been reported individually, although it is their sum that appears on the U.S. CAA HAPs list.
Figure 1. Range of air toxics concentrations measured in Canada by NAPS from 2009 to 2013. Nondetectable concentrations have been replaced by average analytical detection limits in this figure only.
Sampling and analysis
All samples were collected following the procedures used across the NAPS program. Measured air toxics included volatile organic compounds (VOCs), semivolatile organic compounds (SVOCs) and persistent organic pollutants (POPs), and metals and metalloids. Sample analysis was conducted using well-defined methods as described below.
Volatile organic compounds (VOCs)
For analysis of aliphatic, aromatic, and halogenated hydrocarbons, air was collected in evacuated electropolished stainless steel canisters (BRC Rasmussen, Hillsboro, OR, USA, or Scientific Instrument Specialist, Moscow, ID, USA). Samples were collected every 3 days over 24 hr (midnight to midnight) in 6-L canisters except at nine rural sites where 3-L canisters were filled over 4 hr. The latter procedure was used to target biogenic hydrocarbons during their daily peak between noon and 4:00 p.m. local time. In this study, air toxics concentrations reported from those sites are assumed to represent daily averages.
Samples were cryogenically preconcentrated, cryofocused, and then thermally desorbed. Analysis was conducted by injection onto J&W Scientific DB-1 capillary columns (Agilent Technologies, Mississauga, ON) with gas chromatography/flame ionization detection (GC-FID; Agilent Technologies, Mississauga, ON) for C2 hydrocarbons and gas chromatography–mass spectrometry (GC-MS; GC: Agilent 6890/7890, MS: Agilent 5973 or 5975) for C3 to C12 hydrocarbons. A subset of polar VOC (PVOC) air toxics were subjected to cold trap dehydration through silica-coated stainless steel maintained at −20 °C and then analyzed by GC-MS as described above.
For analysis of select aldehydes and ketones, air was collected on silica gel Sep-Pak cartridges (Waters Limited, Mississauga, ON) coated with 2,4-dinitrophenylhydrazine (DNPH) and analyzed by high-performance liquid chromatography (HPLC) with diode array detection (DAD). This method is associated with reported uncertainties for formaldehyde, acetaldehyde, and acrolein (e.g., Herrington and Hays, Citation2012). Results reported herein for these compounds should therefore be considered tentative.
Analytical detection limits were determined as 3 times the standard deviation of seven replicate analyses of low-concentration standards. Reported detection limits are the averages of three sets of replicate analyses for the VOC and DNPH/HPLC methods and two sets of replicate analyses for the PVOC method. The practice of field blank analysis is not compatible with canister sampling. However, field blanks were collected for carbonyls measured by the DNPH/HPLC method; reported concentrations are blank-corrected. Further details of the sampling and analysis methods for VOCs can be found in Wang et al. (Citation2005).
Semivolatile organic compounds (SVOCs) and persistent organic pollutants (POPs)
Polycyclic aromatic hydrocarbons (PAHs) including benzo[a]pyrene (BaP), 2,3,7,8-tetrachlorodibenzo-p-dioxin (2,3,7,8-TCDD) toxic equivalents (TEQs), pentachlorophenol (PCP), and hexachlorobenzene (HCB) were collected on polytetrafluoroethylene (PTFE)-backed borosilicate glass fiber filters followed by two serial polyurethane foam (PUF) plugs using high-volume samplers. Depending on the site, samples were collected every 6 or 12 days over 24 hr (midnight to midnight). The filters and PUFs were analyzed together to determine total airborne concentrations.
Samples destined for SVOC/POP analysis were spiked with known amounts of isotopically labeled surrogate standards and then extracted by Soxhlet apparatus for 16–20 hr. Extraction solvents were tailored to the target analytes in each sample: cyclohexane (BaP/PAHs, PCP, and HCB only), toluene (polychlorinated dibenzo-p-dioxins/furans [PCDD/Fs] and dioxin-like PCBs only), or cyclohexane and toluene (8:2 v:v) (full suite of SVOC/POP compounds). After extraction, samples underwent cleanup/isolation procedures specific to the target analytes.
From the Soxhlet extracts, BaP/PAHs were isolated by silica gel column chromatography using benzene as the eluent, whereas a liquid-liquid extraction with a potassium carbonate solution was used to isolate PCP, which was then acetylated and back-extracted into hexane. The HCB remaining in the latter hexane extract was isolated by passage through a disposable silica solid-phase extraction cartridge, recombined with the PCP extract, and exchanged into isooctane. The BaP/PAH and PCP/HCB extracts were concentrated and spiked with known concentrations of recovery standards prior to analysis by gas chromatography–mass spectrometry (Agilent 6890/5973) in electron impact mode using selected ion monitoring. Spike recoveries (mean ± standard deviation, %) for BaP, PCP, and HCB were 97 ± 17, 81 ± 18, and 75 ± 10, respectively, and no recovery corrections were made to the data.
Soxhlet extracts to be analyzed for 2,3,7,8-TCDD equivalents were cleaned up using column chromatography with an acid/base column followed by an activated alumina column. The fraction containing the PCDD/Fs was eluted with dichloromethane (DCM)/hexane (50:50 v:v) and blown down to dryness. A known concentration of recovery standard was added prior to analysis by gas chromatography–high-resolution mass spectrometry (Agilent 6890 and Waters Micromass AutoSpec Ultima HRMS; Agilent Technologies, Mississauga, ON, and Waters Limited, Mississauga, ON). After analysis, the PCDD/F extract was combined with the dioxin-like (DL-PCB) extract obtained through column chromatography eluted with 3% DCM in hexane. The combined extract was fractionated by HPLC on a pyrenylethyl (PYE) group–bonded column using pentane as the mobile phase. The DL-PCB fraction was concentrated and then analyzed by gas chromatography–mass spectrometry (Agilent 6890/5973) in negative chemical ionization mode. Data were corrected for surrogate recoveries (mean ± standard deviation, %), which ranged from 75 ± 13 to 92 ± 16 for the individual PCDD, PCDF, and DL-PCB compounds.
When concentrations of all the SVOCs/POPs air toxics were to be determined in a given sample, the initial Soxhlet extract was exchanged into cyclohexane and split into equal volume fractions for BaP/PCP/HCB and 2,3,7,8-TCDD-equivalent analyses as per the methods described above.
Analytical detection limits were determined as the upper limits of the 95% confidence interval for seven samples spiked with known quantities of the target analytes. Regular field blanks were collected and analyzed for all SVOC/POPs and are discussed with results later in the text.
Metals and metalloids
Airborne particles destined for metal(loid) analysis were collected using dichotomous samplers (Partisol 2000-D; Thermo Scientific, Waltham, MA, USA) on 47-mm PTFE membrane filters (Pall Corporation, Port Washington, NY, USA). The samplers were operated once every 3 days with a 24-hr sampling time (midnight to midnight).
In the dichotomous PM sampler, a virtual impactor splits the incoming PM10 sample stream into fine (<2.5 μm; PM2.5) and coarse (2.5–10 μm; PM10-2.5) fractions. Fine fraction metal(loid)s are reported herein, since the coarse fraction is analyzed only in samples collected at one location (Flin Flon, Manitoba).
All samples, including laboratory, travel, and field blanks, were subjected to gravimetric determination of PM mass by weighing filters before and after sampling on a microbalance (MT-5; Mettler-Toledo, Highstown, NJ, USA) under controlled relative humidity (40 ± 5%) and temperature (23 ± 3 °C) and were subsequently analyzed for elements using energy-dispersive X-ray fluorescence (ED-XRF). PM2.5 samples were then analyzed by inductively coupled plasma mass spectrometry (ICP-MS), which provides superior detectability for metal(loids). Results from the latter method are reported herein. Each filter was first wetted with 50 μL of isopropanol and then digested with 2 mL of 40% (v:v) HNO3 in a MARS Xpress microwave–assisted acid digestion system (CEM Corporation, Matthews, NC, USA). All measurements were performed using an Agilent 7500c ICP-MS system (Agilent Technologies, Wilmington, DE, USA) with an octopole collision/reaction cell. Further details of sampling and analytical methods can be found in Dabek-Zlotorzynska et al. (Citation2011).
Analytical detection limits were defined as the upper limits of the 99% confidence intervals of repeated measurements of reagent blanks and control standards having concentrations less than 10 times greater than the expected detection limits. Spike recoveries of dissolved metal(loid)s were 100 ± 15% and recoveries against Standard Reference Material (SRM) 1648 (US National Institute of Standards and Technology, Gaithersburg, MD, USA) were >80% except for chromium (~50%). No recovery corrections were made to the metal(loid) data.
Ambient air quality guidelines
In this study, the term guideline refers to a prescribed ambient air concentration that is not to be exceeded in the setting jurisdiction. Guidelines, which generally consider exposure through inhalation, have many purposes, including use as benchmarks in the evaluation of measured ambient concentrations and in the design of emitting facilities. They are not necessarily legally enforceable. Guidelines can also be called objectives, standards, and criteria, and these terms are used interchangeably herein.
No federal guidelines exist for toxics in ambient air in Canada. Of the 13 Canadian provinces and territories, 6 have promulgated guidelines for HAPs (British Columbia Ministry of the Environment, Citation2014; Alberta Government, Citation2013; Manitoba, Citation2005; Ontario Ministry of the Environment, Citation2012; Ministère du Développement durable, de l’Environnement et de la Lutte contre les changements climatiques du Québec, Citation2014; Newfoundland and Labrador, 2004). These provinces, which were home to 91% of Canada’s population in the last year of the study period (Statistics Canada, Citation2015), have promulgated ambient air quality guidelines for a total of 114 NATA HAPs, although the number of guidelines differs among jurisdictions. Of the 63 compounds considered in this study because of their measurement by NAPS, 56 (89%) are subject to an ambient air guideline in at least one Canadian province (see Table S2). Four compounds have no guideline (benzyl chloride, hexachlorobenzene, hexachlorobutadiene, and 2,2,4-trimethylpentane). Xylenes are treated as a group for guideline purposes; the three xylene isomers are not subject to individual guidelines.
The greatest numbers of guidelines have been set by Ontario, Quebec, and Alberta. Guidelines from Ontario are effect-based, since they consider only the scientific evidence necessary to set a level below which a specific outcome will be avoided (e.g., adverse health impact, odor). Alberta’s guidelines “are based on scientific, social, technical and economic factors” (Alberta, Citation2013). Quebec has promulgated two types of guidelines, “critères” and “normes,” that are based on criteria similar to those used by Ontario and Alberta, respectively, and form the basis of different procedures for regulating facilities in that province.
Assessing the relative merits of the guidelines in different jurisdictions is beyond the scope of this paper. The guidelines from all jurisdictions, irrespective of measurement location, are used instead as a range of possible values for screening pollutants for further investigation.
Results
Ambient air concentration data were taken from the publicly accessible NAPS Web site (Environment Canada, Citation2015a). PVOC data were collected during a special study in 2009 and are available upon request (https://www.ec.gc.ca/air-sc-r/default.asp?lang=En&n=9547191B-1).
Sample concentrations were used directly if levels were above the analytical detection limit determined by each laboratory. Nondetectable values were replaced by zero for the purposes of summary statistic calculations. For comparison purposes, mean values were also calculated by replacing nondetectable values with one-half the detection limit. For VOCs and SVOC/POPs, detection limits were considered constant across the measurement period. For metal(loid)s, detection limits were determined annually. Analytical detection limits are listed in Table S1.
Spatiotemporal representation
Sampling sites and measured compounds have been determined in consultation with participating provinces and territories to address both national and regional requirements. As noted in Table S3, most are long-term measurement sites, although some are informally associated with the program or have hosted special studies to meet specific information needs over limited time periods. Measurements and sampling sites are distributed unevenly across the country (Table S3). No air toxics measurements were made in the Yukon, the Northwest Territories, or Prince Edward Island during the study period. The only represented territory was Nunavut where VOC measurements were conducted as part of a special study at Alert. The greatest numbers of measurement sites were found in the provinces with Canada’s largest cities: Ontario, Quebec, and British Columbia.
Throughout the remainder of the text, provinces and territories with measurements and/or guidelines will be referenced by their two-letter postal abbreviations: NU (Nunavut), BC (British Columbia), AB (Alberta), SK (Saskatchewan), MB (Manitoba), ON (Ontario), QC (Quebec), NB (New Brunswick), NS (Nova Scotia), and NL (Newfoundland and Labrador).
The number of measurement sites varied from 7 to 58 among compounds (Table S1). A small subset of VOCs was measured only at 7 sites in BC, whereas broad suites of VOCs were measured at 44–58 sites across the country. SVOC/POPs benzo[a]pyrene, dioxins, hexachlorobenzene, and pentachlorophenol were measured at 8–18 sites. Metals and metalloids were measured at 16 sites.
Not all sites hosted measurements throughout the entire study period. The 5-yr window was selected to balance the goals of representing recent conditions and maximizing the number of sampling locations. Metal(loid) data from Flin Flon MB were considered only from 2011 to 2013. The Hudson Bay Mining and Smelting smelter closed in 2010 and resulted in substantial reductions in metal(loid) concentrations there. Summary statistics would not have represented recent conditions had the preclosure period been included. Program-wide changes affected measurements of dioxins, which ceased in 2011, and PAHs/benzo[a]pyrene, for which the number of sampling sites decreased over the study period. Summary statistics reported herein include all available data and should not be considered robust for compliance evaluation or other purposes. Detailed spatiotemporal analysis of NAPS measurements is beyond the scope of this study but would contribute to elucidating trends in concentrations at individual locations and their differences between locations.
Detectability
The total number of samples ranged over two orders of magnitude from 129 (hexachlorobenzene and pentachlorophenol) to 14,710 (VOCs). Detectability is defined herein as the percentage of samples with measured concentrations greater than the analytical detection limit (DL). Analytical detection limits and compound detectabilities are presented in and Table S1.
Figure 2. Detection limits and detectability for air toxics in Canada measured by NAPS from 2009 to 2013. Detection limit for 2,3,7,8-TCDD is the range of values for the 29 dioxin, furan, and dioxin-like PCB congeners. Detection limits for metals and metalloids are the range of reported values over the study period. Detectability bars represent site-specific minimum, all-site average, and site-specific maximum values.
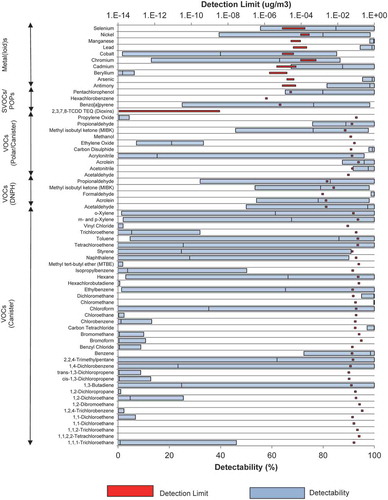
Where applicable, the reader is cautioned against equating lack of detectability with lack of guideline exceedance. Some compounds were measured using methods whose detection limits were greater than applicable guidelines. As a result, nondetectable measurements could have exceeded guideline values. A detailed comparison of measurements and guidelines is presented in a later section.
Ambient air concentrations
Summary statistics for the concentrations measured by NAPS during the study period are presented in and Table S1. Averages were calculated with two different replacement values for concentrations below analytical detection limits: zero and one-half the detection limit. As seen in Table S1, differences between the two averaging methods are generally small. Summary statistics discussed herein are those calculated using zero as a replacement value unless otherwise specified.
Comparison of ambient concentrations with ambient air guidelines
Guidelines consist of two parts: a numerical concentration value and a time period over which the concentration is to be evaluated. Within a given jurisdiction, many guidelines are set for annual or 24-hr averaging periods and values generally increase as averaging periods shorten.
This study considers ambient air concentrations that were collected over periods of 24 hr with the exception of VOCs at rural sites, which were collected for 4 hr but are assumed herein to represent daily conditions for air toxics. The analysis examines daily concentrations that have been considered individually for comparison with 24-hr standards and as whole-study averages for comparison with annual standards.
Compounds that were observed to exceed guidelines are presented first. Locations at which those guidelines were approached but not exceeded are also discussed. Identifying guideline approaches as well as exceedances is important for the following reasons. Firstly, compounds that approach guidelines merit investigation of their temporal trends to determine if they are likely to exceed those guidelines under future emission or usage scenarios. Secondly, air toxics associated with similar adverse health outcomes can act in combination. Some guidelines consider social, technical, and economic factors and are thus set at levels higher than those that are purely effect-based. The latter two factors suggest that compounds present at concentrations below guidelines may be important when considering cumulative risk. The approach criterion selected in this study is a concentration that is within an order of magnitude of a guideline value. Kyle et al. (Citation2001) and McCarthy et al. (Citation2009) used the same criterion to identify pollutants of potential concern.
Compounds exceeding guidelines
Concentrations of 11 air toxics measured through NAPS during the study period exceeded at least one guideline at one or more sites. These are described below.
Benzene
Measured benzene concentrations are depicted in and S1. Benzene was found at all sites with detectabilities between 84% and 100% except for Alert NU (site 129401) where it was detected in 72% of samples. Two provinces, ON and AB, have set annual standards for benzene. The annual ON standard (0.45 μg m−3) was exceeded at 41 sites, whereas no sites exceeded AB’s annual standard of 3 μg m−3. All 58 sites exhibited average benzene concentrations that exceeded one-tenth of ON’s annual standard, and 46 sites exceeded one-tenth of AB’s annual standard.
Figure 3. Average and maximum benzene concentrations measured by NAPS from 2009 to 2013. Population data taken from the 2011 Census (Statistics Canada (Citation2013, Citation2015).
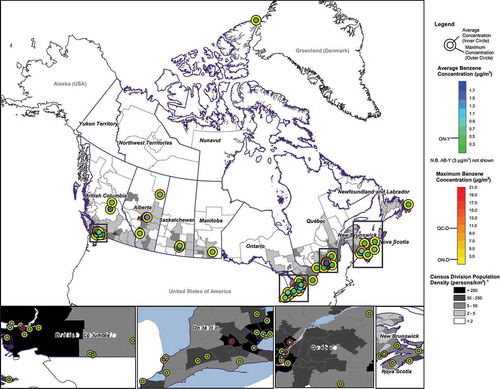
Twenty-four-hour standards for benzene have been set by two provinces: ON and QC. Maximum observed concentrations exceeded ON’s 24-hr standard of 2.3 μg m−3 at 27 sites. A subset of six sites exceeded QC’s 24-hr standard of 10 μg m−3. The highest daily benzene concentration was observed at Burnaby BC (site 100137), and its value of 21.6 μg m−3 was almost 10 times ON’s 24-hr standard.
Benzene is released from a variety of sources in Canada. Emissions from major point sources reported to the National Pollutant Release Inventory were unchanged over the study period (501 tonnes in 2009 versus 504 tonnes in 2013) and arose predominantly from the oil and gas, steel, and chemical industries (National Pollutant Release Inventory [NPRI], 2015b). A recent analysis of VOC trends at NAPS stations indicates that benzene concentrations at urban locations are increasing after several years of decline, whereas rural and industrial locations show steady or decreasing trends (Dann, Citation2015). This pattern suggests that sources not captured by the NPRI are gaining importance in urban areas.
Benzo[a]pyrene (polycyclic aromatic hydrocarbons)
Benzo[a]pyrene was detected at all 18 sites at which samples were collected. Its concentration distributions are presented in and S2. Detectability ranged from 25% to 98% among sites. Annual guidelines have been set by AB, ON, and QC (3 × 10⁻⁴, 1 × 10⁻⁵, and 9 × 10⁻⁴ μg m−3, respectively). ON has also set a 24-hr standard at 5 × 10⁻⁵ μg m−3. It is important to note that AB and QC have set standards for benzo[a]pyrene per se. ON’s standards apply to benzo[a]pyrene as a representative of polycyclic aromatic hydrocarbons (PAHs) and incorporate consideration of other PAH compounds and their reaction products, which can be more toxic than their parent precursors.
Figure 4. Average and maximum benzo[a]pyrene concentrations measured by NAPS from 2009 to 2013. Population data taken from the 2011 Census (Statistics Canada, Citation2013, Citation2015).
![Figure 4. Average and maximum benzo[a]pyrene concentrations measured by NAPS from 2009 to 2013. Population data taken from the 2011 Census (Statistics Canada, Citation2013, Citation2015).](/cms/asset/9dad6b52-9b97-43a7-9900-f9ef51908afb/uawm_a_1096863_f0004_oc.jpg)
ON’s annual guideline was exceeded by the average concentrations observed at all sites except Kejimkujik National Park NS (site 30501) where the average concentration was 61.3% of the guideline value. Two sites, Hamilton ON (60512) and Saguenay QC (50902), exceeded AB’s annual guideline. No sites exceeded the annual guideline set by QC. The maximum concentrations observed at all sites exceeded ON’s 24-hr guideline except at Kejimkujik NS (30501) where the maximum was 95% of the guideline value.
Figure S2 depicts average concentrations calculated with both replacement values for nondetectable concentrations. Differences between the two averages are small and apparent only at the sites with the lowest measured concentrations (Saint John NB [40203] and Kejimkujik NS [30501]). Conclusions about guideline exceedances are unchanged if based on the higher averages calculated using one-half the detection limit to replace nondetectable values.
The analytical detection limit for benzo[a]pyrene is 30% below the strictest provincial standard. The majority (77%) of field blanks collected for this compound yielded undetectable concentrations, although a minority (23%) exceeded the detection limit. Improvements to sampling and analytical methods would increase confidence in measured values as they relate to applicable guidelines.
An inventory of anthropogenic PAH emissions from major, minor, and mobile sources is available through the Air Pollutant Emissions Inventory (APEI; Environment Canada, Citation2015c). Emissions over the study period increased slightly (129 tonnes in 2009 versus 137 tonnes in 2013) and were dominated by residential wood combustion and the aluminum industry. A complete temporal analysis of available data from NAPS and other measurement programs in Canada (e.g., Great Lakes Program, Northern Contaminants Program) would help determine whether trends in ambient air concentrations are similar to those in reported emissions.
Ethylene oxide
As part of a special study, ethylene oxide was measured in 2009 at seven sites in BC ( and S3). Four standards have been promulgated for this pollutant: annual guidelines in ON and QC, a 24-hr guideline in ON, and a 1-hr guideline in AB. Average concentrations at all sites exceeded QC’s annual guideline (0.0005 μg m−3) and five of those sites also exceeded ON’s annual guideline (0.04 μg m−3). The remaining two sites had average concentrations that came within an order of magnitude of the annual ON guideline. If nondetectable concentrations had been replaced with one-half the detection limit rather than zero, average concentrations at all seven sites would have exceeded ON’s annual guideline.
Figure 5. Average and maximum ethylene oxide concentrations measured by NAPS from 2009 to 2013. Population data taken from the 2011 Census (Statistics Canada, Citation2013, Citation2015).
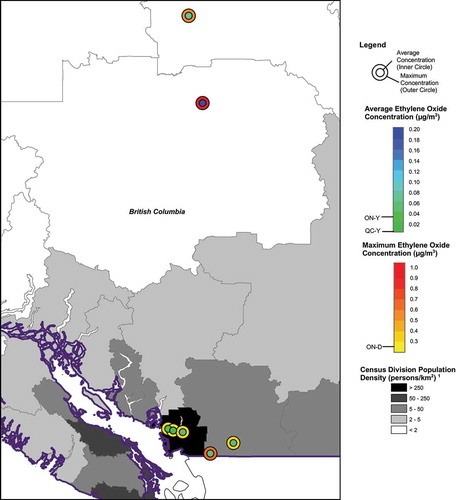
The highest ethylene oxide concentration was observed at Quesnel BC (101701) and exceeded the ON 24-hr standard by a factor of 1.89. Maximum concentrations recorded at all sites exceeded the latter guideline.
The detection limit for ethylene oxide exceeds the annual QC and ON guidelines by factors of 162 and 2.03, respectively. Adjustments to its sampling and analysis methods could improve the reliability of its measurements in Canadian air. Further measurements at more locations in the country would establish whether ethylene oxide exceeds existing guidelines at locations outside BC.
No ethylene oxide emissions were reported to the NPRI in BC in 2009 (Environment Canada, Citation2015b). Nationwide, ethylene oxide emissions reported to the NPRI in 2009 were limited to two ethylene oxide/ethylene glycol facilities in AB. The sources of the ambient ethylene oxide observed in BC are unknown, but the inhomogeneous spatial distribution of concentrations suggests that localized inputs are adding to regional background.
Acrolein
Acrolein was measured by NAPS using two methods during the study period, both of which are subject to artifacts (Herrington and Hays, Citation2012). DNPH/HPLC is suspected to underestimate acrolein concentrations, especially under high-ozone conditions, whereas collection with VOC canisters may lead to overestimates (Cahill, Citation2014) due to secondary formation during sample storage and transport. Measurements from both methods can therefore be seen as lower and upper bounds for true atmospheric concentrations. Simultaneous measurements were made by both methods at one site (Port Moody BC [100111]) in 2009, and the time series are presented in . The canister PVOC method yielded concentrations that were higher than the DNPH method by a mean factor of 13.3.
Figure 6. Acrolein concentrations measured at Port Moody BC (100111) using canister and DNPH sampling.
Twenty-four hour acrolein guidelines of 0.4 μg m−3 have been set by both ON and AB. DNPH/HPLC measurements of acrolein were made at 11 sites. Prince George BC (100202) saw 24-hr concentrations that exceeded the 24-hr standards. All other sites had maximum concentrations that exceeded one-tenth of those guidelines. Canister PVOC measurements were made at seven sites. Of those, the maximum concentration was observed at North Vancouver BC (100139) and it exceeded the 24-hr guideline by a factor of 5.29. All sites measuring acrolein using the canister PVOC method had at least one sample that exceeded the 24-hr guideline.
Acrolein measurements were found to exceed guidelines even when conducted by methods known to underestimate concentrations. Refinement of sampling and analysis protocols would improve the certainty in acrolein measurements, and the application of such protocols to a broader range of locations would aid in understanding atmospheric levels of this pollutant in Canada.
Acrolein emissions reported to the NPRI varied from year to year during the study period and showed a net increase from 86 to 110 tonnes between 2009 and 2013, respectively. Emissions were dominated by the wood products and pulp and paper industries. Acrolein is registered as a pesticide in Canada, and it also arises in the atmosphere as a product of combustion and through secondary formation from VOC precursors (Environment Canada and Health Canada, Citation2000). Emissions associated with the latter uses and formation processes are not subject to reporting to the NPRI, and the relative contribution of major point sources to total atmospheric emissions in Canada is therefore unknown. Temporal trends in measured summer mean acrolein concentrations were not significant over the period 2002–2010 (Dann, Citation2015). Further analysis of acrolein measurement data would elucidate recent trends in acrolein concentrations in Canadian ambient air.
Nickel
Nickel was measured in PM2.5 at 16 sites. ON and AB have set annual standards of 0.02 μg m−3 in PM10 and 0.05 μg m−3 in total suspended particles (TSP), respectively. No average concentrations exceeded the annual standards set by ON and AB, although average concentrations observed at Halifax NS (30113) exceeded one-tenth of ON’s annual guideline.
Four provinces have set 24-hr standards for nickel: QC (0.014 μg m−3 in PM10), ON (0.1 μg m−3 in PM10), and MB and NL (2 μg m−3 in TSP). The highest nickel concentration observed in this study was at Toronto ON (60427), and along with the highest daily concentrations observed at six other sites, it exceeded QC’s 24-hr standard. Eight other sites exceeded one-tenth of QC’s 24-hr standard, and a subset of seven sites exceeded one-tenth of ON’s 24-hr standard as well.
Seventy-six field and travel blanks were collected and analyzed for nickel. Only two blanks yielded detectable concentrations. As such, measured concentrations are reported with a high level of confidence.
Reported concentrations are associated only with ICP-MS analysis of PM2.5. Measurements using this technique on the full size range of atmospheric particles would assist in evaluating its concentrations relative to guidelines.
Nickel emissions reported to the NPRI were similar in the first and last years of the study period (120 tonnes in 2009 and 121 tonnes in 2013) and were dominated by the mining and metals sector (Environment Canada, Citation2015b). Fossil fuel combustion also makes significant contributions to atmospheric nickel in Canada (Environment Canada and Health Canada, Citation1994), although such emissions are not fully captured by the NPRI. No spatiotemporal analysis has yet been conducted to examine trends of nickel in Canadian air.
Chloroform
Chloroform was detected at 57 sites. ON and QC have set annual standards of 0.2 and 0.24 μg m−3, respectively, and ON has also set a 24-hr standard of 1 μg m−3.
Four sites (Saturna BC [102001], Montreal QC [50115 and 50103], and Granton NS [31201]) posted maximum daily concentrations that exceeded ON’s 24-hr guideline. The remaining 53 sites at which chloroform was detected posted maximum concentrations that exceeded one-tenth of that guideline value.
Average concentrations did not exceed ON or QC’s annual standards, although concentrations at 42 and 40 sites, respectively, exceeded one-tenth of their values.
Chloroform emissions reported to the NPRI tripled over the study period from 36 tonnes in 2009 to 107 tonnes in 2013 and were dominated by the pulp and paper industry (Environment Canada, Citation2015b). Ambient chloroform concentrations measured by NAPS over the period 2002–2013 were steady at urban and industrial locations but showed an increasing trend at rural locations (Dann, Citation2015).
2,3,7,8-TCDD TEQ (dioxins)
The term “dioxins” refers to a grouping of 29 compounds that can induce toxic effects similar to 2,3,7,8-TCDD. The grouping includes 17 polychlorinated dibenzo-p-dioxins and polychlorinated dibenzofurans (PCDD/Fs) and 12 dioxin-like polychlorinated biphenyls (DL-PCBs). Measured concentrations are multiplied by toxic equivalency factors (TEFs) to normalize them to 2,3,7,8-TCDD toxic equivalents (TEQs) (Van den Berg et al., Citation2006).
Some samples collected by NAPS were analyzed for only a subset of TEQ compounds. Of the 92 samples analyzed for all 29 TEQ compounds, the DL-PCBs accounted for an average of 28% of TEQs, although their contribution ranged from 12% to 98%. TEQs are reported herein whether they include both PCDD/Fs and DL-PCBs or only one or the other. As a result, concentrations should be interpreted as lower bounds.
Three provinces have set dioxin guidelines. An annual standard has been set by QC (6 × 10⁻⁸ μg TEQ m−3), and 24-hr guidelines have been set by ON (1 × 10⁻⁷ μg TEQ m−3) and NL (5 × 10⁻⁶ μg TEQ m−3). QC’s annual guideline was not exceeded at any sites, although average concentrations at 15 locations exceeded one-tenth of it. Average TEQ concentrations calculated using both replacement values for nondetectable samples show little difference except at the two sites with the lowest concentrations (Burnt Island ON [65501] and Kejimkujik NS [30501]). The conclusion that average concentrations at those two sites do not exceed one-tenth of the annual QC guideline stands regardless of which averaging method is used.
The highest concentrations observed at two sites (Hamilton ON [60512] and Montreal QC [50129]) exceeded ON’s 24-hr guideline. Thirteen other sites exceeded one-tenth of ON’s 24-hr guideline. No sites exceeded or approached NL’s 24-hr standard.
Fifty-one field blanks were collected and analyzed for the 17 PCDD/F TEQ compounds. Twelve of the TEQ compounds were undetectable in the vast majority (≥96%) of samples. However, field blank detectability was 73% or greater for 1,2,3,4,6,7,8-CDD, OCDD, and 2,3,7,8-CDF, 31% for 1,2,3,4,6,7,8-CDF, and 11% for OCDF. The average field blank yielded 3.64 × 10⁻¹⁰ μg TEQ m−3 of PCDD/F. Typical field blanks therefore represented less than 3% of the overall average dioxin TEQ concentration reported herein.
A similar conclusion can be drawn for the 12 dioxin-like PCB TEQ compounds. Fourteen field blanks were collected and analyzed. Detectable concentrations of all species were found in more than 78% of field blanks except for PCB-169 (43%) and PCB-81 (7%). Nonetheless, the average field blank contained only 8.61 × 10⁻¹⁰ μg TEQ m−3, which is less than 7% of overall average dioxin TEQ concentrations reported herein.
Taken together, the average field blanks for all the dioxin TEQ compounds represented 10% of overall average measured concentrations. Maximum field blank concentrations were an order of magnitude higher than the average, whereas the minimum observed concentration was 3 orders of magnitude lower than average. As a result, reported concentrations toward the low end of the observed range are likely influenced by contributions from the sampling media as well as the sampled air. The implementation of methods aimed at reducing blank values would be useful as part of future measurement protocols should dioxin sampling resume in NAPS.
Similar to PAHs, an inventory of anthropogenic dioxin emissions from major, minor, and mobile sources is produced by the APEI (Environment Canada, Citation2015d). Emissions declined from 92 g TEQ in 2009 to 71 g TEQ in 2013 and were dominated by open waste sources, mobile sources (marine and heavy-duty diesel) and residential wood combustion. No comment can be made about temporal trends in dioxin concentrations observed at NAPS stations because measurements ceased in 2011.
Tetrachloroethene
Tetrachloroethene, also known as perchloroethylene or perc, was detected at 56 sites. QC has set an annual guideline of 2 μg m−3, which was exceeded only by the average concentration observed at Regina SK (80110). Average concentrations observed at seven other sites exceeded one-tenth of the QC annual standard.
ON has set a 24-hr guideline of 360 μg m−3, which was not exceeded at any NAPS locations. The maximum daily concentration observed at Regina SK (80110) exceeded one-tenth of the ON 24-hr guideline.
Tetrachloroethene emissions reported to the NPRI doubled from 60 tonnes in 2009 to 118 tonnes in 2013 and were dominated by plastic and chemical manufacturing industries (Environment Canada, Citation2015b). Ambient concentrations measured by NAPS from 2002 to 2013 have decreased at urban and industrial sites but have increased at rural locations (Dann, Citation2015). However, the latter concentrations are still well below ambient guidelines reported herein.
Trichloroethene
Trichloroethene was detected at 43 sites. QC and ON have set annual guidelines of 0.4 and 2.3 μg m−3, respectively, and ON has also set a 24-hr guideline at 12 μg m−3. The highest average concentration was observed at Richmond BC (100134) and exceeded QC’s annual guideline by a factor of 2.01. It was also equal to 35% of ON’s annual guideline. Four other sites (Montreal QC [50103 and 50113], Etobicoke ON [60435], and Edmonton AB [90121]) had average concentrations that came exceeded one-tenth of QC’s annual guideline. Edmonton AB (90121) and Richmond BC (100134) also exceeded one-tenth of ON’s annual standard.
The maximum concentration detected during the study period was at Richmond BC (100134) and was 8.12 times greater than ON’s 24-hr standard. Six other sites (Edmonton AB [90121], Point Petre ON [64601], Toronto ON [60427], Montreal QC [50103 and 50115], and Point Lepreau NB [40501]) had maximum concentrations that exceeded one-tenth the ON 24-hr guideline.
Trichloroethene emissions reported to the NPRI have decreased by a factor of 4 from 146 tonnes in 2009 to 38 tonnes in 2013 (Environment Canada, Citation2015b). NPRI emissions of trichloroethene are dominated by the plastics and aerospace industries. Ambient concentrations measured by NAPS over the period 2002–2013 have decreased at urban, industrial, and rural sites (Dann, Citation2015).
Acrylonitrile
As part of a special study, acrylonitrile was measured by the canister PVOC method at seven sites in BC in 2009. Average concentrations observed at Chilliwack (101101) and Quesnel (101701) exceeded ON’s annual guideline of 0.12 μg m−3. A third site, North Vancouver (100139), had average concentrations greater than one-tenth of ON’s annual standard. Only Chilliwack (101101) exceeded one-tenth of AB’s annual guideline of 2 μg m−3, and no sites approached QC’s annual guideline of 12 μg m−3.
ON is the only Canadian jurisdiction to have set a 24-hr acrylonitrile standard (0.6 μg m−3). It was exceeded by the highest acrylonitrile concentration observed at Chilliwack (101101). Four other sites (North Vancouver [100121 and 100139], Abbotsford [101004], and Quesnel [101701]) posted maximum concentrations that exceeded one-tenth of ON’s 24-hr value.
No acrylonitrile emissions were reported to the NPRI in BC in 2009 (Environment Canada, Citation2015b). Nationwide, 5.1 tonnes of acrylonitrile emissions were reported to the NPRI, and these arose almost exclusively from plastic product manufacturing. No spatiotemporal analysis of acrylonitrile concentrations in ambient air has yet been conducted in Canada.
Propylene oxide
Propylene oxide was measured at the same times and locations as acrylonitrile. It was observed at detectable levels in only one sample at Prince George BC (100202) where its concentration exceeded ON’s 24-hr guideline of 1.5 μg m−3. Given the low rate of detectability for this compound, further evaluation is recommended to determine whether the lone detectable observation was due to a sampling/analytical anomaly or to a measurement record length that was insufficient to capture the full range of potentially variable ambient concentrations.
No propylene oxide emissions were reported to the NPRI in BC in 2009 (Environment Canada, Citation2015b). Only one chemical manufacturing facility in ON reported emissions that year and those totaled 1 kg. No spatiotemporal analysis of propylene oxide concentrations in ambient air has yet been conducted in Canada.
Compounds approaching guidelines
The preceding discussion of air toxics that exceeded guidelines included, when applicable, information about locations at which their concentrations approached those guidelines within an order of magnitude. An additional 16 compounds approached at least one of their respective 24-hr or annual average guidelines without exceeding them at any location. These are shown in . It should be noted that the depicted metal(loids) were measured only by ICP-MS in PM2.5. Since these compounds are also expected to occur in coarser particles, reported concentrations underestimate their total atmospheric burden. These underestimated concentrations have been compared with ambient air guidelines that apply to PM10 or TSP. Measurement of these metal(loids) using ICP-MS in the full size range of atmospheric particles would contribute to a more rigorous evaluation of their concentrations relative to guidelines.
Figure 7. Air toxics that approached but did not exceed annual or 24-hr guidelines during the study period.
Compounds whose detection limits exceed or approach guidelines
Four compounds were measured by NAPS using methods whose analytical detection limits are greater than applicable guidelines: ethylene oxide (162 × QC annual and 2.03 × ON annual), 1,2,-dibromoethane (7.00 × QC annual), 1,1,2,2-tetrachloroethane (2.94 × QC annual), and 1,1,2-trichloroethane (1.95 × QC annual). The latter three compounds were not detected in any NAPS samples, yet no conclusions can be drawn about their relation to guideline values, since these may be have been exceeded in some samples. Several compounds had detection limits that came within one-tenth of a guideline value. Comparison of averages calculated using both common replacement values for nondetectable concentrations suggests that such detection limits may be adequate for screening purposes.
Context and recommendations
Sixty-three air toxics were measured by the NAPS program over the period 2009–2013, although compound lists and measurement dates varied from site to site. Eleven air toxics exceeded at least one 24-hr or annual provincial guideline and a further 16 air toxics approached at least one guideline within an order of magnitude. Four compounds could not be assessed, since no guideline has been promulgated for them. Four compounds were measured using methods whose detection limits exceeded a guideline value, three of which could not be assessed, since they were not detected in any samples. Further investigation of these 34 compounds in Canadian air would aid to ensure that their spatiotemporal coverage is adequate and that their sampling and analysis methods are suitable.
There is overlap between the list of compounds identified herein as candidates for further investigation in Canadian air and those identified as priority compounds through the most recent U.S. National-Scale Air Toxics Assessment (NATA; EPA, Citation2011). NATA prioritizes ambient air toxics according to a scheme that identifies “drivers” and “contributors” to health risk. The prioritization scheme also considers the number of people exposed to each compound and assesses drivers and contributors as being of national or regional concern. Of the 25 compounds assessed as drivers or contributors at either geographic scale in the United States, 7 have been found to exceed a 24-hr or annual provincial guideline in Canada and 8 others have been found to approach such a guideline within an order of magnitude. Four of the 10 remaining priority NATA compounds are measured by NAPS (acetaldehyde, ethylbenzene, chromium, and manganese), although 8 of the 10 are subject to ambient air guidelines in at least one Canadian jurisdiction. Examination of NATA compounds not measured through NAPS, particularly if they were identified as priority compounds under NATA or if they are among the 58 unmeasured air toxics that are subject to an ambient air quality guideline in a Canadian jurisdiction, would contribute to ensuring that the full suite of pollutants relevant to ambient air quality in Canada is subject to adequate study.
Although there are no federal ambient standards for the air toxics considered in this study, the Canadian Environmental Protection Act (CEPA) includes provisions for managing toxic compounds. The air toxics included in this study that have been assessed as CEPA-toxic or equivalent, and are thus subject to management actions, are identified in Table S1 (Environment Canada, Citation2015e). Of the 27 air toxics that have been identified herein as exceeding or approaching guidelines, 19 have been assessed as toxic under CEPA. Results of this study can be applied to evaluating the effectiveness of toxic substances management actions in Canada and to identifying compounds that merit further investigation.
Supplemental Material
Supplemental data for this article can be accessed on the publisher’s website.
Supplemental Material
Download Zip (704.2 KB)Acknowledgment
The authors wish to acknowledge the role played by Tom Dann in the development and maintenance of the NAPS program and its database. Thanks to provincial, territorial, and regional NAPS partners and to staff at the Air Quality Research Division in Ottawa, ON, for sample collection and laboratory analysis. Thanks also to Andrea Darlington for production of the map infographics and to Céline Audette for assistance with metadata. Thanks to students Steven Axnix, Keith Wong, Wesley Marr, and Christopher Leonard for their contributions to compiling measurement data and ambient air quality guideline information. Thanks also to Denis Jugloff of ON, Pierre Walsh of QC, Laura Blair and Long Fu of AB, and Natalie Suzuki of BC for information about air quality guidelines in their jurisdictions. Helpful comments and suggestions from François Lavallée, Nav Khera, and John Liggio of Environment Canada are much appreciated.
Additional information
Notes on contributors
Elisabeth Galarneau
Elisabeth Galarneau is a research scientist with the Air Quality Processes Research Section, Environment Canada, in Toronto, ON.
Daniel Wang
Daniel Wang and Ewa Dabek-Zlotorzynska are research scientists with the Analysis and Air Quality Section, Environment Canada, in Ottawa, ON.
Ewa Dabek-Zlotorzynska
Daniel Wang and Ewa Dabek-Zlotorzynska are research scientists with the Analysis and Air Quality Section, Environment Canada, in Ottawa, ON.
May Siu
Daniel Wang and Ewa Dabek-Zlotorzynska are research scientists with the Analysis and Air Quality Section, Environment Canada, in Ottawa, ON.
Valbona Celo
Valbona Celo, May Siu, Mylaine Tardif, David Harnish, and Ying Jiang are analytical chemists with the Analysis and Air Quality Section, Environment Canada, in Ottawa, ON.
Mylaine Tardif
Daniel Wang and Ewa Dabek-Zlotorzynska are research scientists with the Analysis and Air Quality Section, Environment Canada, in Ottawa, ON.
David Harnish
Daniel Wang and Ewa Dabek-Zlotorzynska are research scientists with the Analysis and Air Quality Section, Environment Canada, in Ottawa, ON.
Ying Jiang
Daniel Wang and Ewa Dabek-Zlotorzynska are research scientists with the Analysis and Air Quality Section, Environment Canada, in Ottawa, ON.
References
- Alberta Government. 2013. Alberta ambient air quality objectives and guidelines summary. http://environment.gov.ab.ca/info/library/5726.pdf (accessed September 13, 2013).
- British Columbia Ministry of the Environment. 2014. British Columbia ambient air quality objectives. Environmental Standards Branch, B.C. Ministry of the Environment. http://www.bcairquality.ca/reports/pdfs/aqotable.pdf (accessed May 15, 2015).
- Cahill, T.M. 2014. Ambient acrolein concentrations in coastal, remote, and urban regions in California. Environ. Sci. Technol. 48:8507–8513. doi:10.1021/es5014533
- Dabek-Zlotorzynska, E., T.F. Dann, P.K. Martinelango, V. Celo, J.R. Brook, D. Mathieu, L. Ding, and C.C. Austin. 2011. Canadian National Air Pollution Surveillance (NAPS) PM2.5 speciation program: Methodology and PM2.5 chemical composition for the years 2003–2008. Atmos. Environ. 45:673–686. doi:10.1016/j.atmosenv.2010.10.024
- Dann, T. 2015. Review and assessment of ambient volatile organic compound (VOC) data from the National Air Pollution Surveillance (NAPS) program to compare with VOC species emitted from the National Pollutant Release Inventory (NPRI) and other Canadian sources. Report prepared for Environment Canada, Ottawa, ON.
- Environment Canada. 2013. Toxic substances management policy. http://www.ec.gc.ca/toxiques-toxics/default.asp?lang=En&n=2A55771E-1 (accessed May 15, 2015).
- Environment Canada. 2015a. National Air Pollutant Surveillance (NAPS) annual raw data. http://www.etc-cte.ec.gc.ca/NapsAnnualRawData/Default.aspx?ReturnUrl=%2fNapsAnnualRawData%2fMain.aspx (accessed April 23, 2015).
- Environment Canada. 2015b. National Pollutant Release Inventory: Facility search. http://ec.gc.ca/inrp-npri/donnees-data/index.cfm?lang=En (accessed August 19, 2015).
- Environment Canada. 2015c. Historical polycyclic aromatic hydrocarbons emission trends for Canada (kilograms). http://www.ec.gc.ca/inrp-npri/donnees-data/ap/index.cfm?do=ap_result&process=true§or=&lang=en&year=1990-2013&substance=pah&location=CA&submit=Submit (accessed August 21, 2015).
- Environment Canada. 2015d. Historical dioxins and furans emission trends for Canada (grams TEQ). http://www.ec.gc.ca/inrp-npri/donnees-data/ap/index.cfm?do=ap_result&process=true§or=&lang=en&year=1990-2013&substance=df&location=CA&submit=Submit (accessed August 21, 2015).
- Environment Canada. 2015e. List of toxic substances managed under CEPA (Schedule 1). http://www.ec.gc.ca/toxiques-toxics/?lang=En&n=98E80CC6-1 (accessed May 15, 2015).
- Environment Canada and Health Canada. 1994. Priority substances list assessment report for nickel and its compounds. http://www.hc-sc.gc.ca/ewh-semt/pubs/contaminants/psl1-lsp1/compounds_nickel_composes/index-eng.php (accessed August 19, 2015).
- Environment Canada and Health Canada. 2000. Priority substances list assessment report for acrolein. http://www.hc-sc.gc.ca/ewh-semt/pubs/contaminants/psl2-lsp2/acrolein/index-eng.php (accessed August 19, 2015).
- Herrington, J.S., and M.D. Hays. 2012. Technical note: Concerns regarding 24-hr sampling for formaldehyde, acetaldehyde, and acrolein using 2,4-dinitrophenylhydrazine (DNPH)-coated solid sorbents. Atmos. Environ. 55:179–184.
- Kavouras, I.G., D.W. DuBois, G. Nikolich, and V. Etyemezian. 2015. Monitoring, source identification and health risks of air toxics in Albuquerque, New Mexico, U.S.A. Aerosol Air Qual. Res. 15:556–571. doi:10.4209/aaqr.2014.04.0075
- Kyle, A.D., C.C. Wright, J.C. Caldwell, P.A. Buffler, and T.J. Woodruff. 2001. Evaluating the health significance of hazardous air pollutants using monitoring data. Public Health Rep. 116:32–44. doi:10.1016/S0033-3549(04)50020-1
- Manitoba. 2005. Manitoba ambient air quality criteria. http://www.gov.mb.ca/conservation/envprograms/airquality/pdf/criteria_table_update_july_2005.pdf (accessed September 16, 2013).
- McCarthy, M.C., T.E. O’Brien, J.C. Charrier, and H.R. Hafner. 2009. Characterization of the chronic risk and hazard of hazardous air pollutants in the United States using ambient monitoring data. Environ. Health Perspect. 117:790–796. doi:10.1289/ehp.11861
- Ministère du Développement durable, de l’Environnement et de la Lutte contre les changements climatiques du Québec. 2014. Normes et critères québécois de qualité de l’atmosphère, version 3. Développement durable, Environnement, Faune et Parcs Québec. http://www.mddefp.gouv.qc.ca/air/criteres/Normes-criteres-qc-qualite-atmosphere.pdf (accessed May 15, 2015).
- Newfoundland and Labrador. 2004. Regulation 39/04, Air Pollution Control Regulations, 2004 under the Environmental Protection Act (O.C. 2004-232). http://www.assembly.nl.ca/legislation/sr/regulations/Rc040039.pdf (accessed September 16, 2013).
- Ontario Ministry of the Environment. 2012. Ontario’s ambient air quality criteria. Standards Development Branch, Ontario Ministry of the Environment. http://www.ene.gov.on.ca/stdprodconsume/groups/lr/@ene/@resources/documents/resource/std01_078686.pdf (accessed August 16, 2013).
- Schulz, D.E., G. Petrick, and J.C. Duinker. 1989. Complete characterization of polychlorinated biphenyl congeners in commercial Aroclor and Clophen mixtures by multidimensional gas chromatography-electron capture detection. Environ. Sci. Technol. 23:852–859. doi:10.1021/es00065a015
- Statistics Canada. 2013. 2011 Census—Boundary files. http://www12.statcan.gc.ca/census-recensement/2011/geo/bound-limit/bound-limit-2011-eng.cfm (accessed August 21, 2015).
- Statistics Canada. 2014. Population by year, by province and territory. http://www.statcan.gc.ca/tables-tableaux/sum-som/l01/cst01/demo02a-eng.htm (accessed May 13, 2015).
- Statistics Canada. 2015. Population and dwelling counts, for Canada and census divisions, 2011 and 2006 censuses. http://www12.statcan.gc.ca/census-recensement/2011/dp-pd/hlt-fst/pd-pl/Table-Tableau.cfm?LANG=Eng&T=701 (accessed August 21, 2015).
- U.S. Environmental Protection Agency (EPA). 2010. The US Clean Air Act Amendments of 1990 List of Hazardous Air Pollutants. U.S. Environmental Protection Agency Technology Transfer Network. http://www.epa.gov/ttnatw01/orig189.html (accessed May 14, 2013).
- U.S. Environmental Protection Agency (EPA). 2011. 2005 National-Scale Air Toxics Assessment. U.S. Environmental Protection Agency Technology Transfer Network. http://www.epa.gov/ttn/atw/nata2005/ (accessed May 14, 2013).
- U.S. Environmental Protection Agency (EPA). 2012. About air toxics. U.S. Environmental Protection Agency Technology Transfer Network. http://www.epa.gov/ttn/atw/allabout.html (accessed May 14, 2013).
- U.S. Environmental Protection Agency (EPA). 2013. National Air Toxics Assessments. U.S. Environmental Protection Agency Technology Transfer Network. http://www.epa.gov/ttn/atw/natamain/ (accessed July 8, 2013).
- Van den Berg, M., L.S. Birnbaum, M. Denison, M. De Vito, W. Farland, M. Feeley, H. Fiedler, H. Hakansson, A. Hanberg, L. Haws, M. Rose, S. Safe, D. Schrenk, C. Tohyama, A. Tritscher, J. Tuomisto, M. Tysklind, N. Walker, and R.E. Peterson. 2006. The 2005 World Health Organization reevaluation of human and mammalian toxic equivalency factors for dioxins and dioxin-like compounds. Toxicol. Sci. 93:223–241. doi:10.1093/toxsci/kfl055
- Wang, D., J.D. Fuentes, D. Travers, T. Dann, and T. Conolly. 2005. Non-methane hydrocarbons and carbonyls in the Lower Fraser Valley during PACIFIC2 2001. Atmos. Environ. 39:5261–5272. doi:10.1016/j.atmosenv.2005.05.035