
ABSTRACT
Yanbu, on the Red Sea, is an affluent Saudi Arabian industrial city of modest size. Substantial effort has been spent to balance environmental quality, especially air pollution, and industrial development. We have analyzed six years of observations of criteria pollutants O3, SO2, particles (PM2.5 and PM10) and the known ozone precursors—volatile organic compounds (VOCs) and nitrogen oxides (NOx). The results suggest frequent VOC-limited conditions in which ozone concentrations increase with decreasing NOx and with increasing VOCs when NOx is plentiful. For the remaining circumstances ozone has a complex non-linear relationship with the VOCs. The interactions between these factors at Yanbu cause measurable impacts on air pollution including the weekend effect in which ozone concentrations stay the same or even increase despite significantly lower emissions of the precursors on the weekends. Air pollution was lower during the Eids (al-Fitr and al-Adha), Ramadan and the Hajj periods. During Ramadan, there were substantial night time emissions as the cycle everyday living is almost reversed between night and day. The exceedances of air pollution standards were evaluated using criteria from the U.S. Environmental Protection Agency (EPA), World Health Organization (WHO), the Saudi Presidency of Meteorology and Environment (PME) and the Royal Commission Environmental Regulations (RCER). The latter are stricter standards set just for Yanbu and Jubail. For the fine particles (PM2.5), an analysis of the winds showed a major impact from desert dust. This effect had to be taken into account but still left many occasions when standards were exceeded. Fewer exceedances were found for SO2, and fewer still for ozone. The paper presents a comprehensive view of air quality at this isolated desert urban environment.
Implications: Frequent VOC-limited conditions are found at Yanbu in Saudi Arabia that increase ozone pollution if NOx is are reduced. In this desert environment, increased nightlife produces the highest levels of VOCs and NOx at night rather than the day. The effects increase during Ramadan. Fine particles peak twice a day—the morning peak is caused by traffic and increases with decreasing wind, potentially representing health concerns, but the larger afternoon peak is caused by the wind, and it increases with increasing wind speeds. These features suggest that exposure to pollutants must be redefined for such an environment.
Introduction
Yanbu’ al Bahr in Saudi Arabia is a major seaport on the Red Sea, with a current population of about 230,000 people (Royal Commission for Jubail and Yanbu, Citation2014; Wikipedia, Citation2015). It has unique characteristics for air pollution studies as an isolated desert environment with almost no natural biogenic sources and distant from all other urban areas. There are very few data from such environments. Moreover, Yanbu is a highly industrialized city where the government has set up the Royal Commission for Jubail and Yanbu to balance urban and industrial development with environmental quality (Royal Commission Environmental Regulations [RCER], Citation2004). In this paper, we will provide a comprehensive characterization of air pollution at Yanbu.
The criteria pollutants are ozone and its precursors, sulfur dioxide, and aerosol particles. These pollutants are targeted in all air quality regulations worldwide because of their established threats to human health (see, for example, Hester and Harrison, Citation1998; World Health Organization [WHO], Citation2006, Citation2015; Peng et al., Citation2005; Presidency of Meteorology and Environment [PME], Citation2015). The data, therefore, consist of hourly measurements of oxides of nitrogen (NOx; NO and NO2), nonmethane hydrocarbons (NMHCs), ozone (O3), sulfur dioxide (SO2), and respirable particles (PM2.5 [particulate matter with an aerodynamic diameter <2.5 μm]: 4 yr; PM10 [particulate matter with an aerodynamic diameter <10 μm]: 5 yr), taken for 6 yr between 2000 and 2005 under the direction of the Presidency of Meteorology and Environment, which is charged with enforcing the clean air requirements of Saudi Arabia. The methodology for data acquisition and their treatment are described in our earlier papers dealing with companion measurements from various locations in Saudi Arabia (Porter et al., Citation2014; Butenhoff et al., Citation2015). The site for the measurements of the pollutants is located at 24°0.764N 38°13.698E in a park in the central part of Yanbu (Butenhoff et al., Citation2015). The meteorological data, including temperature, were obtained from the Yanbu Airport archive (WeatherSpark, Citation2015a). The climate of Yanbu is hot and dry, with average highs around 38 °C in the summer (WeatherSpark, Citation2015b). We will first examine the environmental factors that affect these pollutants at Yanbu and the characteristics of the air quality, then the effects of cultural factors: Ramadan, the Eid days, and weekends, and lastly, the frequency by which air quality standards were violated during the time of measurements. A synopsis of the average pollutant levels and major measures of their variability is given in .
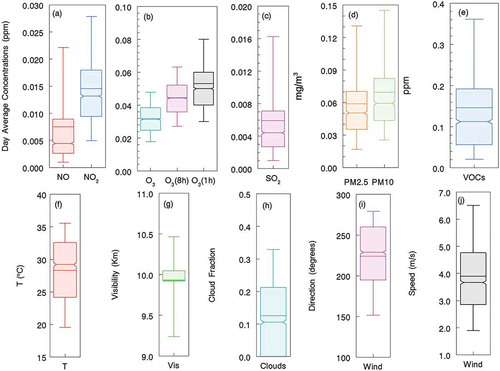
Figure 1. An overview of pollutant concentrations and environmental variables at Yanbu based on 6 yr of observations. In these graphs, the box shows the range of the middle 50% of the data, the median is at the line at the notch, the mean is the line in the box, and the whiskers are the 95% limits. These are calculated for the 24-hr average concentrations utilizing all available data. Criteria pollutants are shown in (a) NO and NO2, (b) ozone, (c) SO2, (d) PM2.5 and PM10, and (e) VOCs. Major environmental factors that affect air quality are shown in (f) temperature, (g) visibility, (h) cloud fraction, (i) wind direction, and (j) wind speed.
Factors affecting criteria pollutants
Of the three main pollutants (O3, SO2, and PM2.5), ozone is the most complex, since it is produced entirely in the atmosphere by the interaction between sunlight and its precursors, which are taken to be nitrogen oxides (NOx = NO + NO2) and volatile organic compounds (VOCs), here represented by measured concentrations of nonmethane hydrocarbons. In the standard air pollution theory, NO2 is broken down by sunlight to make NO and O at a rate k1; the O reacts rapidly with O2 to make O3 (k2). The O3 then reacts with NO to recover NO2 and O2 (k3), completing the cycle. Automobiles are a major source of NO and nonmethane hydrocarbons, although other sources are often significant. The VOCs convert NO to NO2, leading to an increased production by NO2 and decreased destruction by NO. In most urban environments, this allows ozone to build up after the initial morning injection of the precursors from traffic. In this system, the steady-state concentration of ozone is proportional to the ratio NO2/NO and k1/k3. The production of ozone is increased by increasing sunlight (k1) and cannot occur at night. Ozone is also increased by hydrocarbons and decreased by NO, which constitutes a major sink (see Seinfeld and Pandis, Citation1998).
The sources of SO2 at Yanbu are expected to be the oil refinery operations and the use of sulfur-containing fuels for the many industrial activities, including power generation. Fine particles can be formed from the oxidation of sulfur compounds such as SO2 as well as gas-to-particle conversion processes that involve NOx. At Yanbu, however, the wind-blown desert dust is a large contributor of both fine and coarse particles, as we will show later.
Meteorological factors can have a significant effect on all the pollutants. For the longer-lived species, higher wind speeds cause a more rapid removal and thus reduce concentrations. Wind direction can cause pollution levels to change if there are other cities or major sources of pollution upwind. The cloud fraction affects ground-level photochemistry, especially for ozone, since its concentrations depend directly and indirectly on sunlight.
We determined the influence of various factors on the concentrations of the main pollutants by a maximum amplitude method. In this method, for ozone, we first take averages of the measured hourly concentrations of all species for the whole day (midnight to midnight), daytime (7:00 a.m. to 6:00 p.m.), nighttime (midnight to 7:00 a.m., 6:00 p.m. to midnight), and isolate the maximum daily 1-hr concentrations and for some purposes, the maximum daily 8-hr concentrations. The daytime average is the part of the diurnal cycle that includes the daily maximum values of ozone, NO, and NO2 and sometimes the VOCs, and it represents the sunlit hours of the day at Yanbu.
These data were ranked by the days when the daytime ozone concentrations were the highest to the lowest. Averages were calculated for the conditions that prevailed during 10% of the highest ozone days, and 10% of the lowest ozone days. This is a measure of the largest changes of daytime ozone at Yanbu. We ask: Which factors changed the most in the transition from the highest ozone days to the lowest ozone days and by how much? We expect that the factors that changed the most are likely to be the causes of ozone formation and its variation at Yanbu. Which are causal factors and which may vary due to a common cause is guided by the basic theory discussed earlier. The same method is applied to SO2 and PM2.5 except that we take the days with the highest and lowest 10% levels of SO2 and likewise for PM2.5. The method is straightforward, and its interpretation is unequivocal.
The results are shown in for day, night, and 24-hr averages and the 1-hr maximum values. Percent differences were calculated relative to the high-pollution days as 100% × (CHigh − CLow)/CHigh. The variability is reported as 90% confidence limits represented by the error bars that are calculated by propagating the errors in CLow and CHigh (Meyer, Citation1975).
Figure 2. Factors affecting criteria pollutants at Yanbu. The difference of concentrations was calculated for conditions that lead to the highest 10% and the lowest 10% levels for the daytime averages of (a) O3, (b) PM2.5, and (c) SO2. Bars to the left show negatively correlated factors and to the right show the positively related ones; 90% confidence limits of the differences are shown as the error bars. Avg = 24-hr average concentrations; Max = 1-hr maximum; Day = Daytime and Night = Nighttime, both 12-hr averages.
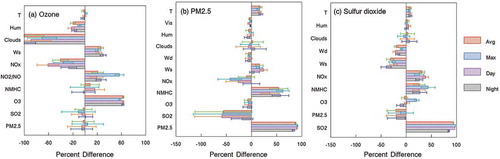
Let us examine the salient points of these results. Bars going to the left imply negative correlations with the targeted species (O3, SO2, or PM2.5), and bars to the right imply positive correlations. For all the comparisons, the relationships retain the same patterns whether averaged for daytime, nighttime, or the whole day (indicated as the average) or just the maximum hourly concentration for the day. Also shown in each figure is the percent change in the targeted species concentration between its 10% highest and lowest ranked days (for example, ozone varies by about 60%). For ozone, we see a close relationship with the NO2/NO ratio, as would be expected from the basic theory, at least for the daytime concentrations. NOx and cloud fraction are seen as a strong negative correlation; NOx because of the NO sink, and cloud fraction because more clouds reduce sunlight that reduces ozone production. Clouds can also increase updrafts and mixing of air that can reduce surface concentrations; however, at Yanbu, this effect may be small due to the sparse nature of the clouds and the observation that other ground-level pollutants are not affected. The negative correlation with humidity is also noteworthy and may reflect the effect of OH chemistry that depends on water vapor; however, it is not a strong impact. Perhaps somewhat unexpected is the lack of relationship with the VOCs, which is explored further in later discussions, and ozone has no relationships with SO2 and PM2.5. There is a weak positive and thus unusual relationship with wind speed, which will be discussed later. We see also that ozone concentrations are relatively stable, since the precursors have complex nonlinear and often compensating effects on ozone. The overall variation of daytime average ozone is only approximately ±50% from the mean of all measurements over the 6 yr.
Unlike ozone, SO2 is not affected by the cloud fraction and it is dispersed by the winds, as evident from the negative correlation. The relationship with NOx suggests that some of it may come from the same sources, which in this situation would be the refineries, petroleum industry, and power plants of Yanbu. There is a marginal statistically significant negative relationship with PM2.5, which is also seen in the analysis focused on the particles. It is caused by the wind, which disperses SO2 but kicks up dust, which adds to the particle counts. PM2.5 correlates with the nonmethane hydrocarbons, suggesting commonality of sources. We see that the daily average concentrations are widely different between high- and low-pollution days. For PM2.5 the variation is about a factor of 10 and for SO2 it is a factor of 20, compared with a factor of less than 3 for ozone.
VOC-NOx-O3 relationships
Since ozone concentrations depend entirely on chemical precursors and their interaction with the environment, we studied the relationships in more detail. The connections between ozone and its precursors, VOCs and NOx, is known to be nonlinear and complicated by the details of the chemical and meteorological variables prevalent at the location of interest. According to the general theory describing these relationships, it is useful to separate the conditions into several canonical regimes. If the VOC/NOx ratios are low, typically taken as less than ~5, there are not enough VOCs to interact with NOx to make the most ozone possible, leading to the VOC-limited regime. Under these conditions, increasing NOx emissions reduces ozone partly because of the strong NO sink, whereas increasing VOC emissions increases ozone, as the efficiency of NO to NO2 conversion increases. If, however, the VOC/NOx ratios are high, typically taken to be over 15, then the NOx is the limiting factor. Under these conditions, adding more VOCs does not affect ozone, since they generally are not effective sinks, but increasing NOx emissions increases ozone. In between these conditions, it is generally the case that increasing either NOx or VOCs would increase ozone (National Research Council, Citation1991; Seinfeld and Pandis, Citation1998; Sillman and He, Citation2002; Sillman, Citation2003). Across all of these regimes, ozone concentrations define isopleths. In the VOC-limited regimes, a simultaneous reduction of both VOCs and NOx at certain rates does not reduce ozone levels. Moreover, the same ozone value can occur for widely differing combinations of precursor levels. We use this general theory as a guide to analyze the observations at Yanbu with two goals in mind: to characterize the nature of this connection for the conditions at Yanbu, and to use the results to explain, semiquantitatively, some of the differences, or lack thereof, in ozone concentrations observed under different environmental and cultural conditions at Yanbu.
At Yanbu, when the relevant data were available, VOC-limited conditions may have prevailed 51% of the time when the VOC/NOx ratio was <5 (low). It was >15 only 12% of the time, representing possible NOx-limited conditions (high), and the rest, that is, 37% of the time, the ratio was in between (medium). We divided the data into these three regimes to delineate the effect of the precursors VOCs and NOx, the independent variables, on ozone, the dependent variable. The results are shown in . The lines are obtained by a 50-point moving average filter of the data showing a detailed picture of what happened. The discrete points are statistically independent 50-point averages and usable for estimating the sensitivity of ozone to changes in NOx and VOCs, as we have done.
Figure 3. The relationship between VOCs, NOx, and O3 based on observed concentrations at Yanbu. (a) Daytime ozone decreases with increasing NOx especially when NOx exceeds about 20 ppb. (b) The relationship with VOCs is nonlinear for concentrations less than ~100 ppb; above that, ozone increases with increasing except when the VOC/NOx ratio is low. (c) Under various VOC conditions, the maximum ozone behaves differently from the daytime average ozone. Up to NOx levels of 20–30 ppb depending on the VOC regime, maximum hourly ozone increases with increasing NOx, but falls dramatically once that limit is exceeded. (d) VOCs have a similar effect on maximum ozone as the daytime average ozone, except that low-VOC conditions lead to lower ozone and the highest values of hourly maximum ozone occur when both NOx and VOCs are highest.
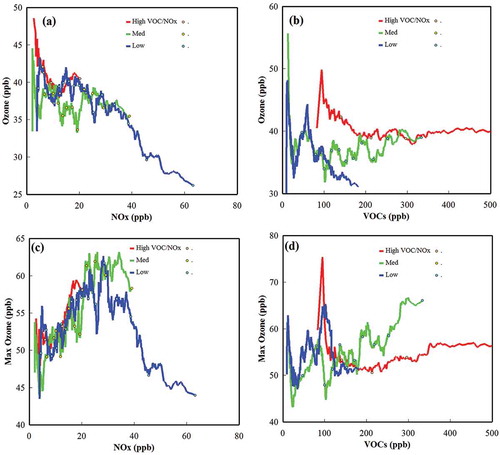
We see that when the VOC/NOx ratio is low, ozone decreases with increasing NOx, as would be expected from the standard theory. The relationship between NOx and ozone is about the same for the medium ratios when NOx is above about 25 ppb, which occurs about 30% of the time in the data. Below that concentration, the relationship between NOx and ozone is nonlinear but is similar across the three regimes and is generally negative. Based on the daytime average data in each category, the rates of change are δ[O3]/δ[NOx] = −0.23 ± 0.05 (all NOx and VOC/NOx <5), −0.2 ± 0.1 (NOx >25 ppb and medium VOC/NOx), and negative but not statistically significant for the remaining conditions (−0.1 ± 0.1, NOx <25 ppb, medium and high VOC/NOx pooled together). The hourly maximum ozone behaves differently from the daytime averages in many ways, as seen in , constructed in the same way as described earlier. We see again that NOx ~25 ppb divides the results. Above that concentration, maximum ozone concentrations decline with increasing NOx, but below that the maximum rises in all three regimes. We calculate that δ[O3]/δ[NOx] = −0.5 ± 0.3 (NOx >25 ppb), +0.4 ± 0.2 (NOx <25 ppb). The latter estimate is for all three regimes, since the results were very similar, with the high VOC/NOx conditions showing slightly higher sensitivity.
The relationship between VOCs and ozone can also be looked at as divided by VOC concentrations at about 100 ppb. Above this level, daytime ozone does not change with increasing VOCs for the high-ratio regime, which represents NOx-limited conditions, and increases in the medium-ratio regime; both features are expected from the standard theory. The maximum 1-hr ozone behaves the same. We estimate δ[O3]/δ[VOCs] = +0.017 ± 0.012, +0.07 ± 0.02 (VOCs >100 ppb) for ozone and maximum ozone sensitivities, respectively, in the medium VOC/NOx ratio regime. The maximum ozone also appears to increase in the high-ratio case, but the change is small and not statistically significant. The rest of the time, that is, for VOCs <100 ppb, the relationship with O3 is highly nonlinear, as shown in , leading to some of the highest values of ozone seen in Yanbu. In this region of the VOC-NOx space, which represents about 50% of the data, the connection with ozone is unusual. Increases of VOCs in this anomalous region can either increase or decrease ozone substantially. These observations may result from phenomena not included in the standard theory. There are two known aspects. One is that there are industrial sources that may be near enough to the sampling site to affect precursors but not the ozone as much because the transport times may be shorter than the ozone formation time scales. Along the same lines, specific emissions may cause a high impact on ozone. For instance, there is an ethylene production facility in Yanbu that can at times increase local ozone production because of its emissions (Yanpet, Citation2015; Ryerson et al., Citation2003). Perhaps the more probable cause of the unusual VOC-NOx-O3 connection could be that substantial amounts of ozone may come in from a background pool, possibly aloft. This can increase observed ozone concentrations without being connected with the observed VOC and NOx emissions (Khalil et al., 2015). Qualitative evidence for the background factor is seen in the high ozone concentrations just before sunrise and before the high NO from traffic (shown later in ).
Figure 4. The effect of wind on the average hourly concentrations of the criteria pollutants and their precursors at Yanbu. (a) Average hourly wind speed in four categories (see text). In each wind category, we plot average hourly concentrations of fine particles (b) PM2.5, (c) PM10, (d) visibility (km), (e) SO2, (f) temperature, (g) VOCs, (h) NOx, and (i) ozone. The double peak of PM2.5 concentrations is seen as caused by two different phenomena. The morning peak corresponds to the traffic mix, and the afternoon peak comes from wind blown dust, since other pollutants are low at that time. For all species, SO2, VOCs, NOx, and also the PM2.5, the morning concentrations decrease with higher winds, as expected from the higher resulting dispersal rate.
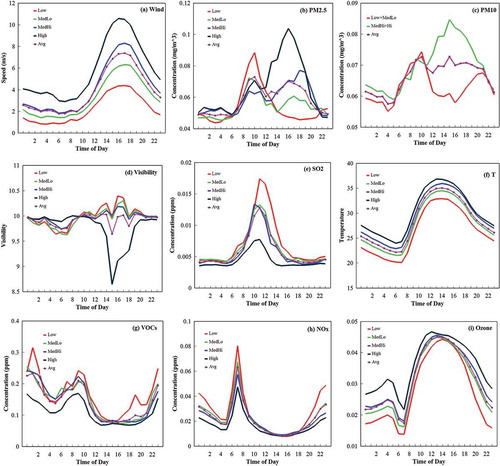
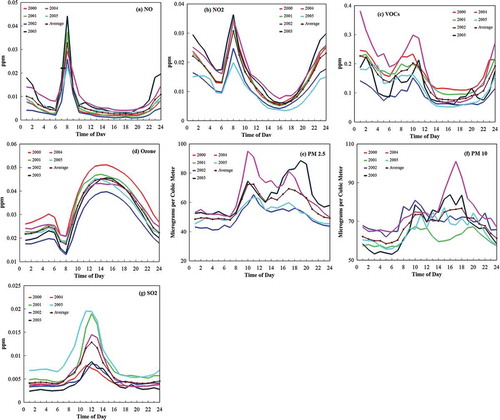
Figure 5. Average hourly levels of criteria pollutants at Yanbu. The data are averaged across the 6 yr of measurements (2000–2005) showing both the average conditions and the interannual variability. (a) NO, (b) NO2, (c) VOCs, (d) ozone, (e) PM2.5, (f) PM10, and (g) SO2.
Meteorological variables
The environmental variables, temperature, wind speed and direction, humidity, and cloudiness all affect the final observed atmospheric concentrations of the pollutants and are not included in the results of the standard theory discussed earlier. These variables interact with the atmospheric chemistry to create synergistic effects, some of which are seen in the analysis of the ozone cycle in the last section. At Yanbu, the meteorology has variable effects on the criteria pollutants and their precursors. The most dramatic is the effect of wind on the concentrations of fine particles.
Wind speed
We divided the pollutant data into four approximately equal groups when daily average wind speeds were low (0–2.75 m/sec), medium low (2.75–3.75 m/sec), medium high (3.75–4.75 m/sec), and high (> 4.75 m/sec). Then we calculated the average diurnal cycle of the criteria pollutants and their precursors in each of these categories. The results are shown in .
We see that the wind has a pattern of picking up around midday and reaching a peak in the afternoon before dying down for the night. Generally, transport and dispersion processes predict that the concentrations of gases or particles emitted from the surface will be inversely related to the wind speed. In , we see how significantly wind speed affects the particulate levels. The first peak is closely related to morning traffic and coincides with the injections of NOx and VOCs shown in . The level of particulate pollution in this peak rises when the wind speed is low, as would be expected for basic theory. Also noteworthy is that for low-wind conditions, there is no second peak of particle concentrations during the afternoon, which suggests that the wind does not affect the morning peak, since at that time of day the wind is generally even lower than the daytime average. We conclude that for the low-wind conditions, the PM2.5 levels are determined by human activities. The second peak starts to build as the winds get higher and exceeds the morning peak for high-wind conditions. The visibility observations similarly averaged further support the fact that the afternoon peak of the particles has a readily perceptible impact on the environment, creating hazier conditions than the morning emissions. One reason that the visibility is degraded more during the afternoon peak compared with the morning peak is that the wind kicks up more than just the PM2.5 size particles, and so the larger particles degrade visibility even more than the fine particles alone. The double peak of particle concentrations is thus explained unequivocally by wind speed and has important implications for estimating the exceedances of the standards, as we will see later. The concentrations of SO2, VOCs, and NOx decrease with increasing wind as would be expected; however, the daytime average ozone concentration increases by about 50% when winds are high compared with low-wind conditions, which we will discuss later.
At Yanbu, based on the hourly measurements, 95% of the time the wind came from over the sea and only 5% from over the land. Of the cases of wind from the seaside, there were about 30% of the cases that came from a southerly direction along the coastline and practically none from the north side. There are small differences in the concentrations of the criteria pollutants under these conditions, but because of the rarity of the land influences, they are not an important feature of the air quality of Yanbu. These results provide further evidence that air pollution from other locations in the region does not affect the conditions at Yanbu.
Temperature
We investigated the effect of the remaining meteorological variables on the criteria pollutants by analyzing the differences of concentrations during 10% of the warmest days compared with 10% of the coolest days, and similarly for clouds and humidity. The salient results were that there was less ozone on warmer days than during cool days, with average temperature differences of ~10 °C (winter: no effect; spring: −1.8 ± 0.6%/°C; summer: −2.7 ± 1.3%/°C; fall: −1.3 ± 0.8%/°C). The PM2.5 particle concentrations were higher during warm days compared with cool days (winter: no effect; spring: +2 ± 2%/°C; summer: +5 ± 5%/°C; fall: +5 ± 2%/°C). The hourly maximum ozone had a similar relationship with temperature (winter: positive but not statistically significant; spring: −1.7 ± 0.7%/°C; summer: −2.6 ± 1.7%/°C; fall: negative but not statistically significant). The effects on SO2 were mixed and variable, less during hot days in summer (+3 ± 2%/°C) and more in winter (−6 ± 5%/°C).
The effects of temperature cannot be uncoupled from the winds. As seen in , wind and temperature are highly correlated, that is, hotter temperatures occur with higher winds and vice versa. For ozone, the higher temperature is expected to increase production, but it comes at the same time as higher winds, causing opposing effects on the concentration in which the wind wins, leaving a residual lower concentration on hotter days. Similarly, the higher level of particles during the hot conditions was most likely caused by the accompanying higher winds during such days.
Clouds and humidity
Clouds and humidity had small effects on the criteria pollutants and are reported here for completeness. Increasing cloud fraction generally decreased ozone, which we believe is caused by the reduction of sunlight driving the photochemistry. Observational data, reported as the percent of sky covered by clouds, suggest that clouds occur often but are thin and nocturnal, evaporating before midday; hence, their effect is small but observable. It was −0.53 ± 0.14%/%, that is, in % change of ozone for each 1% increase of cloud cover. There was no effect on SO2 and particles. On more humid days, daytime ozone concentrations were lower on average compared with less humid days (−0.44 ± 0.13%/%, that is, in % change of ozone for each 1% increase in the humidity). SO2 was higher on more humid days (+0.4 ± 0.3%/%) and PM2.5 particles were not affected.
Hourly levels of criteria pollutants
We now take a closer look at the concentrations during the day because these determine exposure of people to pollutants and are used to set standards. shows the hourly concentrations of the pollutants.
We see a well-known pattern of photochemical ozone production in which NO and VOCs are injected into the morning air by traffic which is made into NO2, and then ozone builds as described by the basic theory discussed earlier. NOx, VOCs, and particles reach high values twice a day. The second peak of NOx and the hydrocarbons occurs around midnight, which may be unique to the desert environment of Yanbu. Because of the hot climate, there is considerable nighttime activity, which is the likely cause of the night peak. The nighttime ozone rises slowly until sunrise when the addition of large amounts of NO destroys it, resulting in its lowest concentrations of the day around about 8:00 am. The second daytime peak of the particles is caused by the wind as we have already discussed in some detail. A possible increase of other pollutants in the late afternoon caused by return traffic is probably washed out by the high wind at that time.
There is moderate interannual variability in all the species that were measured, but the daily pattern is remarkably similar from year to year. As is evident from looking at , for most of the years, the ozone concentrations are close to the average pattern despite the variability of the precursors; however, the years 2000 and 2002 depart from the average by about ±15% for daytime average concentrations. In 2000, the contributing factors were the higher than average levels of NOx and VOCs and the cloud fraction was at its lowest, which also led to a warmer year. In 2002, the levels of VOCs and NOx were both lower but the low ozone values remain unaccounted for by the average changes in the precursors or the meteorological variables.
Both the environmental conditions, particularly sunlight, and living patterns change with seasons, affecting the levels of the pollutants. Yanbu is at 24°N latitude, so the seasonal variations are modest but affect air quality significantly, as shown in .
Figure 6. Seasonal patterns of air pollution in Yanbu. (a) NO, (b) NO2, (c) VOCs, (d) ozone, (e) PM2.5, and (f) SO2.
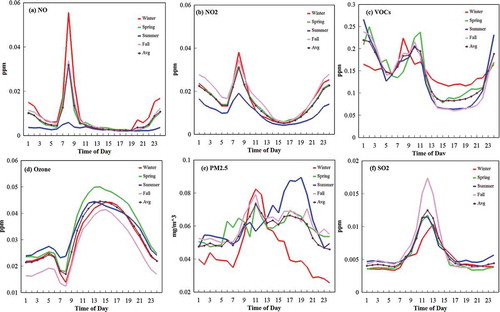
The highest ozone concentrations occur in spring at about 12% above the annual average for the daytime and the lowest in fall at about 15% less than the annual daytime average. For ozone between fall and spring, the difference is about 9 ± 1 ppb, which is the largest difference between seasons. Compared with spring, NOx is higher in fall (2.5 ± 1.3 ppb) and the VOCs less (-10.3 ± 15 ppb), causing a lower ozone concentration due to the NO sink and lack of VOCs. For the extreme seasons, ozone is a little less in winter than summer (−3 ± 1 ppb), caused by a combination of effects from chemistry and meteorology: The higher NOx (11.5 ± 1 ppb), less solar radiation, lower temperatures, and a higher cloud fraction (+4.4 ± 1.3%) in winter compared with summer will tend to decrease ozone, and higher VOCs (20 ± 12 ppb) may increase it, leading to the slightly lower residual levels.
Cultural effects on criteria pollutants
At Yanbu, as in all parts of the world, cultural factors have a significant effect on emissions and hence the concentrations of criteria pollutants. Generally, when the normal work cycle is disrupted, the daily ozone production and the concentrations of other pollutants are altered, as can be seen in –. It is expected that there would be less pollution during holidays, but mass activities can also increase pollution levels for some times of the day. For Saudi Arabia, the main cultural factors are the weekends, two Eid celebrations each year, the month of Ramadan, and the 5 days of Hajj every year. The weekend in Saudi Arabia at the time of the measurements was Thursdays and Fridays. The two Eids: al-Fitr and al-Adha, Ramadan, and the Hajj fall on days that shift by 11 or 12 days every year because of the lunar calendar on which they are based.
Figure 7. The weekend effect at Yanbu. (a) to (c) show that NO, NO2, and VOCs, respectively, are reduced during the weekend (Thursday–Friday), particularly on Fridays (−120 ± 30%, −34 ± 9%, and −12 ± 12%. Respectively, for daytime averages); however, in (d), we see that the ozone is slightly higher (+5 ± 3% for daytime averages). In (e), we see that SO2 is also lower on Fridays (−14 ± 12% day average) and (f) the PM2.5 particles are slightly lower.
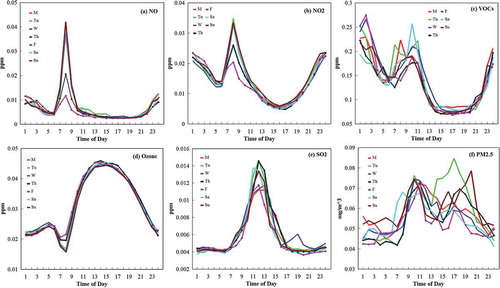
Figure 8. Percent change of criteria pollutants during the month of Ramadan in Yanbu relative to non-Ramadan months (see text). The results indicate increased nighttime activity and reduced emissions of NOx during the daytime.
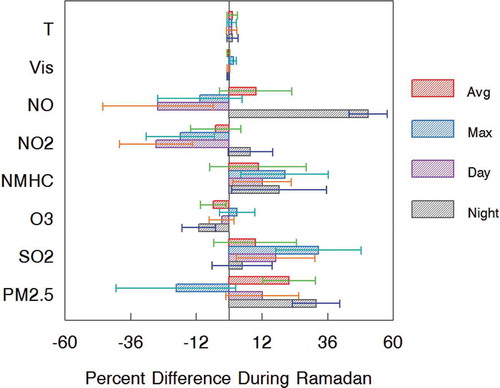
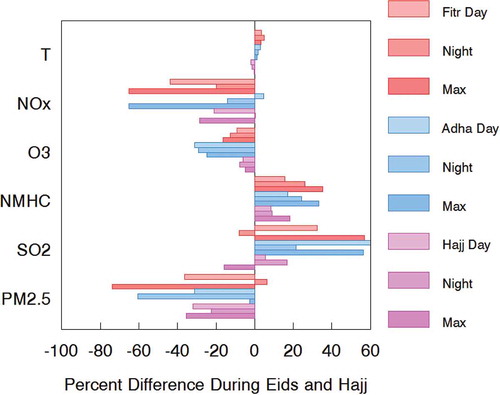
Figure 9. Percent change of air quality during major cultural events: Eid al-Fitr, Eid al-Adha, and the Hajj.
Yanbu weekend
Thursdays are relatively unremarkable in terms of difference of pollutant levels relative to the rest of the week. The ozone precursors are substantially lower on Fridays compared with the work week, yet the ozone levels are slightly higher, as can be seen in . This is a well-known effect seen in many urban areas of the United States and the rest of the world. The reduced emissions, and hence the concentrations of precursors NOx and VOCs, can have compensating effects on ozone, especially when the conditions are VOC limited, as it seems to be the case at Yanbu (California Air Resources Board, Citation2015; Blanchard et al., 2015). NOx is less than half of the normal values, and the VOCs are about 15% less. Sulfur dioxide, which is from industrial sources, is lower only on Fridays, but the PM2.5 particles are about the same as on other days ().
Ramadan
Ramadan is a special month when people fast during the daylight hours. In Saudi Arabia, as in other Islamic countries, although work continues, the patterns associated with daily activities change drastically. We analyzed the data from Yanbu by defining October 4 to December 28 of each year as the Ramadan period. All six Ramadans fell within this time, with one at each end. We then took the averages for the daytime, nighttime, and maximum levels of ozone and other variables for this entire period, pooling all the years but with the Ramadan months taken out, constituting our background or control. We then calculated the same averages for the six Ramadan months during the course of the study. The percent differences are calculated as: 100% × (CRamadan − CNon-Ramadan)/CNon-Ramadan. This method equalizes influences of seasonal and other factors as the Ramadan shifts from year to year. The results are shown in .
We see from the figure that emissions of NOx are generally reduced during the daytime but increase substantially during night indicating a shift in activity. Particle concentrations are also higher during the night. In the hot desert, there is generally more nightlife than in temperate environments, but during Ramadan this is significantly increased, as people visit restaurants and other public places after breaking the fast at sundown. These establishments remain open longer specially for this time of year, as the cycle of eating is nearly reversed between day and night. Ozone concentration, however, decline during the night and are about the same during the daytime as the non-Ramadan background. The nighttime reduction is likely caused by the significantly higher NO, as seen in .
Eids and the Hajj period
Although the Hajj is concentrated in Makkah, where it has the greatest impact on air quality, it is a period when normal activities of the society are affected to varying degrees everywhere in the country (Butenhoff et al., Citation2015). At Yanbu, the effect was seen to be small and negligible but had a similar pattern to the Eid days. Eid al-Fitr occurs right after Ramadan and Eid al-Adha comes right after the Hajj. We used the same method as for Ramadan to analyze the data, that is, by defining the whole period over which the Eids occurred, taking the average for the days in this period without the Eid days and then the average for the Eid days and likewise for the Hajj. The results are shown for all three events (Hajj and the two Eids) in .
Most of the individual differences are fairly large but do not reach statistical significance; however, the patterns are the same in all three events, making them more robust indicators of the conditions. We see less NOx, O3, and particles and more SO2 and VOCs, which may have common sources.
Exceedances of standards
For Yanbu, the population is modest, the meteorological factors are favorable, and there is little vegetation, so the biological VOCs are probably negligible. Aside from the busy automobile traffic, the only other factors that contribute to air pollution are the petrochemical industry and affluent lifestyles. From year to year, these factors constantly increase the emissions of the pollutants or the precursors and may by now have led to less healthy air than the time for which we have data. As mentioned earlier, a special royal commission oversees the balance between industrialization and environmental quality. Nonetheless, the air quality standards are exceeded from time to time, even for the period we are considering (2000–2005).
There are widely varying standards for air quality, all of which are purported to have been set based on health impacts. We will look at the results of four such standards: the United States National Ambient Air Quality Standards (NAAQS), the World Health Organization standards (WHO), the Saudi Arabian national standards implemented by the Presidency of Meteorology and the Environment (PME), and the special standards set by the Royal Commission Environmental Regulations (RCER) for Yanbu. Of these, the WHO standards are the strictest, followed by the U.S. Environmental Protection Agency (EPA), RCER, and PME (see ).
Table 1. Standards for criteria pollutants.
The exceedances calculated for Yanbu are shown in . We can see that the ozone standards are rarely violated according to the EPA standards and even less so by Saudi Arabian standards, which are less stringent. Sulfur dioxide appears to be a significant issue according to the EPA standards but only a modest problem from the Saudi Arabian standards. Both the data and exceedance counts show that SO2 pollution may be increasing and probably demands attention. According to WHO standards, the air quality may be considered to be low. These standards are the most stringent; however, it is likely that other similar urban areas of the world would fare worse than Yanbu. Even after removing the wind effect, the particle standards are violated most often. There were 287 days of low-wind conditions when PM2.5 concentrations were measured, as discussed previously and shown in . These days favor high concentrations and hence the likelihood of exceeding the standards; however, it is likely that these limits were exceeded on many of the other days for which we are not able to make an estimate of the anthropogenic contributions.
Table 2. Exceedances of criteria pollutants at Yanbu.
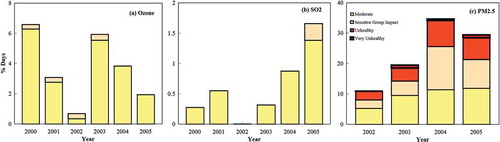
In the United States and other industrialized countries, pollution levels are associated with health impacts using an air quality index (AQI). It is a means to convey to the public how healthy or unhealthy the air is on a particular day. We use it here to connect the measured concentrations with possible health effects and will not deal with whether the index means what it says, or whether the air pollution may be better or worse in parts of the city that are distant from the measurement site. For each pollutant, an index value of 0–50 is considered “good,” 51–100 is “moderately polluted,” 101–150 is “unhealthy for sensitive groups,” 151–200 is “unhealthy,” 201–300 is “very unhealthy,” and over 300 is “hazardous.” We calculated the EPA’s index for Yanbu and summarize the results in , expressed as the % of the days when the air quality was not good, that is, AQI >50 (EPA, Citation2006, Citation2015). For ozone pollution, we see that about 3% of the time on average there would be moderate health concern and rarely (<1%) was it high enough to cause an impact to sensitive groups. For SO2, about 1% of the time there were days when it could be a moderate or unhealthy for sensitive groups. PM2.5 levels, on the other hand, were in the moderate-pollution category about 9% of the time, reaching unhealthy levels ~6% of the time and even very unhealthy conditions a few times.
Figure 10. The EPA air quality index (AQI) applied to Yanbu for (a) ozone, (b) SO2, and (c) PM2.5. The index connects pollution levels directly to health impacts. At Yanbu, the air quality would be considered very good based on this index except for the high levels of fine particles that reached levels of concern during the course of the study and may be increasing. The PM2.5 is only from those days when the winds were low enough to have an assumed negligible effect from wind blown dust as shown in Figure 4 and discussed in the text.
Conclusions
We have looked at a hourly air quality data set from Yanbu in Saudi Arabia taken over 6 yr. It represents a prototype of a human environment distant from large natural influences that affect air pollution. The pollution levels seen at Yanbu are similar to other industrialized urban areas of similar size and character. This was shown in our earlier paper by Butenhoff et al. (Citation2015). There is a widespread difference in standards used to gauge the quality of air. The WHO standards are very stringent, and according to these, there are quite frequent exceedances of all the criteria pollutants: SO2, O3, and PM2.5. However, according to the Saudi national standards, and even the special standards set up for Yanbu, there are very few violations. The EPA’s criteria are in between these.
For ozone, the trends seemed to be towards less pollution in the more recent years of measurements, especially when determined by the WHO standards. The connection between the precursors NOx and VOCs and ozone was found to be complicated but frequently in the VOC-limited regime. This may be because of a lack of plants and biogenic VOCs. It is apparently not offset by the emissions from the petroleum industry processes. We noted two factors that complicate the VOC-NOx-O3 relationships, namely, the proximity of sources to the sampling site and ozone transported from an external pool, most likely aloft. When ozone concentrations are low, the pool may be the biggest supplier of ozone, which is unrelated to local VOCs and NOx.
Perhaps because of the petroleum industry, moderate levels of SO2 pollution occur. There is an indication that the concentrations and the exceedances were on the rise during the time of the measurements and may be worse by now if these trends have persisted. Levels of fine particles (PM2.5) were frequently high enough to violate most standards; however, we showed that there is a large component caused by windblown dust from the desert. When this is accounted for, moderate levels of particulate pollution persist that can affect sensitive groups. The overall picture, however, is of good air quality from both EPA and Saudi standards, but less so from the WHO standards.
It is noteworthy that 10–15 yr have passed since our data were taken and the data for Yanbu in Butenhoff et al. (Citation2015) are for the time 8 yr ago (see also Al-Jeelani, Citation2014). There has been considerable growth in Yanbu over this time. The population has increased at about 3.8% per year between 1992 and 2014 and so have the industrial activities that support this population (Royal Commission Yanbu, Citation2010; Thomas Brinkhoff, Citation2015). These changes must have made the air pollution worse by now. If a new measurement program is implemented, our work here can be used to show directly and quantitatively how the changes of both population and industry affects air pollution in Yanbu.
Acknowledgments
The authors thank The Presidency of Meteorology and Environment (PME) in Saudi Arabia for providing observational data sets. Additional support was provided by Andarz Co. in Portland, Oregon, the Center for Climate and Aerosol Research, and the Institute of Sustainable Solutions at Portland State University.
Funding
Financial support for this project was provided by King Abdulaziz University under grant no. 4-10-1432/HiCi.
Additional information
Funding
Notes on contributors
M.A.K. Khalil
M. Aslam K. Khalil is a professor in the Department of Physics at Portland State University in Portland, OR.
Christopher L. Butenhoff
Christopher L. Butenhoff is an assistant professor in the Department of Physics at Portland State University in Portland, OR.
William C. Porter
William C. Porter is a research associate in the Department of Civil and Engineering at Massachusetts Institute of Technology, in Cambridge, MA.
Mansour Almazroui
Mansour Almazroui is the director of the Center of Excellence for Climate Change Research at King AbdulAziz University, in Jeddah, Saudi Arabia.
Abdulrahman Alkhalaf
Abdulrahman Alkhalaf is a professor of meteorology in the Faculty of Meteorology, Environment and Arid Land Agriculture at King AbdulAziz University, in Jeddah, Saudi Arabia.
Mohammed Saleh Al-Sahafi
Mohammed Saleh Al-Sahafi is Director General of Environmental Standards and National Ozone Coordinator at the Presidency of Meteorology and Environment in Saudi Arabia.
References
- Al-Jeelani, H.A. 2014. Diurnal and seasonal variations of surface ozone and its precursors in the atmosphere of Yanbu, Saudi. J. Environ. Protect. 5:408–422. doi:10.4236/jep.2014.55044
- Blanchard, C.L., S. Tanenbaum, and D.R. Lawson. 2008. Differences between weekday and weekend air pollutant levels in Atlanta. Baltimore, Chicago, Dallas–Fort Worth, Denver, Houston, New York, Phoenix, Washington, DC, and surrounding areas. J. Air Waste Manage. Assoc. 58:1598–1615. doi:10.1080/10473289.2003.10466222
- Butenhoff, C.L, M.A.K. Khalil, W.C. Porter, M. Almazroui, A.K. Al-Khalaf, and M.S. Al-Sahafi. 2015. Evaluation of ozone, nitrogen dioxide and carbon monoxide at nine sites in Saudi Arabia during 2007. J. Air Waste Manage. Assoc. 65:871–886. doi:10.1080/10962247.2015.1031921
- California Air Resources Board. 2015. The ozone weekend effect in California. http://www.arb.ca.gov/research/weekendeffect/weekendeffect.htm (accessed February 12, 2015).
- Hester, R.E., and R.M. Harrison. 1998. Air Pollution and Health. Cambridge, UK: The Royal Society of Chemistry.
- Meyer, S.L. 1975. Data Analysis for Scientists and Engineers. New York: Wiley.
- National Research Council. 1991. Rethinking the Ozone Problem in Urban and Regional Air Pollution. Washington, DC: National Academies Press.
- Peng, R.D., F. Dominici, R.P. Barriuso, S.L. Zeger, and J.M. Samet. 2005. Seasonal analyzes of air pollution and mortality. Am. J. Epidemiol. 161:585–594. doi:10.1093/aje/kwi075
- Porter, W.C., M.A.K. Khalil, C.L. Butenhoff, M. Almazroui, A.K. Al-Khalaf, and M.S. Al-Sahafi. 2014. Annual and weekly patterns of ozone and particulate matter in Jeddah, Saudi Arabia. J. Air Waste Manage. Assoc. 64:817–826. doi:10.1080/10962247.2014.893931
- Presidency of Meteorology and Environment. 2015. Air pollution. http://www.pme.gov.sa/en/en_airpollution.asp ( accessed October 10, 2015).
- Royal Commission Environmental Regulations. 2004. Royal Commission for Jubail and Yanbu. Yanbu, Saudi Arabia: Royal Commission Environmental Regulations, Environmental Control Department.
- Royal Commission for Jubail and Yanbu. 2014. Yanbu Industrial City Economic Review 1st Q. 2015. Report No. 19. https://eservices.rcyanbu.gov.sa/Doc/YanbuIndustrialCityEconomicReview.pdf) ( accessed October 10, 2015).
- Royal Commission Yanbu. 2010. A Guide for an Investor. https://eservices.rcyanbu.gov.sa/Doc/ROYAL%20COMMISSION%20FOR%20JUBAIL%20AND%20YANBU%20_EDITED_%20final.pdf ( accessed October 10, 2015).
- Ryerson, T.B., M. Trainer, W.M. Angevine, C.A. Brock, R.W. Dissly, F.C. Fehsenfeld, G.J. Frost, P.D. Goldan, J.S. Holloway, G. Hübler, R.O. Jakoubeck, W.C. Kuster, J.A. Neuman, D.K. Nicks Jr., D.D. Parrish, J.M. Roberts, D.T. Sueper, E.L. Atlas, S.G. Donnelly, F. Flocke, A. Fried, W.T. Potter, S. Schauffler, V. Stroud, A.J. Weinheimer, B.P. Wert, C. Wiedinmyer, R.J. Alvarez, R.M. Banta, L.S. Darby, and C.J. Senff. 2003. Effect of petrochemical industrial emissions of reactive alkenes and NOx on tropospheric ozone formation in Houston, Texas. J. Geophys. Res. Atmos. 108:(D8). doi:10.1029/2002JD003070
- Seinfeld, J.H., and S.N. Pandis. 1998. Atmospheric Chemistry and Physics. New York: John Wiley.
- Sillman, S., and D. He. 2002. Some theoretical results concerning O3-NOx-VOC chemistry and NOx-VOC indicators. J. Geophys. Res. 107(D22):4659. doi:10.1029/2001JD001123
- Sillman, S. 2003. Treatise on Geochemistry, Vol. 9: Environmental Geochemistry, ed. B. S. Lollar. New York: Elsevier.
- Thomas Brinkhoff. 2015. City Population. Saudi Arabia. http://www.citypopulation.de/SaudiArabia.html ( accessed October 10, 2015).
- U.S. Environmental Protection Agency. 2006. Guideline for Reporting of Daily Air Quality—Air Quality Index (AQI). EPA-454/B-06-001. Washington, DC: U.S. Environmental Protection Agency.
- U.S. Environmental Protection Agency. 2015. Air Quality Index: A Guide to Your Health. EPA-456/F-14-002. Washington, DC: U.S. Environmental Protection Agency.
- WeatherSpark. 2015a. Beautiful Weather Graphs and Maps. https://weatherspark.com/ ( accessed February 21, 2015).
- WeatherSpark. 2015b. Average Weather for Yanbu, Saudi Arabia. https://weatherspark.com/averages/32787/Yanbu-Al-Madinah-Saudi-Arabia (accessed October 10, 2015).
- Wikipedia. 2015. Yanbu. http://en.wikipedia.org/wiki/Yanbu ( accessed April 13, 2015).
- World Health Organization. 2006. Air Quality Guidelines for Particulate Matter, Ozone, Nitrogen Dioxide and Sulfur Dioxide: Summary of Risk Assessment. Geneva, Switzerland: World Health Organization.
- World Health Organization. 2015. Ambient (outdoor) air quality and health http://www.who.int/mediacentre/factsheets/fs313/en (accessed April 13, 2015).
- Yanpet. 2015. Yanbu (Yanpet), Saudi Arabia. http://www.chemicals-technology.com/projects/yanpet (accessed October 10, 2015).