
ABSTRACT
Due to concerns about adverse health effects associated with inhalation of atmospheric polycyclic aromatic hydrocarbons (PAHs), 30 ambient air samples were obtained at an air quality monitoring station in Palm Beach County, Florida, from March 2013 to March 2014. The ambient PAH concentration measurements and fractional emission rates of known sources were incorporated into a chemical mass balance model, CMB8.2, developed by EPA, to apportion contributions of three major PAH sources including preharvest sugarcane burning, mobile vehicles, and wildland fires. Strong association between the number of benzene rings and source contribution was found, and mobile vehicles were identified to be the prevailing source (contribution ≥56%) for the observed PAHs concentration with lower molecular weights (four or fewer benzene rings) throughout the year. Preharvest sugarcane burning was the primary contributing source for PAHs with relatively higher molecular weights (five or more benzene rings) during the sugarcane burning season (from October to May of the next year). Source contribution of wildland fires varied among PAH compounds but was consistently lower than for sugarcane burning during the sugarcane harvest season. Determining the major sources responsible for ground-level PAHs serves as a tool to improving management strategies for PAH emitting sources and a step toward better protection of the health of residents in terms of exposure to PAHs. The results obtain insight into temporal dominance of PAH polluting sources for those residential areas located near sugarcane burning facilities and have implications beyond Palm Beach County, in areas with high concerns of PAHs and their linked sources.
Implications: Source apportionment of atmospheric polycyclic hydrocarbons (PAHs) in Palm Beach County, Florida, meant to estimate contributions of major sources in PAH concentrations measured at Belle Glade City of Palm Beach County. Number of benzene rings was found to be the key parameter in determining the source with the prevailing contribution. Mobile vehicle sources showed a higher contribution for species with four or fewer benzene rings, whereas sugarcane burning contributed more for species with five or more benzene rings. Results from this study encourage more control for sugarcane burns and help to better manage authorization of the sugarcane burning incidents and more restrictive transportation plans to limit PAH emissions from mobile vehicles.
Introduction
Polycyclic aromatic hydrocarbons (PAHs) are a class of organic compounds containing at least two benzene (C6H6) rings. They are associated with a variety of short-term symptoms, including eye irritation, nausea, vomiting, and diarrhea, and long-term health effects including reduction in the number of red blood cells, liver and kidney damage, and an increased risk of skin, lung, bladder, and gastrointestinal cancers (Kim et al., Citation2013). Depending on their vapor pressure and ambient temperature, PAHs appear in the gas phase or adsorb onto particulate matter (de Andrade et al., Citation2010; Yang et al., Citation2004). Gaseous PAHs are mainly emitted from evaporation or combustion of fuels. Persistent, toxic, and carcinogenic/mutagenic, atmospheric PAHs are generated from pyrosynthesis (i.e., formation of free radicals from low hydrocarbons at temperatures greater than 500ºC) and pyrolysis (i.e., cracking of organic compounds) processes (Ravindra et al., Citation2008). Common sources for PAH emissions include natural sources such as forest fires and volcanic eruptions, and antropogenic sources such as coal combustion, tobacco smoke, biomass burning, transportation, industrial boilers, and waste incinerators (Yang et al., Citation1998). Due to accumulation of these pollutants, the risk of human exposure to the atmospheric PAHs in highly populated urban areas is a major concern (Harrison et al., Citation1996).
With an estimated population of 1.4 million as of 2013, Palm Beach County is the third most populous county in Florida. Coal combustion is recognized to be one of the most PAH polluting sources in residential areas (Kim et al., Citation2013). Biomass burning and transporatation are another two sources contributing the most in source apportionment modeling of PAH emissions. However, according to the National Emission Inventory (NEI) for Palm Beach County in 2013, prescribed/wild fires and agricultural field burning emit the highest total mass of PAHs to the atmosphere (see ). The main reason for exclusion of coal combustion as a source of PAH emissions from this table is that the electric power of the Palm Beach County is supplied by the West County Energy Center power plant (3.6 GW), which is essentially a gas–oil plant. In particular, preharvest burning of sugarcane fields spread out throughout the Palm Beach County is a common practice in to facilitate quick, productive, and inexpensive removal of the unwanted biomass (Hall et al., Citation2012). Preharvest burning offers threefold reduction in physical labor compared to conventional harvesting (Gullette et al., Citation2006; de Assuncao et al., Citation2014). However, this method of uncontrolled biomass burning creates an oxygen-deficient condition wherein incomplete combustion of organic materials results in formation of PAHs. The high-temperature flame lifts the combustion products to a higher altitude, and the the combustion products may then be transported to downstream residential areas (Jenkins et al., Citation1996; Rajput et al., Citation2011; Hall et al., Citation2012; Singh et al., Citation2013).
Table 1. Emission inventory of total PAHs emission in Palm Beach County in 2013.
All burning operations in Florida are required to obtain a permit from the Florida Forest Service of the Florida Department of Agriculture and Consumer Services. The burning authorizations obtained from the Florida Forest Service Reporting System for Palm Beach County from March 11, 2013, to March 30, 2014 (the time period of focus in the present study), are summarized in . During this time period, an estimated area of 420,000 acres (170,000 ha; accounts for 28% of the county’s total area) was burned, and the agricultural sector dominated the burning for 98.5% of total authorized fires. Within the agricultural sector, sugarcane burning was the main burning type and overall contributed to 88.2% of authorized fires and 89.1% of authorized acres. These values indicate that sugarcane burning is potentially a major contributing source of PAHs in the county.
Table 2. Summary of burn authorization by the Florida Forest Service Reporting System.
However, the mobile sources altogether generate 29.6% of the total PAHs emitted from identified sources as demonstrated in , thus complicating any prediction regarding contribution of different sources for each PAH at the receptor residential areas of the Palm Beach County. For instance, a source apportionment study by Harrison et al. (Citation1996) on 18 PAHs in an urban area in Birmingham, in the United Kingdom, revealed that measured PAHs were predominantly associated with the road traffic compared to coal combustion, incineration, and fuel oil. In particular, emissions from vehicular sources accounted for 88% of ambient benzo[a]pyrene, known as one of the most toxic PAHs. Similarly, Mishra et al. (Citation2015) identified the most PAH-emitting source deteriorating air quality of the metropolitan area of Brisbane, Australia, to be mobile vehicles, with 56% contribution. These observation are in disagreement with the results of another study by Larsen and Baker (Citation2003) using three source apportionment methods on PAH levels in Baltimore, MD, which concluded average contributions of 16–26% for vehicular sources, 28–36% for coal combustion, 25–23% for fuel oil, and 23–35% for other sources.
Therefore, this study aims to evaluate contributions of biomass burning and mobile vehicular sources to ground-level concentrations of PAHs at a receptor in a residential area in Palm Beach County, Florida. A sampling campaign for a selected list of PAHs was conducted for a full year (from March 2013 to March 2014), and a source apportionment model was implemented to determine the contributions at two case scenarios of sugarcane burning season and non-sugarcane burning season.
Methodology
Sampling PAHs from ambient air
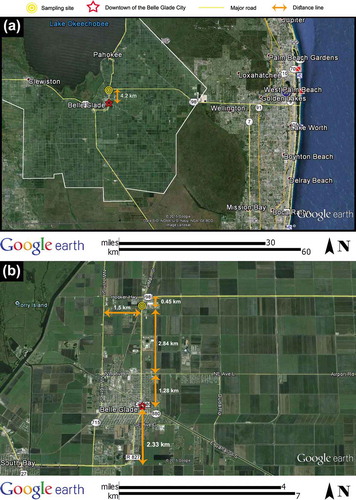
The Florida Department of Health in Palm Beach County conducted the sampling campaign in the city of Belle Glade from March 11, 2013, through March 30, 2014, for 22 PAH compounds. In total, 30 ambient air samples were collected from one receptor site located ~4.2 km north of the city on top of the Department of Health building (see ). Distances between the sampling site and major roads around Belle Galde City are shown in . The entire city is surrounded by sugarcane fields as seen in .
Figure 1. Study area in southwest Florida: (a) positioning of the sampling site and agricultural fields of Palm Beach County (sugarcane and agricultural fields are confined with white lines) and (b) major roads surrounding Belle Glade City and the sampling site.
The PAH sampling procedure followed the EPA TO-13A method (EPA, Citation1999) and ASTM D6209. Ambient air was drawn through a micro-quartz fiber filter and a polyurethane foam (PUF) adsorbent cartridge by means of a high-volume sampler (General Metals Works, model GPS-1, Thermo Fisher Scientific, Inc., Franklin, MA) for a continuous 24 hr. The field surrogates of fluoranthene-d10 and benzo[a]pyrene-d12 were spiked onto the PUF media prior to shipment to the field. After sampling, laboratory surrogates of fluorene-d10 and pyrene-d10 were spiked into the PUF immediately before extraction. The filter and PUF cartridge (known as ZAD-2) were extracted by 10% diethyl ether. The extract was concentrated according to the Kuderna–Danish technique (as implemented by Roussel et al. [Citation1992]), then diluted and analyzed using a DB-5 fused silica capillary column chromatography. Finally, the cleaned extract was analyzed by gas chromatography/mass spectrometry (GC/MS) possessing nominal electron energy of 70 eV and capable of monitoring up to 16 ions per 0.1 s.
Source apportionment model
Initially proposed by Winchester and Nifong (Citation1971) and Miller et al. (Citation1972) for aerosol source apportionment, chemical mass balance (CMB) is a model preferred by the U.S. Environmental Protection Agency (EPA), routinely used to estimate quantitative source apportionment of PAHs when prior knowledge regarding the emission rates of pollutants of interest is available (Simcik et al., Citation1999; Mackay and Hickie, Citation2000; Larsen and Baker, Citation2003; Li et al., Citation2003; Kim et al., Citation2013; Aydin et al., Citation2014; Li et al., Citation2014; Engling et al., Citation2014; Manoli et al., Citation2015). In this method, the amount of an air pollutant measured at a specific receptor site is defined to be equal to the sum of the pollutants contributed from a finite number of sources in the modeled area. More details on application of CMB modeling for apportioning air quality data and its error variances have been discussed in an enormous number of studies (e.g., Christensen and Gunst, Citation2004).
According to the inventory of air pollution sources provided by Florida Department of Environmental Protection for Palm Beach County and Florida Department of Agriculture and Consumer Services, the major sources contributing to PAH concentrations of the receptor area included preharvest sugarcane burning, wildland fires, and mobile vehicles. Significant abundance of PAH emissions from the mentioned sources (total of ~98.5%) compared to other PAH emitting sources for Palm Beach County (see ) implies unimportance of other PAHs emitting sources for being included in the source apportionment model. This observation is in line with what was reported by Baek et al. (Citation1991), indicating that the total emission of the PAHs from power generation, incinerations, industrial processes, and residential heating without coal burning contribute for 1%, 1%, 6%, and 1%, respectively, for the entire United States.
In the current study, CMB8.2 developed by EPA was implemented for two scenarios. The first scenario included ambient sampling data from the sugarcane burning season (March 11 to April 28, 2013, and October 1 to March 30, 2014). The second scenario included ambient sampling data from the non-sugarcane burning season, consisting of dates with no occurrence of sugarcane burning (April 28 to October 1, 2013). Therefore, wildland fires and mobile vehicles were the only sources for the second scenario.
Multiple operations were conducted for proper source apportionment analysis. In each operation, multiple ambient sampling dates were selected (all sugarcane burning days or all non-sugarcane burning days). Inclusion of inappropriate fitting species with similar source profiles is a common mistake in CMB modeling and often leads to collinearity of the converging solutions, yielding several inestimable results (Lee and Russell, Citation2007). One way to avoid a linear dependency issue in CMB models is to use a single broadly defined source type including a group of similar sources (Henry, Citation1992; Li and Kamens, Citation1993; Chow et al., Citation1996). This selected combination (rather than inclusion of all fitting species) was crucially important for studying the effects of varying species. Thus, sensitivity analysis was conducted and fitting species were selected rigorously to include appropriate combination of PAH compounds in the CMB model (Watson et la., Citation1990).
Source profiles
Source profiles as the fractional components of each PAH species for a source were considered. Wildland fire and mobile vehicles source profiles were obtained from the National Emission Inventory (NEI) for Palm Beach County in 2013. The sugarcane burning source profile was extracted from the study by Hall et al. (Citation2012) where the mean values of PAH concentrations from three replicates of whole stalk sugarcane burning were opted for the CMB model.
Source profiles of three polluting sources used in the CMB model are displayed in . Generally, photolysis rates of different PAH species are not exactly the same. However, the effect of such differences within source profiles were neglected due to the closeness (<5 km) of polluting sources from the receptor point. Sugarcane burning and total mobile vehicles strongly dominated the lower weighted PAHs of acenaphthylene (AcPy), acenaphthene (Acp), fluorene (Flu), and phenanthrene (PA), as presented at the left end of the graph. For anthracene (Ant), pyrene (Pyr), and fluoranthene (FL), fractions are relatively equal for all sources. For chrysene (CHR), benzo[a]anthracene (BaA), benzo[k]fluoranthene (BkF), benzo[g,h,i]perylene (BghiP), and indeno[1,2,3,c-d]pyrene (IND), wildland fires had higher fractions. However, for benzo[b]fluoranthene (BbF) and benzo[a]pyrene (BaP), all source fractions are so low that making any comparison is challenging.
Figure 2. Source profiles of PAH species: acenaphthylene (AcPy), acenaphthene (Acp), fluorene (Flu), phenanthrene (PA), anthracene (Ant), pyrene (Pyr), fluoranthene (FL), chrysene (CHR), benz[a]anthracene (BaA), benzo[b]fluoranthene (BbF), benzo[a]pyrene (BaP), benzo[k]fluoranthene (BkF), benzo[g,h,i]perylene (BghiP), and indeno[1,2,3,c-d]pyrene (IND) for sugarcane burning, total wildland fires, and total mobile vehicles (error bars indicate standard error).
![Figure 2. Source profiles of PAH species: acenaphthylene (AcPy), acenaphthene (Acp), fluorene (Flu), phenanthrene (PA), anthracene (Ant), pyrene (Pyr), fluoranthene (FL), chrysene (CHR), benz[a]anthracene (BaA), benzo[b]fluoranthene (BbF), benzo[a]pyrene (BaP), benzo[k]fluoranthene (BkF), benzo[g,h,i]perylene (BghiP), and indeno[1,2,3,c-d]pyrene (IND) for sugarcane burning, total wildland fires, and total mobile vehicles (error bars indicate standard error).](/cms/asset/bacf6c03-5819-4753-b555-bc7fd969987a/uawm_a_1138902_f0002_b.gif)
Quality control
The PUF samplers were calibrated upon installation, after each service, and after every 360 sampling hours. The nominal detection limit of the samplers was 1 pg/m3. A leak check and airflow adjustment were performed before each sampling effort. Both measurement errors of sampled ambient data and variations in the source profiles are responsible for uncertainties in CMB modeling results. According to Monte Carlo simulations performed by Javitz et al. (Citation1988), the CMB model obtains acceptable accuracy even when coefficients of variation of temporal source profiles and measurement errors of ambient data are less than 25% and 10%, respectively. On the other hand, results of Monte Carlo analysis on estimating uncertainties of the CMB model for PM2.5 under various measurement errors by Lee and Russell (Citation2007) demonstrated that the uncertainties in source profile data have a larger impact on total uncertainties of source contributions than measurement errors of ambient data. In this study, there was no explicitly reported error range either for non-sugarcane source profile data provided by NEI or for sugarcane source profile data provided by Hall et al. (Citation2012). Thus, we followed recommendations by Pace and Watson (Citation1987) by considering a constant coefficient of variation of 10% for all species in the CMB model. Exceptionally, for those concentrations that were below the detection limit and were recorded as zero, the error range was assigned to be equal to the PUF detection limit. The minimum number of iterations to observe convergence in the fitting algorithm of the CMB model was considered to be 20, which is a value recommended by the CMB8.2 user’s manual (Watson et al., Citation1990). The minimum acceptable coefficient of determination (R2 value) for statistical inference was considered to be 0.8.
Results and discussion
Ambient concentration of PAHs
The total concentrations of the PAHs sampled in this study on 30 sampling dates are displayed in . To better understand the intensity of the displayed concentrations, one should notice that even the smallest measured value in Belle Glade City was considerably greater than those measured in urban metropolitan area of Brisbane, Australia, by Mishra et al. (Citation2015). Thirteen sampling dates from April 28 to September 19, 2013, fell in the sugarcane non-burning period as recognized according to burn authorization data of the Florida Forest Service Reporting Systems. As displayed in , some days had exceptionally high PAH concentrations. On June 15, 2013, the total ambient concentration of PAH was 396 ng/m3, and there was an authorized 8.1 ha of pasture burning. Similarly, on August 2, 2013, the ambient concentration was 185 ng/m3, and there were 39 authorized pile burns on that day and a total of 128 pile burns within 4 days prior. October 25, 2013, had the highest ambient concentration at 513 ng/m3, where there was a large amount of burned area (1,692 ha) from sugarcane burning and wildland fires combined. This sampling date had the highest number of open burning authorizations: 68 in total. It is intuitive to predict that on sugarcane burning days, there would be higher concentrations of PAHs simply because significant burning is occurring, before analyzing CMB model results. may directly benefit the Florida Forest Service and other responsible organizations in better management of burnings authorization. For instance, the corresponding total concentrations of the PAHs in the receptor area in the beginning and at the end of the sugarcane burning season were relatively high (~520 and 150 ng/m3); hence, fewer authorized burnings for this period warrant consideration.
Figure 3. Total atmospheric PAH concentrations at sampling site in Belle Glade, FL.
The total and mean concentrations of each PAH compound are shown in . In general, PAHs with a lower molecular weight exhibited higher concentrations, and naphthalene dominated other compounds. This is likely due to the relatively higher susceptibility of PAH compounds of higher molecular weight to photodegradation (Pitts et al., Citation1986; Tsapakis and Stephanou, Citation2003). As designated in , although 22 PAH species were measured at the receptor site, only 14 were chosen for the CMB analysis. Dibenz[a,h]anthracene and perylene were excluded, as their measured ambient concentrations were consistently below the detection limits. Naphthalene was removed as its ambient concentration was on average 10-fold greater than other PAHs, which would result in a significant numerical error (Christensen and Gunst, Citation2004). Furthermore, its source profile was not included in the NEI report. The remaining excluded pollutants (9-fluorenone, retene, benzo[e]pyrene, and coronone) were removed because their source profile data were not available for all polluting sources.
Figure 4. Total and mean concentrations of each PAH species of the 24-hr samples from March 2013 to March 2014 (n = 30). The asterisk indicates exclusion from the CMB model.
In comparison to the atmospheric PAH concentrations measured in a medium-sized city and one of the major sugarcane producers in the world, Araraquara City, São Paulo, Brazil (de Assuncao et al., Citation2014), the mean concentrations of all PAH compounds were significantly higher (1 to 10 times) at Belle Glade City. This may be due to the relatively high precipitation rate for Araraquara, as well as the relatively larger area coverage of the sugarcane fields in the neighborhood of the sampling site of the present study.
Interpretation of the CMB model results
Selected PAH species for each CMB model operation and resultant source contribution values for the sugarcane burning period and the non-sugarcane period are summarized in and , respectively. These tables include those runs that passed the previously mentioned screening requirements of solution convergence after 20 iterations and an average R2 value (coefficient of determination) ≥0.8. In each operation, the reported percentage values are the relative fractions of each source after adding the results of all runs for each contributing sources. For instance, for all 15 runs in Operation 3, the summed source contributions for sugarcane burning, wildland fires, and total mobile vehicles were 12.36, 0.41, and 117.16 ng/m3, respectively. These values corresponded to respective fractional contributions of 9.5%, 0.3%, and 90.2%.
Table 3. CMB model configurations and results for sugarcane burning season (corresponding to ambient sampling days from March 11 to April 28, 2013, and October 1, 2013 to March 30, 2014 of this study).
Table 4. CMB model configurations and results for non-sugarcane burning season (corresponding to ambient sampling days from May 5 to September 19, 2013, of this study).
In and , the PAH fitting species are listed in the order of increasing molecular weight. Several operations were chosen to reflect the influence of grouping similar-weight PAH fitting species to overall source contributions. The results of these operations are summarized in . In general, preharvest sugarcane burning was the primary contributing source when PAHs with higher molecular weights were chosen as fitting weights. Although this trend was not explicitly valid for all operations, generally preharvest burning became more prominent when molecular weight groups of the comparing operations were increasing. Therefore, Operations 4 through 9 show a clear decrease in mobile vehicle contribution and an increase in sugarcane burning contribution. Interestingly, wildland fire contributions were relatively scattered in all operations. This may be due to absence of a few compounds (i.e., AcPy, Acp, Flu, and BbF) in the reported source profile of the wildland fires.
Figure 5. Fractional source contribution mean values.
Including all numbers of benzene rings of the PAHs, Operations 10, 11, and 12 attributed more than 50% of the contribution to sugarcane burning in all three operations. For sugarcane burning season, concludes that total mobile vehicles contribute to the majority of the PAHs. Averaging the results over the operations in this period indicates contributions by total mobile vehicles at 58%, followed by sugarcane burning at 32%, then wildland fires at 10%. For non-burning season, mobile vehicles dominate at 73% while wildland fires contribute 27%, on average. This obtains insight into seasonal contribution of the most PAH polluting source and establishes a rough measure to know which polluting source is limiting. Except in an investigation on PAH source apportionment modeling in the coastal atmosphere of Chicago, IL, by Simick et al. (Citation1999), high contribution from total mobile vehicles in urban areas is seen almost in all previous PAH source apportionment studies (Kavouras et al., Citation1999; Larsen and Baker, Citation2003; Li et al., Citation2003; Yang and Chen, Citation2004; de Assuncao et al., Citation2014).
The EPA considers benzo[a]pyrene (BaP), benz[a]anthracene (BaA), chrysene (CHR), and benzo[b]fluoranthene (BbF) to be the most toxic PAHs (Pope, Citation1998). To assess the source apportionment of these toxic PAHs, Operations 7 and 17 (including BaP, BaA, CHR, and Bbf as the fitting species) should be considered. In Operation 7, mobile vehicles are dominant during sugarcane burning season. However, in Operation 17, corresponding to the non-sugarcane burning season, wildland fires are dominant with a percentage of 63.8%.
Significance of both mobile vehicles and sugarcane burning in atmospheric PAH pollution was also concluded in the study by de Assuncao et al. (Citation2014) for Araraquara City in Brazil. However, in contrast to Araraquara City wherein sugarcane burning facilities are phasing out and only the number of mobile vehicles is increasing due to proximity to the São Paulo metropolitan area, both mobile vehicles and biomass burning in South Florida may remain a major health concern.
One should notice that naphthalene, possessing the highest ground-level concentration, was not included in the CMB model of this study as its source profile was not reported by NEI. Since naphthalene consists of only two benzene rings, it has a longer lifetime than the other PAH compounds. If it were included, it might result in a different source contribution results. According to the observed trend in the current study, inclusion of naphthalene in the CMB runs likely would increase the contribution of the total vehicle sources. More accurate estimation on the significance of the contributing sources for different scenarios requires detailed profiles for each of PAH emission sources for the region of the study. In real conditions, source profiles are temporally variable due to changes in polluting sources and changes in transformations and deposition rates of the species. An accurate source apportionment model requires application of variable source profiles, which also influences the coefficients of variation. If categorized source profiles are available, split of the total vehicular sources into different categories (e.g., diesel vs. gasoline or passenger cars vs. trucks) will result in a more precise plan for a transportation agency to better regulate the traffic flow in the area. Health risk analysis of the PAH compounds was beyond the scope of the current study. However, risk assessment for cancer risk in different age groups, similar to incremental lifetime cancer risk (ILCR) applied by de Assuncao et al. (Citation2014) or risk apportionment pioneered by Wu et al. (Citation2009), warrants consideration.
Conclusions
Source apportionment modeling of 14 atmospheric PAHs in Belle Glade, FL, revealed that both sugarcane burning and mobile vehicular sources are major contributors for measured ground-level concentrations at the site station. For the first time, source apportionment modeling results of PAHs were directly related to the benzene rings of the species as molecular weight (presented by the number of benzene rings) was found to be the key parameter in determining the source with the prevailing contribution. Generally, mobile vehicle sources showed a higher contribution for species with relatively lower molecular weights (four or fewer benzene rings) whereas sugarcane burning contributed more for species with relatively larger molecular weights (five or more benzene rings). Wildland fires showed a variable contribution, and their highest contributions were related to the medium-molecular-weight PAH species during the non-sugarcane burning period. Dominant contribution of the studied sources for the most toxic PAHs was attributed to the total mobile vehicles during sugarcane burning season and wildland fires during the non-sugarcane burning season.
This study suggests a more refined biomass burning authorization plan to reduce the impact of PAH emissions on the residential areas of West Palm Beach County. Restrictive transportation plans for mobile vehicles to minimize PAH emissions during the sugarcane burning will be beneficial. Development of a risk assessment model to translate PAH concentrations into health risk is also recommended.
Funding
The authors acknowledge Winston Davis from the Division of Environmental Public Health, Florida Health, Palm Beach County, for help in sampling the PAH air pollutants. All comments and insights from Dr. Barron Henderson from the Department of Environmental Engineering Sciences at the University of Florida and Dr. David Cooper from the Department of Civil, Environmental and Construction Engineering at the University of Central Florida are gratefully appreciated. Christina Wilson is thankful to the Dale Lundgren Air Resources Scholarship.
Additional information
Notes on contributors
Nima Afshar-Mohajer
Nima Afshar-Mohajer was a postdoctoral research associate in the Department of Environmental Engineering Sciences at the University of Florida. He is currently a postdoctoral research associate in the Department of Environmental Health Sciences at the Johns Hopkins Bloomberg School of Public Health.
Christina Wilson
Christina Wilson was a senior undergraduate student in the Department of Environmental Engineering Sciences at the University of Florida.
Chang-Yu Wu
Chang-Yu Wu is Professor and Head of the Department of Environmental Engineering Sciences at the University of Florida.
James E. Stormer
James E. Stormer was an Environmental Administer in the Division of Environmental Public Health at the Palm Beach County.
References
- Aydin, Y.M., M. Kara, Y. Dumanoglu, M. Odabasi, and T. Elbir. 2014. Source apportionment of polycyclic armoatic hydrocarbons (PAHs) and polychlorinated (PCBs) in ambient air of an industrial region in Turkey. Atmos. Environ. 97:271–85. doi:10.1016/j.atmosenv.2014.08.032
- Baek, S.O., R.A. Field, M.E. Goldstone, P.W. Kirk, J.N. Lester, and R. Pery. 1991. A review of atmospheric polycyclic aromatic hydrocarbons: sources, fate and behavior. Water Air Soil Pollut. 60:279–300. doi:10.1007/BF00282628
- Chow, J.C., J.G. Watson, and D.H. Lowenthal. 1996. Sources and chemistry of PM10 aerosol in Santa Barbara County, CA. Atmos. Environ. 30:1489–99. doi:10.1016/1352-2310(95)00363-0
- Christensen, W.F., and R.F. Gunst. 2004. Measurement error models in chemical mass balance analysis of air quality data. Atmos. Environ. 38:733–44. doi:10.1016/j.atmosenv.2003.10.018
- de Andrade, S.J., J. Cristale, F.S. Silva, G.J. Zocolo, and M.R. Marchi. 2010. Contribution of sugarcane harvesting season to atmospheric contamination by polycyclic aromatic hydrocarbons (PAHs) in Araraquara city, Southeast Brazil. Atmos. Environ. 44:2913–19. doi:10.1016/j.atmosenv.2010.04.026
- de Assuncao, J.V., C.R. Pesquero, A.C. Nardocci, A.P. Francisco, N.S. Soares, and H. Ribeiro. 2014. Airborne polycyclic aromatic hyrocarbons in a medium-sized city affected by preharvest sugarcane burning and inhalation risk for human health. J. Air Waste Manage. 64:1130–39. doi:10.1080/10962247.2014.928242
- Engling, G., J. He, R. Betha, and R. Balasubramanian. 2014. Assessing the regional impact of indonesian biomass burning emisions based on organic molecualr tracers and chemical mass balance modeling. Atmos. Chem. Phys. 14:8043–54. doi:10.5194/acp-14-8043-2014
- Gullette, B. K., A. Touati, J. Huwe, and H. Hakk. 2006. PCDD and PCDF emissions from simulated sugarcane field burning. Environ. Sci. Technol. 40:6228–34. doi:10.1021/es060806k
- Hall, D., C.-Y. Wu, Y.M. Hsu, J. Stormer, G. Engling, K. Capeto, J. Wang, S. Brown, H.-W. Li, and K.-M. Yu. 2012. PAHs, carbonyls, VOCs and PM2.5 emission factors for pre-harvest burning of Florida sugarcane. Atmos. Environ. 55:164–72. doi:10.1016/j.atmosenv.2012.03.034
- Harrison, R.M., D.J.T. Smith, and L. Luhana. 1996. Source apportionment of atmospheric polycyclic aromatic hydrocarbons collected from an urban location in Birmingham, UK. Environ. Sci. Technol. 30:825–32. doi:10.1021/es950252d
- Henry, R.C. 1992. Dealing with near collinearity in chemical mass balance receptor models. Atmos. Environ. 26A:933-938. doi:10.1016/0960-1686(92)90251-F
- Javitz, H.S., J.G. Watson, and N. Robinson. 1988. Performance of chemical mass balance model with simulated local-scale aerosols. Atmos. Environ. 22:2309–22. doi:10.1016/0004-6981(88)90142-4
- Jenkins, B.M., A.D. Jones, S.Q. Turn, and R.B. Williams. 1996. Emission factors for polycyclic aromatic hydrocarbons from biomass burning. Environ. Sci. Technol. 30:2462–69. doi:10.1021/es950699m
- Kavouras, I.G., P. Koutrakis, M. Tsapakis, et al. 1999. Source apportionment of urban particulate aliphatic and polynuclear aromatic hyrocarbons (PAHs) using multivariate methods. Environ. Sci. Technol. 35:2288–94. doi:10.1021/es001540z
- Kim, I.S., J.Y. Lee, and Y.P. Kim. 2013. Impact of polycyclic aromatic hydrocarbon (PAH) emissions from North Korea to the air quality in the Seoul Metropolitan Area, South Korea. Atmos. Environ. 70:159–65. doi:10.1016/j.atmosenv.2012.12.040
- Kim, K.-H., S.A. Jahan, E. Kabir, and R.J.-C. Brown. 2013. A review of airborne polycyclic aromatic hydrocarbons (PAHs) and their human health effects. Environ. Int. 60:71–80. doi:10.1016/j.envint.2013.07.019
- Larsen, R.K., and J.E. Baker. 2003. Source apportionment of polycyclic aromatic hydrocarbons in the urban atmosphere: a comparison of three methods. Environ. Sci. Technol. 37:1873–81. doi:10.1021/es0206184
- Lee, S., and A.G. Russell. 2007. Estimating uncertainties and uncertainty contributors of CMB PM2.5 source apportionment results. Atmos. Environ. 41:9616–24. doi:10.1016/j.atmosenv.2007.08.022
- Li, A., J.-K. Jang, and P.A. Scheff. 2003. Application of EPA CMB8.2 Model for source apportionment of sediment PAHs in Lake Calumet, Chicago. Environ. Sci. Technol. 37:2958–65. doi:10.1021/es026309v
- Li, C.K., and R.M. Kamens. 1993. The use of polycyclic aromatic hydrocarbons as source signature in receptor modeling. Atmos. Environ. 27A:523–32. doi:10.1016/0960-1686(93)90209-H
- Li, H.-W., N. Afshar-Mohajer, C.-Y. Wu, J.-C.J. Bonzongo, V.A. Ilacqua, Y. Choi, and B. Birky. 2014. Impacts of hazardous air pollutants emitted from phosphate fertilizer production plants on their ambient concentration levels in the Tampa Bay area. Air Qual. Atmos. Health 8:453–67. doi:10.1007/s11869-014-0294-3
- Mackay, D., and B. Hickie. 2000. Mass balance model of source apportionment, transport and fate of PAHs in Lac Saint Louis, Quebec. Chemosphere 41:681–92. doi:10.1016/S0045-6535(99)00486-5
- Manoli, E., A. Kouras, O. Karagkiozidou, G. Argyropoulos, D. Vousta, and C. Samara. 2015. Polycyclic aromatic hydrocarbons (PAHs) at traffic and urban background sites of northern Greece: Source apportionment of ambient PAH levels and PAH-induced lung cancer risk. Environ. Sci. Pollut. Res. doi:10.1007/s11356-015-5573-5
- Miller, M.S., S.K. Friedlander, and G.M. Hidy. 1972. A chemical element balance for the Pasadena aerosol. J. Colloid Interface Sci. 39:65–176. doi:10.1016/0021-9797(72)90152-X
- Mishra, N., G.A. Ayoko, and L. Morawska. 2015. Atmospheric polycyclic aromatic hydrocarbons in the urban environment: occurrence, toxicity and source apportionment. Environ. Pollut. 208:110–17. doi:10.1016/j.envpol.2015.08.015
- Pace, T.G., and J.G. Watson. 1987. Protocol for applying and validating the CMB model. EPA 450/4-87-010. Research Triangle Park, NC: U.S. Environmental Protection Agency.
- Pitts, J.N., H.-R. Paur, B. Zielinska, J. Arey, A.M. Winer, T. Ramdahl, and V. Meijia. 1986. Factors influencing the reactivity of polycyclic armoatic hydrocarbons adsorbed on filters and ambient POM with ozone. Chemosphere 15:675–85. doi:10.1016/0045-6535(86)90033-0
- Pope, A.A. 1998. Locating and estimating air emissions from sources of polycyclic organic matter. Research Triangle, NC: Office of Air Quality and Planning and Standards, EPA.
- Rajput, P., M.M. Sarin, R. Rengarajan, and D. Singh. 2011. Atmospheric polycyclic hydrocarbons (PAHs) from post-harvest biomass burning emissions in the Indo-Gangetic plain: Isomer ratios and temporal trends. Atmos. Environ. 45:6732–40. doi:10.1016/j.atmosenv.2011.08.018
- Ravindra, K., R. Sokhi, and R. Van Grienken. 2008. Atmospheric polycyclic aromatic hydrocarbons: source attribution, emission factors and regulation. Atmos. Environ. 42:2895–921. doi:10.1016/j.atmosenv.2007.12.010
- Roussel, R., M. Allaire, and R.S. Friar. 1992. Atmospheric polycyclic aromatic hydrocarbons at a point source of emissions. Part A: Identification and determination of polycyclic aromatic compounds in airborne particulate matter near a horizontal stud Soderberg plant. J. Air Waste Manage. Assoc. 42:1609–13. doi:10.1080/10473289.1992.10467105
- Simcik, M.F., S.J. Eisenreich, and P.J. Lioy. 1999. Source apportionment and source/sink relationships of PAHs in the coastal atmosphere of Chicago and Lake Michigan. Atmos. Environ. 33:5071–79. doi:10.1016/S1352-2310(99)00233-2
- Singh, D.P., R. Gadi, T.K. Mandal, T. Saud, M. Saxena, and S.K. Sharma. 2013. Emissions estimates of PAH from biomass fuels used in rural sector of Indo-Gangetic plains of India. Atmos. Environ. 68:120–26. doi:10.1016/j.atmosenv.2012.11.042
- Tsapakis, M., and E.G. Stephanou. 2003. Collection of gas and particle semi-volatile oraganic compounds: Use of an oxidant denuder to minimize polycyclic armoatic hydrocarbons degradation during high-volume air sampling. Atmos. Environ. 37:4935–44. doi:10.1016/j.atmosenv.2003.08.026
- U.S. Environmental Protection Agency). 1999. Compendium method TO-13A-determination of polycyclic aromatic hydrocarbons (PAHs) in ambient air using gas chromatography. Cincinnati, OH: U.S. Environmental Protection Agency.
- Watson, J.G., N.F. Robinson, J.C. Chow, R.C. Henry, et al. 1990. The EPA/DRI chemical mass balance receptor model, CMB 7.0. Environ. Software 5:38–49. doi:10.1016/0266-9838(90)90015-X
- Winchester, J.W., and G.D. Nifong. 1971. Water pollution in Lake Michigan by trace elements from pollution aerosol fallout. Water Air Soil Pollut. 1:50–64. doi:10.1007/BF00280779
- Wu, C.-F., S.-Y. Wu, Y.-H. Wu, A.C. Cullen, T.V. Larson, J. Williamson, and L.-J.S. Liu. 2009. Cancer risk assessment of selected hazardous air pollutants in Seattle. Environ. Int. 35:516–22. doi:10.1016/j.envint.2008.09.009
- Yang, H.-H., W.-J. Lee, S.J. Chen, and S.-O. Lai. 1998. PAH emission from various industrial stacks. J. Hazard. Mater. 60:159–74. doi:10.1016/S0304-3894(98)00089-2
- Yang, H.-H., and C.-M. Chen. 2004. Emission inventory and sources of polycyclic aromatic hydrocarbons in the atmosphere at a suburban area in Taiwan. Chemosphere 56:879–87. doi:10.1016/j.chemosphere.2004.05.031