
ABSTRACT
A pilot study was conducted in application of the U.S. Environmental Protection Agency (EPA) Methods 325A/B variant for monitoring volatile organic compounds (VOCs) near two oil and natural gas (ONG) production well pads in the Texas Barnett Shale formation and Colorado Denver–Julesburg Basin (DJB), along with a traffic-dominated site in downtown Denver, CO. As indicated in the EPA method, VOC concentrations were measured for 14-day sampling periods using passive-diffusive tube samplers with Carbopack X sorbent at fenceline perimeter and other locations. VOCs were significantly higher at the DJB well pad versus the Barnett well pad and were likely due to higher production levels at the DJB well pad during the study. Benzene and toluene were significantly higher at the DJB well pad versus downtown Denver. Except for perchloroethylene, VOCs measured at passive sampler locations (PSs) along the perimeter of the Barnett well pad were significantly higher than PSs farther away. At the DJB well pad, most VOC concentrations, except perchloroethylene, were significantly higher prior to operational changes than after these changes were made. Though limited, the results suggest passive samplers are precise (duplicate precision usually ≤10%) and that they can be useful to assess spatial gradients and operational conditions at well pad locations over time-integrated periods.
Implications: Recently enacted EPA Methods 325A/B use passive-diffusive tube samplers to measure benzene at multiple fenceline locations at petrochemical refineries. This pilot study presents initial data demonstrating the utility of Methods 325A/B for monitoring at ONG facilities. Measurements revealed elevated concentrations reflective of production levels and spatial gradients of VOCs relative to source proximity at the Barnett well pad, as well as operational changes at the DJB well pad. Though limited, these findings indicate that Methods 325A/B can be useful in application to characterize VOCs at well pad boundaries.
Introduction
Oil and natural gas (ONG) production in the United States is expected to increase for the next 10 to 15 years and spur industrial production (U.S. Energy Information Administration, Citation2014). ONG production, including shale gas development, produces emissions of volatile organic compounds (VOCs), hazardous air pollutants (HAPs) including benzene, and related greenhouse gases such as methane (Allen et al., Citation2013; Moore et al., Citation2014; Pétron et al., Citation2014; Rich et al., Citation2014). It has been suggested that ONG emissions can result in health impacts for nearby communities (McKenzie et al., Citation2012; Colburn et al., Citation2014; Thompson et al., Citation2014; Bolden et al., Citation2015). Improved understanding of near-source concentrations of these air pollutants around ONG well pads is important for several reasons. Well pads serve as an initial collection and storage location of product extraction, where producing wells may deliver natural gas, condensate, oil, and water to the surface. Extracted products from shale gas regions consist of VOCs and other HAPs, which have potential air quality impact at local and regional scales (Allen et al., Citation2013; Brantley et al., Citation2014; Field et al., Citation2014, Citation2015). With the continued need to refine regional emission inventories and new emission control requirements being established in the U.S. Environmental Protection Agency (EPA) New Source Performance Standards for the sector (Federal Register 78:58416, September 23, 2013), it is prudent to have methods for assessing the effectiveness of these standards. Methane and benzene emissions from ONG operations in the Colorado Denver–Julesburg Basin (DJB) have been found to be underestimated (Pétron et al., Citation2014), emphasizing the need for air monitoring at and near such facilities to better characterize ONG source contribution.
EPA Methods 325A and 325B use low-cost measurement and analysis of time-averaged fenceline concentrations of benzene near petrochemical refineries using passive-diffusive tube samplers with Carbopack X or other sorbents (U.S. Environmental Protection Agency, Citation2015a, Citation2015b). Recently, the EPA conducted a passive sampler pilot study using a variation of Methods 325A/B for select VOCs near ONG well pad operations and refineries to further inform methods and explore additional applications of passive samplers (Thoma et al., Citation2015; Mukerjee et al., Citation2016). The study reported here sought to establish the utility of Methods 325A/B for monitoring at ONG facilities.
From fall 2013 through summer 2014, passive sampler tubes with Carbopack X sorbent were deployed around two active ONG well pads, one in the Texas Barnett Shale formation and the other in the Colorado DJB. These well pads are located in current nonattainment airsheds for the 2008 8-hr ozone National Ambient Air Quality Standards (U.S. Environmental Protection Agency, Citation2015c), and the Barnett and DJB Basins have extensive ONG production activities. Samplers were deployed for 14-day sampling periods (as specified by Methods 325A/B) over several months at multiple locations around each well pad, measuring benzene and other select VOC concentrations. The study also compared DJB well pad concentrations to measurements at a high-volume traffic site in downtown Denver using the same methods. The deployments at all sites were done with the permission of the site operators.
Methods
Sampling and lab analytical components are detailed in the following and elsewhere (Thoma et al., Citation2011; Thoma et al., Citation2015) and are similar to Methods 325A/B (U.S. Environmental Protection Agency, Citation2015a, Citation2015b). Passive samplers were reuseable PerkinElmer style tubes containing Carbopack X sorbent (Supelco FLM Carbopack X Deactivated Stainless Steel TD Tubes, 89 mm, part number 28686-U, Sigma-Aldrich Co. LLC, St. Louis, MO) deployed for 14-day sampling periods. The passive sampler has been evaluated in lab and field studies and is comparable to standard methods for VOCs (McClenny et al., Citation2005; Citation2006; Mukerjee et al., Citation2009; Smith et al., Citation2011; Thoma et al., Citation2011, Citation2015). Duplicate sampling was conducted for all sampling periods to evaluate precision, and quality control (QC) samples consisting of field blanks and field spikes were also prepared for all sampling periods to allow evaluation of tube background contributions and recoveries of target compounds from the Carbopack X sorbent tubes. Field blanks consisted of tubes randomly selected at the field site from the stock of tubes prepared for sample collection. Field spikes were diffusively loaded with nominal 2 ppbv concentrations at the laboratory by exposing tubes in a chamber maintained at a constant concentration of the target analytes. Field blanks and field spikes were deployed capped at the sampling site during the 2-week sampling period and returned to the laboratory with the samples for analysis. A protective shelter hood housed each sampler, its duplicate, and any scheduled field blank or field control; shelters were positioned at a height of approximately 2 m above ground. Samples were analyzed with a PE Turbo Matrix ATD thermal desorption system (PerkinElmer Life and Analytical Sciences, Shelton, CT) followed by gas chromatography/mass spectrometry detection using an Agilent 6890N/5975 inert gas chromatography/mass spectrometry system (Agilent Technologies, Santa Clara, CA). Collection and analysis followed a modified version of Method 325B. Concentrations of VOCs were reported in parts per billion by volume (ppbv) for benzene, toluene, ethylbenzene, and xylene isomers (collectively known as BTEX), perchloroethylene and styrene, carbon tetrachloride, and 1,3-butadiene. (Because carbon tetrachloride and 1,3-butadiene were almost always below detection limit, these two VOCs were not part of this analysis.) After analysis, the tubes were conditioned for field redeployment by heating to 350ºC for 1 hr under helium purge in a Markes T-20 tube conditioner (Markes International Ltd., Cincinnati, OH).
Statistical analyses were performed in SAS Version 9.3. The SAS NPAR1WAY procedure was employed for Wilcoxon testing and associated Hodges–Lehmann estimation (SAS, 2004). These nonparametric techniques were employed to allow for nonnormality of the observed data. Prior to any summarization or statistical testing, any concentrations reported as below the detection limit were set to half the detection limit.
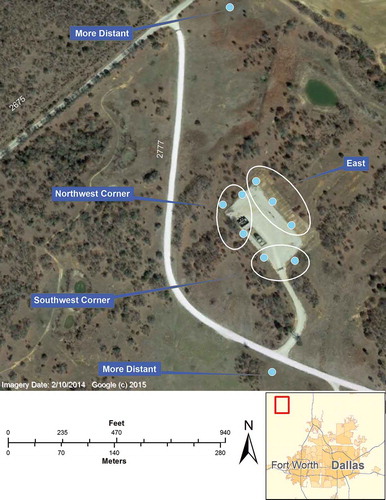
Passive samplers were deployed at a Barnett Shale well pad located at the Lyndon B. Johnson National Grasslands in Wise County, Texas (). The Barnett well pad consisted of one well, one separator, three product storage tanks, and one lift compressor. Annual production of the Barnett well pad in 2014 was 425 barrels per year (bbl/yr) of oil and 132,033 million cubic feet per year (MCF/yr) of natural gas (U.S. Environmental Protection Agency, Citation2015d). A total of 19 sampling periods were collected at this location, between September 25, 2013, and September 10, 2014. Eight passive sampler locations (PSs) were in close proximity to each other and on the Barnett well pad’s fenceline perimeter, within 60 m from the center of the well pad. These perimeter PSs were grouped to assess potential spatial differences at the well pad: two PSs in the southwest corner, three PSs in the northwest corner, and three PSs on the eastern side of the well pad area (). The site groups were compared among themselves. For each site, concentrations were averaged across the 14-day period. The groups were compared using the exact Wilcoxon rank sum test on the location averages (Hollander and Wolfe, Citation1999). Two PSs more distant from the Barnett well pad perimeter were situated approximately 195 m and 290 m away from the center of the well pad (). The more distant sites were compared using the Wilcoxon signed rank test based on the differences within the 19 sampling periods. Only perchloroethylene levels were found to differ (5% significance level). Therefore, the two more distant sites were considered as one group at the Barnett well pad.
Figure 1. Sampling locations at Barnett production well pad.
The DJB well pad was located in Weld County, Colorado, near Fort Lupton and immediately north of Denver, CO (). This well pad consisted of eight wells, seven separators, 10 storage tanks, one vapor recovery unit, and four enclosed flares. Annual production of the DJB well pad in 2014 was 101,694 bbl/yr of oil and 759,357 MCF/yr of natural gas (Colorado Oil & Gas Conservation Commission, Citation2015). A temporary wastewater storage/treatment facility, which handled produced water that operated on the southern end of the well pad, was removed during the June 18–July 2 sample in 2014. A north–south access road ran along the eastern extent of the well pad and included frequent service truck traffic. Six PSs were located around the fenceline perimeter of the well pad and within 100 m from the center of the well pad. Sampling occurred from March 12, 2014, to September 24, 2014. A total of 13 sampling periods were collected at the DJB well pad for the study. Like the Barnett well pad, DJB well pad PSs were initially compared among themselves. To do this, the six PSs were split into two groups consisting of three sites on the eastern side and three sites on the western side of the well pad perimeter (). For each site, concentrations were averaged across sampling periods. The groups were compared using the exact Wilcoxon rank sum test on the site averages. No statistically significant differences were found between eastern and western groups, and thus, no further spatial analyses were performed at the DJB well pad.
Figure 2. Sampling locations at DJB production well pad after operational changes.
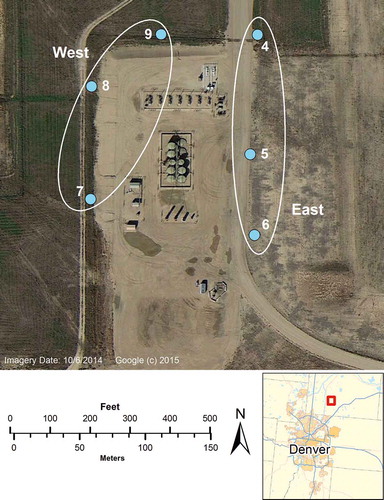
Operational changes on July 1, including the removal of a produced water treatment facility at the DJB well pad, coincided with an observed decline in VOC concentrations after this date. shows DJB well pad operations after operational changes occurred. Figure S1 in the Supplemental Material shows the DJB well pad before these changes occurred. To assess whether the earlier sampling periods at the well pad did indeed exhibit higher VOC concentrations, the results from the “early” time periods (before operational changes occurred) were compared with “latter” periods (after operational changes occurred). The eight early periods were compared to the five latter periods on a site-by-site basis using a one-sided exact Wilcoxon rank sum test (Hollander and Wolfe, Citation1999).
The Barnett and DJB well pads were located in rural areas with significant ONG production activities. For comparison to an urban setting, samples were collected during five 14-day sampling periods at three locations at an ambient air quality monitoring site near high-volume traffic in downtown Denver from November 6, 2013, through February 26, 2014. While concurrent monitoring at all locations was desired, logistic constraints (budgetary, laboratory workload, and a federal government shutdown) prevented it. The three sampling locations were within 8 m of each other and were averaged together. Data from downtown Denver were compared to the DJB well pad since both are in the Colorado Front Range.
Results
Summary statistics for VOCs are presented in for the Barnett well pad, DJB well pad, and downtown Denver sites. Median and mean concentrations in ppbv were highest at the DJB well pad, followed by downtown Denver, and the Barnett well pad. presents precision estimates of duplicate samples as the median of the percent coefficient of variation over all site-sampling period combinations; also displays median method detection limits (MDLs) in ppbv. Precision of duplicates was ≤10%, with the exception of m,p-xylene at the Barnett sites and styrene at the combined DJB and Denver sites, which had low concentrations. These findings were comparable to precision estimates found in a South Philadelphia refinery study (Mukerjee et al., Citation2016) and provided confidence that differences in VOC levels were more likely due to ambient rather than sampling method influences. Except for styrene, reported VOCs were above their respective MDLs.
Table 1. VOCs in ppbva for Barnett well pad, DJB well pad, and downtown Denver locations.
Table 2. Precision estimates of duplicate passive samplers as median percent coefficient of variation (CV), with median method detection limit (MDL) for study included.
QC sample results indicate excellent method recovery and minimal method background contributions. With n = 16 for field blanks, means for all target compounds were below 0.02 ppbv, well below the MDLs. Field spikes (n = 17) showed excellent recovery, with all compounds in the range of 99.8 to 103%.
Measurements from the DJB well pad PSs were then compared with corresponding data from the Barnett well pad PSs. Downtown Denver PSs were only compared to DJB well pad PSs since they were from the same geographical region. Site averages were calculated across sampling periods for the Barnett versus DJB well pad comparisons, and across sites for the downtown Denver versus DJB comparisons, and were compared using a two-sided exact Wilcoxon rank sum test due to the nonnormal distribution of observations. Because of the difference in early period and latter period sampling at the DJB well pad and since the latter period was considered permanent for the DJB well pad during the study, only sampling from the latter DJB well pad time frame was used for comparison to Barnett well pad and downtown Denver. presents these results of the group comparisons with differences reported as Hodges–Lehmann estimates. The DJB well pad generated higher concentrations of all VOCs when compared to the same VOC species measured at the Barnett well pad, with differences significant at the 1% level in each case. For the Denver–DJB comparisons, benzene and toluene were both statistically significantly higher (5% and 10% levels, respectively) at DJB, while Denver was higher (5% level) with respect to perchloroethylene. No significant differences were found for ethylbenzene, xylene isomers, or styrene.
Table 3. Comparisons of VOCs at DJB well pad (latter period) versus Barnett well pad and DJB well pad (latter period) versus downtown Denver.a
As stated in the Methods section, southwest, northwest, and eastern perimeter sites were initially compared at the Barnett well pad. Only the northwest versus east comparison showed any differences at the 10% significance level, as follows: Benzene was slightly higher at the eastern PSs and toluene, ethylbenzene, and the xylenes were slightly higher in the northwest corner. (All estimates of these differences were ≤0.1 ppbv.) Based on these results, perimeter PSs were considered as a single group for comparison to more distant PSs. Since the question of interest was whether the well pad was a source of VOCs, a one-sided test was employed.
Table 4. Barnett well pad VOC comparisons of perimeter and more distant PSsa.
reports the outcome of pairwise tests and Hodges–Lehmann estimates of differences at the DJB well pad between the early and latter periods. Ethylbenzene, toluene, and the xylenes were all significantly higher (most at the 1% level, other cases at the 5% level) at every well pad sampling site during the early period versus latter period. In addition, benzene and styrene were significantly higher (1% level) at two sites, and benzene was higher (10% level) at a third for early versus latter comparisons.
Table 5. DJB well pad VOC comparisons (site by site) testing early sampling prior to operational changes > latter sampling after operational changes made.a
Local meteorological data were used to assess the potential influence of weather on the VOCs measured. The Fort Lupton (for DJB well pad) and Denver areas revealed no prevailing wind directions during monitoring. However, winds were from the southeast for approximately 35% of the time in the Barnett well pad area. Two week averaged temperatures ranged from 1.6 to 29.4°C at the Barnett well pad during the study; at the DJB well pad, 2-week averaged temperatures ranged from 3.9 to 22.1°C. Mean (± standard deviation) 14-day temperatures near Fort Lupton, Denver, and Barnett well pad areas were 14.8 (± 5.6)°C, 3.9 (± 5.4)°C, and 19.3 (± 8.6) C, respectively (MesoWest, Citation2015). Meteorological data by sampling period is provided in Supplemental Material Table S1 for the Barnett well pad area and Table S2 for the Fort Lupton and Denver areas.
Discussion and conclusion
Passive sampling for select VOCs and HAPs, which included BTEX species, was conducted at two well pad locations, one in the Barnett Shale formation and the other in the DJB, and an air monitoring site in downtown Denver. The DJB well pad VOC concentrations measured were significantly higher than Barnett well pad VOCs, when compared for the same species. As mentioned, higher production rates at the DJB well pad versus the Barnett well pad were a likely explanation for higher VOC levels at the DJB well pad. (The 2011 EPA National Emissions Inventory basin level VOC emission factors for condensate composition used were 9.8 lb VOC/bbl for the Barnett and 13.7 lb VOC/bbl for the DJ Basin.) Average VOC concentrations at the Barnett well pad were below 1 ppbv, which has been confirmed in other studies of Barnett well pads in Wise County (Zielinska et al., Citation2014). For BTEX, benzene and toluene were significantly higher at the DJB well pad versus the traffic-dominated Denver site. BTEX species have been confirmed to be higher from ONG operations in the DJB area versus downtown Denver (Thompson et al., Citation2014). VOC concentrations measured at and near the fenceline of ONG pads are due to a number of factors, including meteorological conditions, background concentrations, passive sampler distance to potential sources, ONG product composition and production rates, and site operation and maintenance activities. Additionally, higher benzene emissions were observed from ONG operations than from traffic in the DJB area (Pétron et al., Citation2014).
For site groups at the Barnett well pad, VOC concentrations at the perimeter group were significantly higher than the more distant group, indicating that Methods 325A/B can distinguish the ONG operation from somewhat more distant locations. This agrees with other studies where passive monitoring studies have estimated higher levels of select VOCs in close proximity to Barnett ONG operations versus more distant locations with exponential decline in concentrations at distances over the first 100 m from these sources (Zielinska et al., Citation2014).
For BTEX comparisons at the DJB well pad, except benzene at two PSs, significantly higher levels were measured prior to operational changes versus after changes were made. As indicated, changes at the DJB well pad included removal of a produced water treatment facility. Source apportionment studies at well pad operations on a regional scale in the U.S. state of Wyoming have identified toluene and m,p-xylene to be associated with other ONG water treatment emissions (Field et al., Citation2015).
This pilot study demonstrated the utility of EPA Methods 325A/B for passive sampling of several VOCs at ONG well pad operations with continuous coverage over several months. We note that though 1,3-butadiene was part of the laboratory analysis, it was almost always below the detection limit; it is not clear whether this VOC was always so low or Methods 325A/B are not capable of detecting 1,3-butadiene. Use of passive samplers also revealed spatial gradients relative to source proximity at the Barnett well pad, as well as operational changes at the DJB well pad. Application of this sampling approach in South Philadelphia near petroleum refining operations also identified significantly higher concentrations for the majority of BTEX species measured at sites near the perimeter of refining versus sites further away (Mukerjee at al., Citation2016), though spatial scales in Philadelphia were larger than the Barnett well pad.
Passive samplers are not meant to replace conventional VOC collection methods such as whole air canister samplers. However, as demonstrated in this study, they can provide reliable results at well pad installations. Given their more economical nature and ease of deployment, they offer the opportunity for more widespread sampling at ONG operations in the future. The passive samplers used here measure a select number of VOC species and thus are limited in their ability to assess source contribution from ONG sources versus other sources such as traffic. Active sampling approaches and recent mobile monitoring technologies can be used to complement passive sampling capabilities and other fixed-site methods at well pads or other ONG operations in identifying hot spots and fugitive emissions (Brantley et al., Citation2014; Brantley et al., Citation2015). Results here were also limited to two well pad locations and a traffic-dominated site. It would be desirable to conduct monitoring using Methods 325A/B protocols at other well pad operations to confirm the spatial and source variability in VOCs encountered here.
Supplemental data
Supplemental data for this paper can be accessed on the publisher’s Web site.
Disclaimer
The U.S. Environmental Protection Agency through its Office of Research and Development funded and managed the research described here under contracts EP-D-10-070 and EP-D-11-006 to Alion Science and Technology and Eastern Research Group, respectively. The paper has been subjected to agency review and approved for publication. The views expressed in this paper are those of the authors and do not necessarily represent the views or policies of the U.S. Environmental Protection Agency. Mention of trade names or commercial products does not constitute an endorsement or recommendation for use.
Supplemental Material
Download Zip (1.3 MB)Acknowledgments
The authors thank John Turlington, Patti Tyler, Michael Morton, Jason Weinstein, and Ray Merrill of EPA and Laura VanEnwyck and Dave Dayton of Eastern Research Group for assistance. They also thank the Colorado Department of Public Health and the Environment, two industry collaborators, and the U.S. Forest Service for providing site access.
Additional information
Funding
Notes on contributors
Adam P. Eisele
Adam P. Eisele is an Environmental Engineer at U.S. Environmental Protection Agency (EPA) Region 8.
Shaibal Mukerjee
Shaibal Mukerjee and Donald A. Whitaker are Research Physical Scientists and Karen D. Oliver and Maribel Colon are Research Chemists, all at EPA’s Office of Research & Development (ORD), National Exposure Research Laboratory (NERL).
Luther A. Smith
Luther A. Smith is a Senior Statistician and Casson Stallings is a data analyst and environmental modeler with Alion Science & Technology.
Eben D. Thoma
Eben D. Thoma and Tai Wu are Physical Scientists with EPA/ORD’s National Risk Management Research Laboratory.
Donald A. Whitaker
Shaibal Mukerjee and Donald A. Whitaker are Research Physical Scientists and Karen D. Oliver and Maribel Colon are Research Chemists, all at EPA’s Office of Research & Development (ORD), National Exposure Research Laboratory (NERL).
Karen D. Oliver
Shaibal Mukerjee and Donald A. Whitaker are Research Physical Scientists and Karen D. Oliver and Maribel Colon are Research Chemists, all at EPA’s Office of Research & Development (ORD), National Exposure Research Laboratory (NERL).
Tai Wu
Eben D. Thoma and Tai Wu are Physical Scientists with EPA/ORD’s National Risk Management Research Laboratory.
Maribel Colon
Shaibal Mukerjee and Donald A. Whitaker are Research Physical Scientists and Karen D. Oliver and Maribel Colon are Research Chemists, all at EPA’s Office of Research & Development (ORD), National Exposure Research Laboratory (NERL).
Lillian Alston
Lillian Alston is a scientist working with EPA/ORD/NERL through the NCBA/SEE Program.
Tamira A. Cousett
Tamira A. Cousett is a Chemist currently with Jacobs Technology.
Michael C. Miller
Michael C. Miller is an Environmental Scientist and Donald M. Smith is a Physical Scientist at EPA Region 6.
Donald M. Smith
Michael C. Miller is an Environmental Scientist and Donald M. Smith is a Physical Scientist at EPA Region 6.
Casson Stallings
Luther A. Smith is a Senior Statistician and Casson Stallings is a data analyst and environmental modeler with Alion Science & Technology.
References
- Allen, D.T., V.M. Torres, J. Thomas, D.W. Sullivan, M. Harrison, A. Hendler, S.C. Herndon, C.E. Kolb, M.P. Fraser, A.D. Hill, B.K. Lamb, J. Miskimins, R.F. Sawyer, and J.H. Seinfeld. 2013. Measurements of methane emissions at natural gas production sites in the United States. Proc. Natl. Acad. Sci. USA 110:17768–73. doi:10.1073/pnas.1304880110
- Bolden, A.L., C.F. Kwiatkowski, and T. Colborn. 2015. New look at BTEX: Are ambient levels a problem? Environ. Sci. Technol. 49:5261–76. doi:10.1021/acs.est.5b03462
- Brantley, H.L., E.D. Thoma, W.C. Squier, B.B. Guven, and D. Lyon. 2014. Assessment of methane emissions from oil and gas production pads using mobile measurements. 48:14508–15. doi:10.1021/es503070q
- Brantley, H.L., E.D. Thoma, and A.P. Eisele. 2015. Assessment of volatile organic compound and hazardous air pollutant emissions from oil and natural gas well pads using mobile remote and on-site direct measurements. J. Air Waste Manage. Assoc. 65:1072–82. doi:10.1080/10962247.2015.1056888
- Colburn, T., K. Schultz, L. Herrick, and C. Kwiatkowski. 2014. An exploratory study of air quality near natural gas operations. Hum. Ecol. Risk Assess. 20:86–105. doi:10.1080/10807039.2012.749447
- Colorado Oil & Gas Conservation Commission. 2015. http://cogcc.state.co.us/#/home ( accessed 2015).
- Field, R.A., J. Soltis, and S. Murphy. 2014. Air quality concerns of unconventional oil and natural gas production. Environ. Sci. Process. Impacts 16:954–69. doi:10.1039/c4em00081a
- Field, R.A., J. Soltis, M.C. McCarthy, S. Murphy, and D.C. Montague. 2015. Influence of oil and gas field operations on spatial and temporal distributions of atmospheric non-methane hydrocarbons and their effect on ozone formation in winter. Atmos. Chem. Phys. 15:3527–42.doi:10.1039/c4em00081a
- Hollander, M., and D.A. Wolfe. 1999. Nonparametric Statistical Methods, 2nd ed., 35, 125. New York, NY: Wiley.
- McClenny, W.A., K.D. Oliver, H.H. Jacumin, E.H. Daughtrey, and D.A. Whitaker. 2005. 24 h diffusive sampling of toxic VOCs in air onto Carbopack X solid adsorbent followed by thermal desorption/GC/MS analysis—Laboratory studies. J. Environ. Monit. 7:248–56.doi:10.1039/b412213e
- McClenny, W.A., K.D. Oliver, H.H. Jacumin, E.H. Daughtrey, and D.A. Whitaker. 2006. Comparison of 24 h averaged VOC monitoring results for residential indoor and outdoor air using Carbopack X-filled diffusive samplers and active sampling—A pilot study. J. Environ. Monit. 8:263–69. doi:10.1039/B507850D
- McKenzie, L.M., R. Witter, L.S. Newman, and J.L. Adgate. 2012. Human health risk assessment of air emissions from development of unconventional natural gas resources. Sci. Total Environ. 424:79–87. doi:10.1016/j.scitotenv.2012.02.018
- MesoWest, University of Utah. 2015. Meteorological data. http://mesowest.utah.edu (accessed 2015).
- Moore, C.W., B. Zielinska, G. Pétron, and R.B. Jackson. 2014. Air impacts of increased natural gas acquisition, processing, and use: A critical review. Environ. Sci. Technol. 48:8349–59. doi:10.1021/es4053472
- Mukerjee, S., K.D. Oliver, R.D. Seila, H.H. Jacumin, C. Croghan, H. Daughtrey, L.M. Neas, and L.A. Smith. 2009. Field comparison of passive air samplers with reference monitors for ambient volatile organic compounds and nitrogen dioxide under week-long integrals. J. Environ. Monit. 11:220–27. doi:10.1039/B809588D
- Mukerjee, S., L.A. Smith, E. Thoma, K. Oliver, D. Whitaker, T. Wu, M. Colon, L. Alston, T. Cousett, and C. Stallings. 2016. Spatial analysis of volatile organic compounds in South Philadelphia using passive samplers. J. Air Waste Manage. Assoc. In press. doi:10.1080/10962247.2016.1147505
- Pétron, G., A. Karion, C. Sweeney, B.R. Miller, S.A. Montzka, G.J. Frost, M. Trainer, P. Tans, A. Andrews, J. Kofler, D. Helmig, D. Guenther, E. Dlugokencky, P. Lang, T. Newberger, S. Wolter, B. Hall, P. Novelli, A. Brewer, S. Conley, M. Hardesty, R. Banta, A. White, D. Noone, D. Wolfe, and R. Schnell. 2014. A new look at methane and nonmethane hydrocarbon emissions from oil and natural gas operations in the Colorado Denver–Julesburg Basin, J. Geophys. Res. Atmos. 119:6836–52. doi:10.1002/2013JD021272
- Rich, A., J.P. Grover, and M.L. Sattler. 2014. An exploratory study of air emissions associated with shale gas development and production in the Barnett Shale. J. Air Waste Manage. Assoc. 64:61–72. doi:10.1080/10962247.2013.832713
- Smith, L.A., S. Mukerjee, K.C. Chung, and J. Afghani. 2011. Spatial analysis and land use regression of VOCs and NO2 in Dallas, Texas during two seasons. J. Environ. Monitor. 13:999–1007. doi:10.1039/c0em00724b
- Thoma, E.D., M.C. Miller, K.C. Chung, N.L. Parsons, and B.C. Shine. 2011. Facility fence line monitoring using passive sampling. J. Air Waste Manage. Assoc. 61:834–42.doi:10.3155/1047-3289.61.8.834
- Thoma, E.D., W. Jiao, H.L. Brantley, T. Wu, W.C. Squier, B. Mitchell, K.D. Oliver, D.A. Whitaker, S. Mukerjee, C.A. Gross-Davis, H. Schmidt, R. Landy, J. DeWees, R. Merrill, R. Segall, A. Diem, B. Shine, E. Escobar, M.S. Amin, and M. Modrak. 2015. South Philadelphia passive sampler and sensor study: Interim report. Proceedings of the 108th Annual Conference of the Air & Waste Management Association, June 23–26, Raleigh, NC.
- Thompson, C.R., J. Hueber, and D. Helmig. 2014. Influence of oil and gas emissions on ambient atmospheric non-methane hydrocarbons in residential areas of Northeastern Colorado. Elementa Sci. Anthropocene 2. doi:10.12952/journal.elementa.000035
- U.S. Energy Information Administration. 2014. Annual energy outlook 2014. DOE/EIA-0383(2014). http://www.eia.gov/forecasts/AEO/pdf/0383%282014%29.pdf
- U.S. Environmental Protection Agency. 2015a. Method 325A—Volatile organic compounds from fugitive and area sources: Sampler deployment and VOC sample collection. 40 CFR Part 63, Subpart UUU [EPA-HQ-OAR-2010-0682; FRL-9720-4], RIN 2060-AQ75, Petroleum Refinery Sector Risk and Technology Review and New Source Performance Standards. http://www3.epa.gov/ttn/emc/promgate/m-325a.pdf.
- U.S. Environmental Protection Agency. 2015b. Method 325B—Volatile organic compounds from fugitive and area sources: Sampler preparation and analysis. 40 CFR Part 63, Subpart UUU [EPA-HQ-OAR-2010-0682; FRL-9720-4], RIN 2060-AQ75, Petroleum Refinery Sector Risk and Technology Review and New Source Performance Standards. http://www3.epa.gov/ttn/emc/promgate/m-325b.pdf.
- U.S. Environmental Protection Agency. 2015c. Nonattainment areas for criteria pollutants. Green Book. http://www.epa.gov/airquality/greenbook (accessed 2015).
- U.S. Environmental Protection Agency. 2015d. Enforcement and compliance history online. https://echo.epa.gov/targeting/knowledge-bases/land-based-oil-and-gas-search/results ( accessed 2015).
- Zielinska, B., D. Campbell, and V. Samburova. 2014. Impact of emissions from natural gas production facilities on ambient air quality in the Barnett Shale area: A pilot study. J. Air Waste Manage. Assoc. 64:1369–83.doi:10.1080/10962247.2014.954735