
ABSTRACT
Petrochemical Industries Company (PIC) in Kuwait has mitigated the pollution problem of ammonia and urea dust by replacing the melting and prilling units of finished-product urea prills with an environmentally friendly granulation process. PIC has financed a research project conducted by the Coastal and Air Pollution Program’s research staff at the Kuwait Institute for Scientific Research to assess the impact of pollution control strategies implemented to maintain a healthy productive environment in and around the manufacturing premises. The project was completed in three phases: the first phase included the pollution monitoring of the melting and prilling units in full operation, the second phase covered the complete shutdown period where production was halted completely and granulation units were installed, and the last phase encompassed the current modified status with granulation units in full operation. There was substantial decrease in ammonia emissions, about 72%, and a 52.7% decrease in urea emissions with the present upgrading of old melting and prilling units to a state-of-the-art technology “granulation process” for a final finished product. The other pollutants, sulfur dioxide (SO2), nitrogen oxides (NOx), and volatile organic compounds (VOCs), have not shown any significant change, as the present modification has not affected the sources of these pollutants.
Implications: Petrochemical Industries Company (PIC) in Kuwait has ammonia urea industries, and there were complaints about ammonia and urea dust pollution. PIC has resolved this problem by replacing “melting and prilling unit” of final product urea prills by more environmentally friendly “granulation unit.” Environmental Pollution and Climate Program has been assigned the duty of assessing the outcome of this change and how that influenced ammonia and urea dust emissions from the urea manufacturing plant.
Introduction
The fertilizer industry uses on 1.2% of the total world energy annually, out of which approximately 90%, 166 million tonne (MT), is used for ammonia production. (Danielou, Citation2012; Fertilizer Facts, Citation2014). A critical analysis of greenhouse gas (GHG) emissions from agriculture between 1961 and 2005 showed the positive role of enhanced agricultural productivity in reducing total GHG emissions and increased emissions from rising fertilizer production playing a positive role in controlled conversion of forests, wetlands, and other natural habitat to croplands (Danielou, Citation2012). From an environmental and commercial perspective, the efficient use and effectiveness of nitrogen fertilizers for food productivity for an ever-growing population allow their use to be not detrimental and to utilize all CO2 produced with minimal associated GHG emissions.
Byrnes (Citation1990) has summarized the effect of nitrogen fertilizers on the environment as the nitrate pollution of aquifer and greenhouse gas (GHG) emissions (nitrous oxide [N2O] and other oxides of nitrogen and ammonia). Zhu and Chin (Citation2002) have discussed nitrogen fertilizer use and contribution to food production in China from 1949 to 1998. They reported a decrease in production efficiency in the last decade with increased emissions of N2O and ammonia (NH3) and elevated nitrate concentration in surface and groundwater resulting in algal blooms. Snyder et al. (Citation2009) have assessed the impact of use of fertilizers in crop production on GHG emissions.
Wood and Cowie (Citation2004) have reviewed GHG emission factors for nitrogen fertilizer production and ammonia production, which is a highly energy-intensive process, mainly steam re-forming, of about 25–35 GJ/t of NH3. Zhou et al. (Citation2010) have reported that 3.2% of the total nationwide carbon dioxide (CO2) emissions are due to ammonia production in China. Therefore, there is considerable room to mitigate and conserve energy in the ammonia industry.
Meessen and Petersen (Citation2005) have described the history, physical and chemical properties, different commercial urea production processes, and uses in detail. Kirova-Yordanova (Citation2004) have applied energy analysis to ammonia synthesis recycle loop to efficiently use heat-and-cold recovery process to improve energy utilization during chemical reaction. Panjeshahi et al. (Citation2008) have divided ammonia production into hot end and cold end sections. In the hot end, two distinct approaches were adopted for energy efficiency. In the cold end, a retrofit study was dominated by reducing the amount of power consumption in the refrigeration system
The Snumprogatti Urea Technology (Citation2014) summarizes the latest breakthrough in urea production, focusing on synthesis and high-pressure recovery followed by purification and medium- and low-pressure recovery. Ammonia–carbon dioxide reaction is favored at high pressure due to Le Chatelier’s principle and is exothermic. The optimum operating conditions are maintained in the autoclave reactor, described as isobaric double recycle processes where molar ratio of feed NH3/CO2 ≥3.5 to 4 at pressure between 180 and 200 bars and temperature 185–190 °C maintained to provide over 70% conversion per pass based on CO2 feed. In the purification of urea, pressure is reduced to 27 bar in the first recycle to recover unreacted ammonia and CO2, and in the second recycle, pressure is reduced further to decompose ammonium carbamate to reactants to be separated and recycled to the reactor. Urea solution is concentrated and processed in a final granulation process (Hijfte and Vanmarcke, Citation1985). Low cost of urea production, high reliability, sustainable environmental pollution, easy and safe operation, and maintenance with minimal corrosion are inherited features of urea production technology.
Ana et al. (Citation2005) have reported ammonia and particulate pollutant effects on the workers of a fertilizer plant, where 66% of the employees had a complaint of respiratory disorder, 22% had eye irritation, and the reminder had dermal and other common complaints. Rahmanian et al. (Citation2015) have compared physical and chemical properties of the final product of urea, granules that have high strength and larger diameter than prills that retain more moisture and are smaller but more uniform than granules but have lesser strength.
PROZAP Engineering (Citation2009) provided an environmental solution by replacing prilling towers with granulation units in fertilizer plants. Phillips (Citation1995) have summarized all available control technologies for ammonia emissions consisting of both add-on control devices and pollution prevention techniques in all ammonia-related industries. As prilling technology is several decades old (Mavrovic, Citation1976), the efficiency of the manufacturing process has improved, and most of the units are operating over capacity, with low quality of prills as compared with granules, high emission of ammonia and urea, and demand from consumers to blend additional growth and production enhancing chemicals for the crops. Brouwer (Citation2011) of UreaKnowHow.com has explained a new process, “Rotoform pastillation system from Sandvik Process,” that has resolved all the emerging challenges with additional benefits.
Roper (Citation2015) has presented world ammonia production () and related it to natural gas production, showing a peak at year 2025 due to shale gas discovery. About 83% of the total worldwide ammonia produced is used in nitrogen fertilizers (Intergovernmental Panel on Climate Change [IPCC], Citation2007; Potash Corporation, Citation2011). Petrochemical Industries Company (PIC) was established in 1963 as a chemical fertilizer manufacturing complex, both in Kuwait and the region, comprising ammonia, urea, ammonium sulfate, and sulfuric acid. The production started in 1966 at the Shuaiba industrial area, 30 km south of Kuwait City, where the industrial capacity was augmented with the addition of further ammonia and urea plants in 1970. The production of ammonia and urea from the chemical fertilizer plants in Kuwait has been given in Factfish, and presented in , since 1966 (Slominski, Citation2015), and currently urea production has reached almost a million metric ton (106 MT). In years 2011–2012, the ammonia plants produced about 575.5 thousand MT, and with a 2.9% increase amounting to 599 thousand MT in years 2012–2013 (). Meanwhile, the urea plants produced about 845 thousand MT in 2011–2012, with a further increase of 4.4% at 875 thousand MT of urea in 2012–2013. The volume of ammonia sales reached 71.6 thousand MT, whereas the volume of urea sales was 873 thousand MT (Kuwait Petroleum Corporation [KPC], Citation2013).
Figure 1. Total world ammonia and urea production in Kuwait as reported by Roper (Citation2015) and Salominski (Citation2015).
There is a major concern about the influence of the industrial development on the local environment. Petrochemical industrial activities and other anthropogenic sources release significant amounts of air pollutants into the atmosphere, adversely affecting the environment. The final product, urea, was produced through the melting and prilling operations, emitting ammonia and urea. To resolve these emissions, prilling towers were replaced by granulation units in the fertilizer industry. Ambient air quality in the vicinity of these industrial plants was monitored prior to modification, during shutdown, and after completion of upgrading work. Commercial urea manufacture utilizes large quantities of CO2 gas as one of the reactant facilitating carbon fixation (0.73 tons of CO2 per ton of urea produced).
The major objective of this modification is to phase out the old melting and prilling units in the production of urea with a new granulation environmentally friendly process. The Coastal and Air Pollution Department of the Kuwait Institute for Scientific Research (CAD/KISR) has completed this project to assess the impact of upgrading of urea production on the air quality of the surrounding area at the ammonia-urea production complex.
Methodology
PIC environmental department has used stack monitors isokinetically to determine the concentrations of different pollutants, ammonia (impinged in 0.1 N sulfuric acid solution and later quantified using ion chromatography) and urea (accumulated on fiberglass filter) dust from scrubber (T607), and SO2 and NO2 from boiler stacks prior to modification between November 2000 and May 2001, and further measurements were made after the full conversion to the granulation process between September 2004 and July 2005, as tabulated in . The simple sketch of the melting and prilling and modified granulation processes is presented in Scrubber T607 was used to treat air streams from cyclone/heater and prilling tower in melting and prilling process while treated air stream from granulator and coolers in granulation process. The concentrations of the pollutants as mg m−3 in the flue gases were measured with total gas flow rate at stack conditions (dry and wet bases), and emission rates were calculated as (g s−1) for each pollutant.
Table 1. Emmision rates of different pollutants measured in the stacks.
Figure 2. Simplified flow diagram for (a) melting and prilling process; (b) granulation process.
Urea dust at various sampling locations was quantified using a high-volume sampler (HVAS) that collected particulate matter on fiberglass filter for 24 hr of operation. These filters were digested and tested for nitrogen contents using Kjeldahl method for total nitrogen and Skalar method for nitrogen from ammonia (inorganic), in which the concentration of organic nitrogen is measured by difference (Clesceri et al., Citation1989). The amount of urea was calculated by mulitplying difference in nitrogen contents with a factor 2.143.
Air dispersion model SCREEN3 was used to identify the location for continuous monitoring of primary pollutants and meteorological parameters using Kuwait Institute for Scientific Research’s Ambient Air Quality Mobile Laboratory (AQML) for the same specified periods with respect to point sources and meteoreological conditions (wind speed, direction, atmospheric stability classes, etc.) (Alhajraf et al., Citation2004). AQML has CO/CO2 analyzer (infrared [IR] correlation), sulfur compounds analyzer (ultraviolet [UV] fluorescence), NH3, nitric oxide [NO], and NO2 analyzer (chemiluminescence), CH4 and nonmethane analyzer (flame ionization detector), and metereoreological parameters were also continuously measured.
Results and discussion
Urea dust discharged as kilogram per MT of urea manufactured was plotted in . A reduction of about 39.2% for urea dust and 72.9% for ammonia discharge was observed. The reduction in urea dust was smaller due to particulate dynamics and cyclones. SO2 has been reduced marginally due to the shutdown of only one heater.
Figure 3. Urea dust emissions from stack (kg/MT of urea produced) before and after the implementation of granulation process.
Concentrations of primary pollutants have been presented in the following figures for both periods of melting and prilling and the granulation processes. shows particulate matter daily average concentrations from 11 December 2001 to 14 February 2002. There was no exceedence of the daily air quality standards, but in the later period from l April to 30 April 2004 there were five exceedences, mainly due to prevalent meteorological conditions originating from dusty events.
Figure 4. Particulate matter (PM10) daily concentrations in (µg m−3) from AQPL before and after the modification of granulation process.
shows variation of nonmethane hydrocarbon daily concentrations. There was 100% exceedence during the melting and prilling process and had frequent exceedence for the granulation period as well. High degree of violations was attributed to the three main refineries adjacent to the petrochemical industries, with additional emissions from sea traffic and road traffic contributing to the alleviated levels of volatile organic compounds (VOCs).
Figure 5. Nonmethane hydrocarbons daily concentrations in (ppm) from AQPL before and after the modification of granulation process.
SO2 concentrations before and after the modification were low () due to tail gas recovery plant that has been operational in the vicinity of petrochemical plants producing solid sulfur. One boiler was taken out of service, contributing to the reduction of SO2 emissions at about 2.87%, as reported in .
Figure 6. Sulfur dioxide daily concentrations in (ppb) from AQPL before and after the modifcation of granulation process.
H2S concentrations were low during the melting and prilling process, but a few times exceedence was noticed after the installation of the granulation process (), mainly due to malfunction in the tail gas treatment facility. The alteration of installation of granulation process was to reduce ammonia and urea emissions, and there was almost 73% reduction and there were no violations noticed for ambient ammonia levels before and after the modifications ().
Figure 7. Hydrogen sulfide daily concentrations in (ppm) from AQPL before and after the modification of granulation process.
Figure 8. Ammonia daily concentrations in (ppb) from AQPL before and after the modification of granulation process.
There were exceedences observed during the melting and prilling process, but with modifications NO2 emissions reduced slightly, as one heater/boiler was taken out of service, and no any violation () was noticed.
Figure 9. Nitrogen dioxide daily concentrations in (ppb) from AQPL before and after the modification of granulation process.
Ammonia, urea, and SO2 emission rates before and after the modification are tabulated in . The stacks information and meteorological data for the execution of dispersion model programs are all given in detail in Alhajraf et al. (Citation2004).
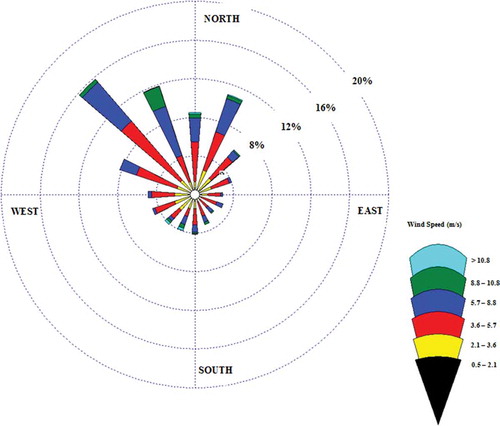
shows the wind rose for the last 30 years as recorded and reported by Civil Aviation Meteorological Department located at Kuwait International Airport. Wind rose illustrates the frequency of different speeds and their respective direction, which are used in dispersion modeling. It is clearly indicated that the main wind direction is blowing from the northwest most of the year, whereas the second predominant wind is blowing from the northeast.
Figure 10. Wind rose data for the last 30 years from the Kuwait Aviation Meteorological Department at Kuwait International Airport.
Yearlong meteorological data with emission rates () and stack specifications were used in the application of a dispersion model for both operational conditions of urea manufacturing process, melting and prilling prior to alteration, and the latest introduction of the granulation process. Industrial Source Complex—Short Term (ISCST3) model was used, and the highest hourly, daily, and annual concentrations for ammonia and urea at the specified locations were tabulated, as seen in (U.S. Environmental Protection Agency, Citation1995). The computed results for ammonia concentrations were compared with daily monitored values at discrete receptor (AQML) to ensure the right model setup and its performance. Isopleths for ammonia and urea dust before and after the modification for hourly and daily distribution are presented in . There has been substantial decrease in the areas of influence and ground-level concentrations, as is obvious from the figure. To a lesser extent, similar trends were observed for SO2 and NO2 concentrations due to the stoppage of some of the process heater operations that were compulsory for the prilling unit (Alhajraf et al., Citation2004).
Table 2. Computed maximum ground-level concentrations of ammonia and urea by dispersion model.
Figure 11. Isopleths for maximum hourly and daily ammonia and urea concentrations. (a) Hourly NH3 melting and prilling. (b) Hourly NH3 granulation. (c) Daily NH3 melting and prilling. (d) Daily NH3 granulation. (e) Hourly urea melting and prilling. (f) Hourly urea granulation. (g) Daily urea melting and prilling. (h) Daily urea granulation.
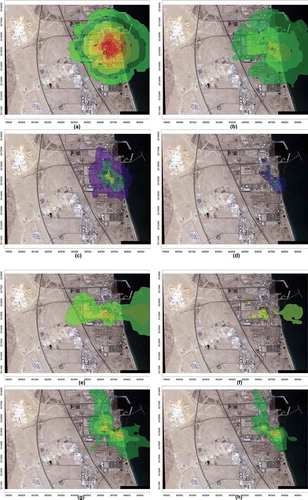
Model results showed high concentrations in the winter months due to low temperatures, and narrow thermal planetary boundary layer trapping all the pollutants in the limited space. In summer months there were high temperature reaching 50 °C and strong northwesterly winds originating from dust storms, which facilitated in lower concentrations of the respective pollutants. The model results, isopleths in , represented hourly, daily maximum ground-level concentrations of ammonia ( and ) that were from the north and northeasterly directions about <400 m from the stack and for urea ( and ) that were from the northern direction about >400 m from the stack for melting and prilling process.
There was large reduction in ammonia emissions after the installation of the granulation process, and it was found that computed maximum concentrations, hourly and daily, of ammonia were from southeasterly direction about >400 m from the stack (shown in and ) and urea concentrations were from the north and southeasterly directions about >400 m from the stack (presented in and h) isopleths for granulation process.
PM10 (particulate matter with an aerodynamic diameter <10 μm) as urea dust samples were collected daily using HVAS and were analyzed for total nitrogen concentration using the Kjeldahl and Skalar methods. Organic nitrogen values were multiplied by 2.143 to provide the amount of urea per filter. The concentration in the air was calculated by dividing this amount by total air passed through the filter for 24 hr. There was an obvious decrease in the ambient ammonia and urea concentrations, about 30% and 34%, in PM10 samples due to the upgrade to the granulation process from the old melting and prilling process.
Conclusion
Fertilizer industries, especially of urea, utilize CO2, one of the major greenhouse gases, and the environmental impact of nitrogen-based fertilizer industries has been the focus of research for energy saving and the control of GHG emissions. Industrial emissions from ammonia–urea plants have been reduced by the replacement of old melting and prilling processes by the up-to-date technology of granulation processes. Ammonia and urea emissions were measured from the stacks before and after the modification, and 72.9% and 29.2% reduction were observed for ammonia and urea, respectively. Ammonia and urea concentrations were measured in PM10 samples collected for 24 hr using HVAS, and 30% and 34% reduction were noticed for ammonia and urea pollutants. Dispersion model results revealed 89.3%, 82.9%, and 77.3% decrease in ammonia in the hourly, daily, and annual predicted maximum concentrations, respectively. For urea, the model results indicated 19.8%, 7.7%, and 21.8% drop in hourly, daily, and annual calculated concentrations, respectively. The ambient concentrations of SO2, NOx, and VOCs have not changed due to the least effect on the emissions of this modification.
Funding
Petroleum Industries Company has sponsored this project and their financial assistance is highly acknowledged, without which this project may not have been completed.
Additional information
Funding
References
- Alhajraf, S., A. Khan, L. Al-Awadhi, A. Al-Khubaizi, E. Tharkaet, and N. Ahmad. 2004. Assessment of the Air Pollution Levels within the Area of Petrochemical Industry Company (PIC). Final Project Report EC002C. Kuwait: Kuwait Institute for Scientific Research.
- Ana, G.R.E.E., P.K.C. Sirdhar, and T.F. Olawuyi. 2005. Air pollution in a chemical fertilizer complex in Nigeria: The impact on the health of the workers. J. Environ. Heath Res. 4:111–112.
- Brouwer, M. 2011. A single solution to four challenges, Nitrogen+syngas 313, Sandvik Process Systems, Fellbach, Germany. http//:www.processsystems.sandvik.com, [email protected] ( accessed August 27, 2014).
- Byrnes, B.H. 1990. Environmental effects of N fertilizer use—An overview. Fertilizer Res. 26:209–215. doi:10.1007/BF01048758
- Clesceri, L.S., A.E. Greenberg, and R.R. Trussell. 1989. Standard Methods for the Examination of Water and Wastewater, 17th ed., 5.51–5.54. Baltimore, MD: Port City Press.
- Danielou, M. 2012. Feeding the Earth, increasing agricultural productivity to mitigate greenhouse gas emissions. International Fertilizer Industry Association (IFA). http//:www.fertilzer.org ( accessed September 1, 2014).
- Fertilizer Facts. 2014. Ammonia production: Moving towards maximum efficiency and lower GHG. http//:www.fertilzer.org (accessed September 1, 2014).
- Hijfte, W.H.P., and L.A. Vanmarcke. 1985. Process for the production of urea granules. United State Patent No. 4,525,198.
- Intergovernmental Panel for Climate Change. 2007. Ferilizer manufacture. https://www.ipcc.ch/publications_and_data/ar4/wg3/en/ch7s7-4-3-2.html ( accessed September 3, 2014).
- Kirova-Yordanova, Z. 2004. Exergy analysis of industrial ammonia synthesis. Energy 29:2373–2384. doi:10.1016/j.energy.2004.03.036
- Kuwait Petroleum Corporation (KPC). 2013. 2012–2013 KPC Annual Report: Sustaining Stability. https://www.kpc.com.kw/press/KPCPublications/Pages/Annual-Reports.aspx (accessed June 10, 2014).
- Mavrovic, I. 1976. Process for prilling urea. United States Patent No. 3,933,956.
- Meessen, J.H., and H. Petersen. 2005. Urea. In Ullmann’s Encyclopedia of Industrial Chemistry, 333–365. Weinheim, Germany: Wiley-VCH.
- Panjeshahi, M.H., E.G. Langeroudi, and N. Tahouni. 2008. Retrofit of ammonia plant for improving energy efficiency. Energy 33:46–64. doi:10.1016/j.energy.2007.08.011
- Phillips, J. 1995. Control and Pollution Prevention Options for Ammonia Emissions. EPA-456/R95-002. EPA Contract No. 68-D1-0073, Work Assignment No. 3-39. Research Triangle Park, NC: Control Technology Center, U.S. Environmental Protection Agency.
- Potash Corporation. 2011. Potash Corporation of Saskatchewan, Online Overview, Nutrient. https://www.potashcorp.com/industry_overview/2011/neutrient/46 (accessed September 8, 2014).
- PROZAP Engineering. 2009. Stop Pollution Prozap, for Environment Prilling Tower/Granulator Emission Control Unit. http//:www.prozap.com.pl/…prilling_towergranulator_emissioncontrol_unit.pdf ( accessed March 27, 2014).
- Rafiqul, I., C. Weber, B. Lehmann, and A. Voss. 2005. Energy efficiency improvements in ammonia production-prospective and uncertainties. Energy 30:2487–2504. doi:10.1016/j.energy.2004.12.004
- Rahmanian, N., S. Naderi, E. Supuk, R. Abbas, and A. Hassanpour. 2015. Urea finishing process: Prilling versus granulation. Proc. Eng. 102:174–181. doi:10.1016/j.proeng.2015.01.122
- Roper, L.D. 2015. World ammonia production, January 11. http://minerals.usgs.gov/minerals/pubs/commodity/nitrogen/ ( accessed November 1, 2015).
- Slominski, B. 2015. Urea Production World Statistics and Data. Munich Germany: Factfish. http://www.factfish.com/statistic-country/india/urea%2C%20consumption ( accessed November 1, 2015 ).
- Snyder, C.S., T.W. Bruulsema, T.L. Jensen, and P.E. Fixen. 2009. Review of greenhouse gas emissions from crop production systems and fertilizer management effect. Agric. Ecosyst. Environ. 133:247–266. doi:10.1016/j.agee.2009.04.021
- The Snumprogatti Urea Technology. 2014. eni-saipem 2014. http://www.saipem.com/site/download.jsp?idDocument=1321spm_UREAri_L01_1.pdf ( accessed March 26, 2014).
- U.S. Environmental Protection Agency. 1995. User’s Guide for Industrial Source Complex ISC3 Dispersion Models. Research Triangle Park, NC: U.S. Environmental Protection Agency, Office of Air Quality Planning and Standards Emissions, Monitoring and Analysis Division. http://www3.epa.gov/scram001/userg/regmod/isc3v1.pdf ( accessed March 31, 2014).
- Wood, S.W., and A. Cowie. 2004. A Review of Greenhouse Gas Emission Factors for Fertilizer Production. IEA bio-energy Task 38.org. http//:slocombe.com.au/Publication/GHG_Emission_Fertilizer_production_July2004.pdf ( accessed May 4, 2014).
- Zhou, W., B. Zhu, Q. Li, T. Ma, S. Hu, and C. Griffy-Brown. 2010. CO2 emissions and mitigation potential in China’s ammonia industry. Energy Policy 38:3701–3709. doi:10.1016/j.enpol.2010.02.048
- Zhu, Z.L., and D.L. Chen. 2002. Nitrogen fertilizer use in China—Contributions to food production, impacts on the environment and best management strategies. Nutr. Cycl. Agro-ecosyst. 63:117–127. doi:10.1023/A:1021107026067