
ABSTRACT
Select volatile organic compounds (VOCs) were measured in the vicinity of a petroleum refinery and related operations in South Philadelphia, Pennsylvania, USA, using passive air sampling and laboratory analysis methods. Two-week, time-integrated samplers were deployed at 17 sites, which were aggregated into five site groups of varying distances from the refinery. Benzene, toluene, ethylbenzene, and xylene isomers (BTEX) and styrene concentrations were higher near the refinery’s fenceline than for groups at the refinery’s south edge, mid-distance, and farther removed locations. The near fenceline group was significantly higher than the refinery’s north edge group for benzene and toluene but not for ethylbenzene or xylene isomers; styrene was lower at the near fenceline group versus the north edge group. For BTEX and styrene, the magnitude of estimated differences generally increased when proceeding through groups ever farther away from the petroleum refining. Perchloroethylene results were not suggestive of an influence from refining. These results suggest that emissions from the refinery complex contribute to higher concentrations of BTEX species and styrene in the vicinity of the plant, with this influence declining as distance from the petroleum refining increases.
Implications: Passive sampling methodology for VOCs as discussed here is employed in recently enacted U.S. Environmental Protection Agency Methods 325A/B for determination of benzene concentrations at refinery fenceline locations. Spatial gradients of VOC concentration near the refinery fenceline were discerned in an area containing traffic and other VOC-related sources. Though limited, these findings can be useful in application of the method at such facilities to ascertain source influence.
Introduction
Passive samplers for volatile organic compounds (VOCs) and other gaseous pollutants have been used in ambient air quality studies to assess impact from urban and industrial sources. These samplers are an attractive method for saturation air monitoring owing to their small size, low cost, and ease of use in the field. VOC passive samplers may be used to monitor select petroleum-related VOCs such as benzene, toluene, ethylbenzene, and xylene isomers (BTEX) and do not require a power source. Sampling integrals are typically a week or more for passive samplers to measure pollutants above detection limits (Kumar and Víden, Citation2007; Martin et al., Citation2005; Partyka et al., Citation2007).
In 2009, the U.S. Environmental Protection Agency (EPA) deployed Carbopack X passive sampling tubes to measure benzene and other VOCs at fenceline locations at a petroleum refinery in Corpus Christi, Texas, USA. This yearlong study reported that these samplers were comparable to reference VOC methods (Thoma et al., Citation2011). Similar comparison results with these samplers have been found elsewhere (McClenny et al., Citation2006; Mukerjee et al., Citation2009; Smith et al., Citation2011). The Corpus Christi study also reported elevated benzene concentrations downwind of the refinery and demonstrated the effectiveness of using this sampler for fenceline monitoring. The EPA Methods 325A and 325B have been established to monitor fenceline benzene levels that may originate from fugitive and area sources within petroleum refineries (EPA, Citation2015a; Citation2015b). These methods include use of passive tube samplers with Carbopack X and or equivalent sorbents.
Continuing these near-source monitoring efforts, the EPA recently conducted VOC monitoring studies using Carbopack X passive sampling tubes at sites near and away from fenceline locations at a petroleum refinery and other operations in South Philadelphia (Thoma et al., Citation2015) and at oil and natural gas operations (Eisele et al., Citation2016). This paper details the results of the South Philadelphia study in terms of spatial gradients. Further information on these methods along with the use of sensors and meteorological data to further assess impact of the refinery are described in Thoma et al. (Citation2015).
Methods
General information on EPA’s use of passive samplers, including deployment methods, validation comparisons, and laboratory analysis and analytical components, is described elsewhere (Eisele et al., Citation2016; McClenny et al., Citation2005, Citation2006; Mukerjee et al., Citation2009; Thoma et al., Citation2011, Citation2015), with specific details of the Philadelphia passive sampler and sensor study in Thoma et al. (Citation2015). With the exception of deployment locations, sampling methods applied were similar to EPA Methods 325A and 325B (EPA, Citation2015a; Citation2015b). In brief, passive samplers were reuseable Supelco model 28686-U tubes packed with 40/60 mesh size Carbopack X adsorbent (Sigma-Aldrich, St. Louis, MO, USA) deployed for 2-week sampling integrals. Samplers were deployed in duplicate at each site for all sampling periods to evaluate precision. Analysis of samples was a modified version of EPA Method 325B using thermal desorption/gas chromatographic (GC)/mass spectrometric (MS) techniques with a PerkinElmer TurboMatrix ATD (automated thermal desorber; Shelton, CT) interfaced to an Agilent 6890 GC/5975 MS (Santa Clara, CA). The TurboMatrix ATD was equipped with an SVI focusing trap (custom item, PerkinElmer). Upon desorption from the focusing trap, the VOCs were transferred to an Rxi-1ms 60 m × 0.32 mm × 1 μm capillary GC column (part number 13357; Restek, Bellefonte, PA) for GC separation of analytes. The GC oven program was 35 °C with a 5 min initial hold time, followed by a ramp of 6 °C/min to 210 °C with a final hold time of 0.83 min for a total GC run time of 35 min; the MS was operated in selected ion monitoring mode for optimum sensitivity. Following analysis, the samplers were reconditioned and redeployed in the field. A protective shelter housed each sampler and its duplicate; shelters were attached to electronic/mechanical billboards with no VOC sources, light poles or fence or ground stakes; sampling heights for most sites were 2–4 m. Monitoring occurred from June 18, 2013, to March 25, 2015. Concentrations were reported in parts per billion by volume (ppbv) for BTEX species, perchloroethylene, and styrene. Carbon tetrachloride and 1,3-butadiene were measured but not reported here, since 1,3-butadiene was below detection in nearly every sample and carbon tetrachloride quality control recovery samples fell outside the project’s ±30% recovery criteria for laboratory analyses.
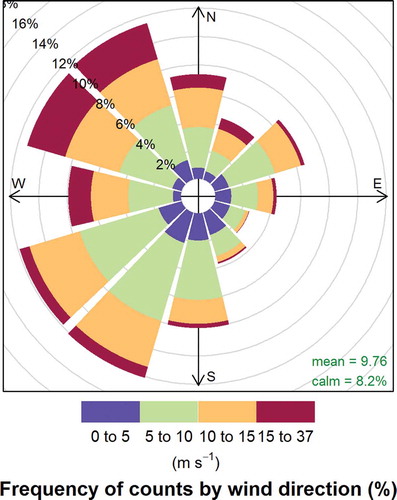
displays the seventeen monitoring site locations in South Philadelphia. Specific site details as well as meteorological conditions by sampling period are presented elsewhere (Thoma et al., Citation2015). For 2-week sampling times, meteorological conditions were typically very variable. For the study, the overall resultant wind vector was −0.4 m/sec north, 1.3 m/sec east, reflecting predominant winds from the west, with 98% of the 2-week periods exhibiting positive easterly components. North-south winds were more mixed with winds more from the north in wintertime periods. ( shows the mean wind frequencies by direction and speed during the study at the nearby Philadelphia International Airport.) Most of the study sites were situated east of the refinery to capture general downwind impact. For the statistical comparisons, sites were grouped according to distance from the refinery. Other facilities, traffic, and other urban sources of VOCs also impacted the area. Further description of this refinery and its location are provided elsewhere (Kondo et al., Citation2014). Five sites were designated as “near fenceline,” since they were 30–40 m from the refinery’s boundary and near its central section where distillation units and an associated tank farm were located. The near fenceline group locations were also adjacent to South 26th Street, a major road that feeds U.S. Interstate 76 (I-76). One site was near the southern end of the refinery complex and South 26th Street and was designated as “south edge.” Two sites were near the northern end of the refinery complex and I-76; these were designated as “north edge.” Four other sites were designated as “mid-distance” and were further away from the refinery. The final group included five sites in residential neighborhoods or parks located >1 km from the refinery and were named “removed.”
Figure 1. Study area in South Philadelphia with monitoring sites associated with groups.
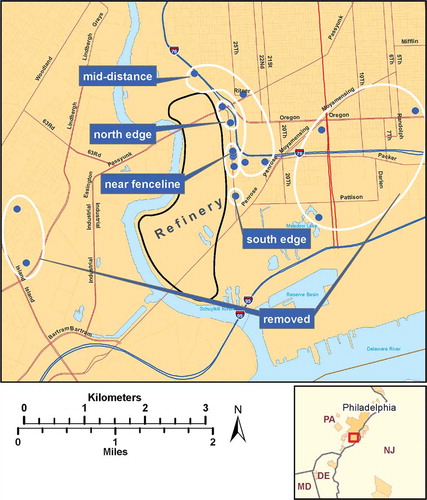
Figure 2. Mean frequencies of wind direction and speed at Philadelphia International Airport during the study. Frequencies indicate direction from which the wind is blowing.
The “edge” sites were split into the two groups mentioned after comparing the southern site with the two more northerly locations. For each sampling period when all three sites were operating, the concentration of each chemical was checked to see whether the level at the southern site fell below, within, or above the values seen at the two northern sites. The resulting proportions for each outcome were then calculated for each chemical. Confidence intervals were then formed for each proportion using Goodman’s (Citation1965) tighter alternative to Quesenberry and Hurst’s (Citation1964) confidence intervals for simultaneous inference on multinomial probabilities. It was found that there were statistically significant (5% level) differences between northern and southern sites for each chemical except styrene. Benzene concentrations were much more often between (as opposed to above or below) those monitored at the northern sites, thus exhibiting a narrower dispersion at the southern site. Further, toluene, ethylbenzene, the xylenes, and perchloroethylene were found at lower levels at the southern site. Therefore, the edge sites were divided into north edge and south edge.
Similarly, the “removed” sites were divided into those on the western side (two sites) and those on the eastern side (three sites) of the study area (see ). Within the removed group, the eastern and western subgroups were compared using the Wilcoxon signed-rank test on the differences between the subgroup means for the sampling periods. Statistically significant differences were found for toluene, styrene, and perchloroethylene. However, based on the associated Hodges-Lehmann estimates of the differences, these differences were small, particularly when compared with differences relative to the mid-distance group. Because most of the BTEX species were not different and differences for the three other chemicals were small, the removed group was not subdivided for the succeeding analyses.
To address the question of whether VOC levels were higher with closer proximity to the refinery, site groups were compared in terms of closer versus farther away. Within each sampling period, concentrations were averaged over the sites within each group. Pairwise group differences were then calculated. The hypotheses that groups nearer the refinery yielded higher concentrations were examined via one-sided Wilcoxon signed-rank tests applied to the pairwise differences across the sampling periods. Overall group differences were estimated with the associated Hodges-Lehmann estimator (Hollander and Wolfe, Citation1999). All statistical analyses were performed in SAS version 9.3 (SAS, Citation2004). Prior to statistical summarization or testing, any concentrations reported as below the detection limit were set to half the detection limit.
Results
reports the minimum, median, and maximum concentrations and coefficients of variation for the VOCs collected over all sites in South Philadelphia and by site group. Table S1 in Supplemental Material provides additional summary statistics tables for VOCs over all sites and by group. For BTEX species, overall decreasing concentrations were seen with increasing distance of site groups from the central part of the refinery. Median and mean perchloroethylene concentrations were highest at the removed group. The median benzene concentration from the Corpus Christi fenceline sites was 0.71 ppbv (Thoma et al., Citation2011), which is comparable to the edge groups and below the fenceline group here. Although not shown, BTEX species mean values were highly correlated (Pearson correlation coefficient >0.9) with each other; styrene was less correlated (Pearson correlation coefficient <0.8) with BTEX. Perchloroethylene, which is typically associated with dry-cleaning operations, was not strongly correlated with the other VOCs.
Table 1. Median values of VOCs in ppbv for all sites and each group,a median method detection limit (MDL, in ppbv) for study, and median percent coefficient of variation (CV) of duplicates for all sites.
also presents precision estimates as the median of the percent coefficient of variation over all site-sampling period combinations. The precision of duplicate samples was <10%, with the exception of styrene, which had low concentrations. This is comparable to similar precision estimates found in earlier studies using the same passive sampler in Detroit (Mukerjee et al., Citation2009) and Dallas (Smith et al., Citation2011); similar precision was estimated for benzene in Corpus Christi (Thoma et al., Citation2011).
reports the outcome of pairwise tests and Hodges-Lehmann estimates of the differences. Statistical significance was declared at 1%, 5%, and 10% levels. Note that higher concentrations were almost always associated with the group closest to the refinery, and the 1% significance level was by far the most common one in the table. The only nonsignificant results were for ethylbenzene and the xylenes for near fenceline versus north edge, perchloroethylene for near fenceline versus mid-distance, and styrene for south edge versus near fenceline comparisons.
Table 2. Results of site group comparisonsa.
also indicates that the magnitude of estimated differences generally increased when proceeding through groups ever farther away from the refinery. For example, in the case of benzene, estimated differences formed an increasing sequence when moving from comparing near fenceline to north edge, then south edge, then mid-distance, and finally removed groups. Similarly, the difference was larger when comparing north edge to mid-distance as opposed to removed groups, and the analogous statement holds for south edge comparisons. This pattern manifests itself throughout for the BTEX species. These results suggest that emissions from the refinery complex contributed to higher concentrations of BTEX species in the vicinity of the plant, with this influence declining as distance to the petroleum refining increases.
This testing was repeated for “warm” and “cool” seasons to assess seasonal influence in the spatial analyses. The warm season was determined by sampling periods whose start date was in the months of June–November, inclusive; all other samples were designated to be in the cool season. The results were virtually identical to those reported in with respect to significant differences and the pattern in the magnitude of the differences. summarizes for which season/pollutant combinations differences in statistical significance (10% level) of the group comparisons were found versus the full period testing in .
Table 3. Summary of changes in statistical significance (10% level) for seasonal comparisons versus the entire period of sampling.
Parenthetically, EPA Region 3 conducted similar passive sampling over a broader geographic area, but with one site collocated with one of the South Philadelphia sites (a site known as Ritner in the mid-distance group). Nine 2-week sampling periods coincided for the studies. The results were compared with the Wilcoxon signed-rank test, and no statistically significant difference for any VOC was found between the two studies. The Region 3 study included a site at the Philadelphia International Airport; median levels at the airport were found to be below those reported for the removed group in . (In addition, Region 3 also used canisters to monitor at the same collocated site, but this monitoring was only conducted every sixth day. Table S2 in Supplementary Material summarizes this canister monitoring over the time frame of the South Philadelphia study).
Discussion and conclusion
Using methods similar to EPA Methods 325 A/B, passive sampling for select VOCs in South Philadelphia revealed spatial gradients of potential emissions from refinery operations in an area containing traffic and other sources. BTEX concentrations at the near fenceline group were significantly higher than in groups on the refinery’s edges and further away. Also, differences between one group and others for BTEX and styrene increased the further the other group was from petroleum refining. Average wind flows during the study were predominantly from west to east (Thoma et al., Citation2015), and this may have also contributed to differences in VOC levels between the edge and more distant groups. Only minimal, if any, differences were seen when comparisons were done for separate warm and cool seasons, as opposed to over all observations.
Only benzene and toluene were significantly higher at the near fenceline versus the north edge group. Styrene and perchloroethylene concentrations estimated differences for the near fenceline group were lower than the north edge. Since I-76 was adjacent to sites in the north edge group, the pairwise results for ethylbenzene and xylenes for this group versus near fenceline may indicate that VOCs from high-volume traffic, in addition to refinery and other facility emissions, was impacting the north edge. Additional comparative analyses of passive sampler benzene levels along South 26th Street (Thoma et al., Citation2015, and manuscript in preparation) indicated that traffic was not likely a major source.
Limitations on these results include lack of actual source samples at the refinery and other sources to help differentiate source impacts. Also, the small number of sites per group, particularly for the south edge, may have lessened the spatial representativeness of groups. The good precision of sample duplicates suggested that differences in VOC levels were more likely due to source impact rather than sampling method influences. As in Corpus Christi for benzene, the South Philadelphia study suggested potential gradients of concentrations resulting from refinery emissions for BTEX and styrene, notwithstanding the presence of other VOC sources. The EPA Methods 325A/B call for passive samplers to be deployed for 14-day periods at fenceline locations and the temporally integrated results here over the same sampling periods are relevant for long-term ambient exposure assessment. Future publications from the South Philadelphia study will examine benzene information from real-time sensors with additional analysis of this passive data that point more specifically to the source of emissions.
Funding
This study was an EPA Air Climate and Energy and Regional Applied Research Effort Project. The U.S. Environmental Protection Agency through its Office of Research and Development funded and managed the research described here under contracts EP-D-10-070, EP-D-11-006, and EP-C-09-027 to Alion Science and Technology, Eastern Research Group, and Arcadis, respectively. The paper has been subjected to Agency review and approved for publication. The views expressed in this article are those of the authors and do not necessarily represent the views or policies of the U.S. Environmental Protection Agency. Mention of trade names or commercial products does not constitute an endorsement or recommendation for use.
Supplemental Material
Download Zip (14 KB)Acknowledgments
For their roles in various aspects of the study, we thank the following: John Turlington, Halley Brantley, Carol Ann Gross-Davis, Howard Schmidt, and Ron Landy, all from EPA. We also thank Elsy Escobar, M. Shahrooz Amin, Mark Modrak, and David Nash with Arcadis for their contributions to this project. Finally, we thank Jason Weinstein and Kasey Kovalcik of EPA for technical review of the paper.
Supplemental Material
Supplemental data for this paper can be accessed on the publisher’s Web site.
Additional information
Funding
Notes on contributors
Shaibal Mukerjee
Shaibal Mukerjee and Donald A. Whitaker are Research Physical Scientists and Karen D. Oliver and Maribel Colon are Research Chemists, all at EPA’s Office of Research & Development (ORD), National Exposure Research Laboratory (NERL).
Luther A. Smith
Luther A. Smith is a Senior Statistician and Casson Stallings is a data analyst and environmental modeler with Alion Science & Technology.
Tai Wu
Eben D. Thoma and Tai Wu are Physical Scientists with EPA/ORD’s National Risk Management Research Laboratory.
Lillian Alston
Lillian Alston is a scientist working with EPA/ORD/NERL through the NCBA/SEE Program. Tamira A. Cousett is a Chemist currently with Jacobs Technology.
References
- Eisele, A.P., S. Mukerjee, L.A. Smith, E.D. Thoma, D. Whitaker, K. Oliver, T. Wu, M. Colon, L. Alston, T. Cousett, M.C. Miller, D.M. Smith, and C. Stallings. 2016. Volatile organic compounds at two oil and natural gas production well pads in Colorado and Texas using passive samplers. J. Air Waste Manage. Assoc. doi:10.1080/10962247.2016.1141808.
- Goodman, L.A., 1965. On simultaneous confidence intervals for multinomial proportions, Technometrics 7:247–254. doi:10.1080/00401706.1965.10490252
- Hollander, M., and D.A. Wolfe, 1999. Nonparametric Statistical Methods, 2nd ed., 35, 125. New York: Wiley.
- Kondo, M.C., C.A. Gross-Davis, K. May, L.O. Davis, T. Johnson, M. Mallard, A. Gabbadon, C. Sherrod, and C.C. Branas, 2014, Place-based stressors associated with industry and air pollution. Health Place 28:31–37. doi:10.1016/j.healthplace.2014.03.004
- Kumar, A., and I. Víden, 2007. Volatile organic compounds: Sampling methods and their worldwide profile in ambient air. Environ. Monit. Assess. 131:301–321. doi:10.1007/s10661-006-9477-1
- Martin, N.A., P. Duckworth, M.H. Henderson, N.R.W. Swann, S.T. Granshaw, R.P. Lipscombe, and B.A. Goody, 2005. Measurements of environmental 1,3-butadiene with pumped and diffusive samplers using the sorbent Carbopack X. Atmos. Environ. 39:1069–1077. doi:10.1016/j.atmosenv.2004.09.078
- McClenny, W.A., K.D. Oliver, H.H. Jacumin, E.H. Daughtrey, and D.A. Whitaker, 2005. 24 h diffusive sampling of toxic VOCs in air onto Carbopack X solid adsorbent followed by thermal desorption/GC/MS analysis—Laboratory studies. J. Environ. Monit. 7:248–256. doi:10.1039/b412213e
- McClenny, W.A., K.D. Oliver, H.H. Jacumin, E.H. Daughtrey, and D.A. Whitaker, 2006. Comparison of 24 h averaged VOC monitoring results for residential indoor and outdoor air using Carbopack X-filled diffusive samplers and active sampling—A pilot study. J. Environ. Monit. 8:263–269. doi:10.1039/B507850D
- Mukerjee, S., K.D. Oliver, R.D. Seila, H.H. Jacumin, C. Croghan, H. Daughtrey, L.M. Neas, and L.A. Smith, 2009. Field comparison of passive air samplers with reference monitors for ambient volatile organic compounds and nitrogen dioxide under week-long integrals. J. Environ. Monit. 11:220–227. doi:10.1039/B809588D
- Partyka, M., B. Zabiegała, J. Namieśnik, and A. Przyjazny, 2007. Application of passive samplers in monitoring of organic constituents of air. Crit. Rev. Anal. Chem. 37:51–78. doi:10.1080/10408340600976523
- Quesenberry, C.P., and D.C. Hurst, 1964, Large sample simultaneous confidence intervals for multinomial proportions, Technometrics 6:191–195. doi:10.1080/00401706.1964.10490163
- SAS. 2004. SAS/STAT® 9.1 User’s Guide, 3143–3162. Cary, NC: SAS Institute.
- Smith, L.A., S. Mukerjee, K.C. Chung, and J. Afghani, 2011. Spatial analysis and land use regression of VOCs and NO2 in Dallas, Texas during two seasons. J. Environ. Monit. 13:999–1007. doi:10.1039/c0em00724b
- Thoma, E.D., W. Jiao, H.L. Brantley, T. Wu, W.C. Squier, B. Mitchell, K.D. Oliver, D.A. Whitaker, S. Mukerjee, C.A. Gross-Davis, H. Schmidt, R. Landy, J. DeWees, R. Merrill, R. Segall, A. Diem, B. Shine, E. Escobar, M.S. Amin, and M. Modrak. 2015. South Philadelphia passive sampler and sensor study: Interim report. Proceedings of the 108th Annual Conference of the Air & Waste Management Association, June 23–26, Raleigh, NC.
- Thoma, E.D., M.C. Miller, K.C. Chung, N.L. Parsons, and B.C. Shine, 2011. Facility fence-line monitoring using passive sampling. J. Air Waste Manage. Assoc. 61:834–842.doi:10.3155/1047-3289.61.8.834
- U.S. Environmental Protection Agency. 2015a. Method 325A—Volatile Organic Compounds from Fugitive and Area Sources: Sampler Deployment and VOC Sample Collection. 40 CFR Part 63, Subpart UUU [EPA-HQ-OAR-2010-0682; FRL-9720-4], RIN 2060-AQ75, Petroleum Refinery Sector Risk and Technology Review and New Source Performance Standards. Available at http://www3.epa.gov/ttn/emc/promgate/m-325a.pdf ( accessed January 2016).
- U.S. Environmental Protection Agency. 2015b. Method 325B—Volatile Organic Compounds from Fugitive and Area Sources: Sampler Preparation and Analysis. 40 CFR Part 63, Subpart UUU [EPA-HQ-OAR-2010-0682; FRL-9720-4], RIN 2060-AQ75, Petroleum Refinery Sector Risk and Technology Review and New Source Performance Standards. Available at http://www3.epa.gov/ttn/emc/promgate/m-325b.pdf ( accessed January 2016).