
ABSTRACT
Landfills throughout the world are contributing to the global warming problem. This is due to the existence of the most important greenhouse gases (GHG) in landfill gas (LFG); namely, methane (CH4) and carbon dioxide (CO2). The aim of this paper is quantifying the total potential emissions, as well as the variation in production with time of CH4 from a proposed landfill (El Fukhary landfill) in the Gaza Strip, Palestine. Two different methods were adopted in order to quantify the total potential CH4 emissions; the Default methodology based on the intergovernmental panel on climate change (IPCC) 1996 revised guidelines and the Landfill Gas Emissions model (LandGEM V3.02) provided by the United States Environmental Protection Agency (EPA). The second objective of the study has been accomplished using the Triangle gas production model. The results obtained from both Default and LandGEM methods were found to be nearly the same. For 25 years of disposing MSW, El Fukhary landfill expected to have potential CH4 emissions of 1.9542 ± 0.0037 ×10⁹ m3. Triangle model showed that the peak production in term of CH4 would occur in 2043; 28 years beyond the open year. Moreover, the model shows that 50 % of the gas will be produced approximately at the middle of the total duration of gas production. Proper control of Methane emissions from El Fukhary landfill is highly suggested in order to reduce the harmful effects on the environment.
Implications: Although, GHG emissions are extensively discussed in the developed countries throughout the world, it has gained little concern in the developing countries because they are forced most of the time to put environmental concerns at the end of their priority list. The paper shows that developing countries have to start recognizing their fault and change their way of dealing with environmental issues especially GHG emissions (mainly Methane and carbon dioxide). The authors estimated the potential methane emissions from a proposed central landfill that has been approved to be built in Palestine, a country that is classified as a developing country.
Introduction
In the late 1980s, the world started to recognize several global air pollution problems that induce transboundary environmental hazards and negatively affect other areas far away from the origin of the air pollution source. Examples that fall under this category are global warming, acid rain, and destruction of the ozone layer by chlorofluorocarbons (de Nevers, Citation2010). Among these examples, global warming is gaining more and more interest and has been the focus of discussion among scientists. Global warming is caused mainly due to the increase in greenhouse gases (GHG) concentration in the atmosphere. Collectively, methane (CH4), carbon dioxide (CO2), nitrous oxide (N2O), and chlorofluorocarbons (CFCs) are called greenhouse gases (Hardy, Citation2003). These gases trap the heat of the sun near the earth’s surface, causing the temperature rise to levels harmful to humans, plants, animals, and the environment (Chauhan et al., Citation2014; de Nevers, Citation2010; Dhillon and von Wuehlisch, Citation2013; Galdos et al., Citation2013). CH4 has a global warming potential (GWP) more than 20 times that of CO2 (Johari et al., Citation2012; Oh et al., Citation2010), and has an atmospheric residence time of 12 ± 3 years (A. Kumar and Sharma, Citation2014). Many studies have connected CH4 to approximately 20% of the greenhouse effect (Noor et al., Citation2013); others say that the increase in CH4 concentration in the atmosphere is in the range of 1–2% per year (S. Kumar et al., Citation2004).
shows the global participation in increasing CH4 concentration from many sources in 2000. Human activities produce more than 60% of the total CH4 emissions (EPA, Citation2010). Of these activities, solid waste (SW) landfilling is recognized as one of the major sources of anthropogenic CH4 emissions; hence, it has become an important contributor to global warming (S. Kumar et al., Citation2004) and should be managed properly.
Figure 1. Global anthropogenic CH4 in 2000 (Themelis and Ulloa, Citation2007).
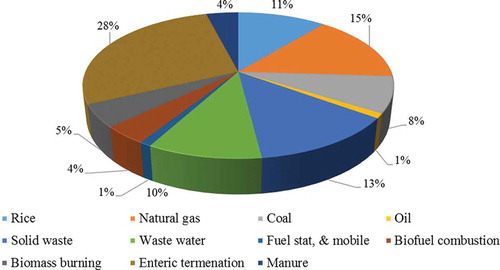
With 40 million metric ton per year (Aljaradin and Persson, Citation2012), landfills worldwide are responsible for more than 10% of the total anthropogenic CH4 emissions (Al-Ghazawi and Abdulla, Citation2008; Tercan et al., Citation2015; Zhu et al., Citation2013). Landfilling is found as the cheapest solid waste management method to deal with 80% of the municipal solid waste (MSW) all over the world (AbdAlqader and Hamad, Citation2012; A. Kumar and Sharma, Citation2014; Yang et al., Citation2015). The organic fraction of MSW undergoes anaerobic microbial decomposition inside landfills. Consequently, a huge amount of gas widely known as landfill gas (LFG) will be generated. LFG mainly consists of CH4, CO2, and other hazardous trace gases, comprising 45–60, 40–60, and 0.01–0.5%, respectively (EPA, Citation1996, Citation2011; Tchobanoglous et al., Citation1993). LFG production is affected by various parameters such as climatic conditions and refuse characteristics (El-Fadel et al., Citation1997).
The first step in controlling and managing CH4 emissions from landfills is to determine the quantity of emissions being emitted. For the purpose of estimating CH4 emissions from landfills, many numerical and mathematical models have been developed worldwide. For instance, the United States Environmental Protection Agency (EPA) has constructed the LandGEM model (Alexander et al., Citation2005), while the Intergovernmental Panel on Climate Change (IPCC) has introduced the default methodology in its 1996 revised guidelines (IPCC and Houghton, 1996). In the same context, Tchobanoglous et al. (Citation1993) have established the triangular gas production model (Tchobanoglous et al., Citation1993). The LandGEM tool has been used by many researchers (e.g., A. Kumar and Sharma, Citation2014; Amini et al., Citation2013; Chakraborty et al., Citation2013), whereas the IPCC default methodology has been used by others (Heyer et al., Citation2013; Johari et al., Citation2012; Jha et al., Citation2008; S. Kumar et al., Citation2004). The triangular gas production model has been adopted to obtain the variation in CH4 production with time by others (Ambade et al., Citation2014; Chalvatzaki and Lazaridis, Citation2010; Mor et al., Citation2006; S. Kumar et al., Citation2004).
Review of literature indicates that this area of research has not been covered in the Gaza Strip (GS), Palestine; hence, it is expected that this study will pose a great benefit to the stakeholders as well as researchers in that region. Besides estimating the CH4 quantities that would be generated from a proposed sanitary landfill in the GS and could be transferred into different forms of energy such as electric power, this study also helps in designing proper mitigation measures that aim at minimizing GHG emissions into the atmosphere.
Solid waste management practices in the Gaza Strip
The GS is a narrow strip of land located along the eastern Mediterranean coast (United Nations Environment Programme [UNEP], Citation2009). It stretches over a distance of approximately 45 km from the city of Beit Hanoun in the north to Rafah city in the south and is between 6 and 12 km wide with a total area of 365 km2 (AbdAlqader and Hamad, Citation2012; Abufoul et al., Citation2014). For administrative purposes, the GS is divided into five governorates: North, Gaza, Middle, Khan Younis, and Rafah. Each governorate consists of municipalities that vary in numbers depending on the towns or villages and the population of each. The GS includes 40 localities consisting of 16 municipalities, 16 villages, and 8 refugee camps (El Baba and De Smedt, Citation2013).
According to the Palestinian Central Bureau of Statistics (PCBS), the population in GS was 1.75 million in 2012 (Abu-Jasser, Citation2014; Ouda, Citation2013) and is expected to increase to approximately 2.13 million by 2020 (United Nations [UN], Citation2012). The daily waste generation per capita in the GS ranges from 0.9 to 1.2 kg in the urban areas and from 0.5 to 0.8 kg in the rural areas (El Baba and De Smedt, Citation2013; Khatib and Al-Khateeb, Citation2009; Ouda, Citation2013). It is estimated that in 2007 the total solid waste quantities generated from the whole strip exceeded 1,500 tons per day (Municipal Development and Lending Fund [MDLF], 2012), and this is expected to increase to 3,700 tons per day in 2040. Municipalities handle the SW in urban and rural areas, while the United Nations (UN) manages the collection process and the disposal of SW generated in eight refugee camps in the GS. Most of the SW is collected by temporary workers using donkey carts and push carts (El Baba and De Smedt, Citation2013; Ouda, Citation2013).
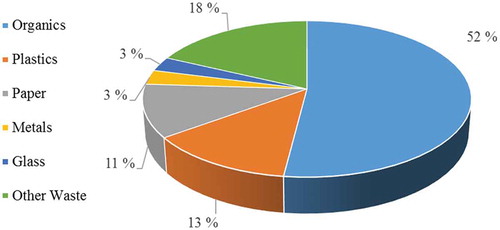
Waste composition is extremely variable as a consequence of seasonal variation, lifestyle, and demographic, geographic, and legislative impacts. This variability makes defining and measuring the composition of SW more difficult and at the same time more essential (AbdAlqader and Hamad, Citation2012). The GS contains cities, villages, and camps with different lifestyles and cultures. Using the methodology and procedures derived from the Standard Test Method for Determination of the Composition of Unprocessed MSW (ASTM D 5231-92), AbdAlqader and Hamad (Citation2012) come up with a conclusion that more than 50% of the MSW in the GS is organic waste (mostly food waste), and the plastic and paper wastes constitute 13% and 11% of the waste stream, respectively (AbdAlqader and Hamad, Citation2012). shows the SW composition in the GS. Other studies (MDLF, 2012) estimated that the organic fraction forms up to 65% of the SW.
Figure 2. Solid waste composition in Gaza Strip (AbdAlqader and Hamad, Citation2012).
The SW management system in the GS is simple and mainly includes collection and disposal of refuse from different sources in unsanitary landfills or open dump sites. Until 2014, three unsanitary landfills were under operations in the GS (AbdAlqader and Hamad, Citation2012; Ouda, Citation2013). Landfill locations are marked in .
Figure 3. Locations of current landfills in the GS.
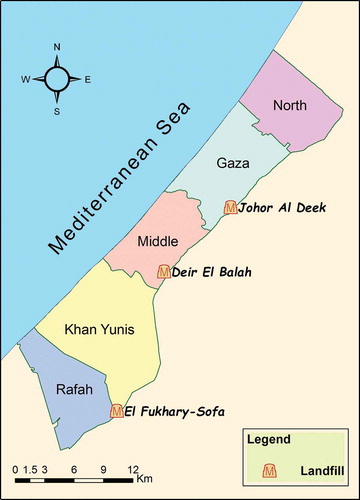
The first landfill (Johr al Deek Landfill), is located in Gaza governorate. It covers at least 14 ha (1 ha = 10,000 m2) and receives about 1000 tons per day of SW from Gaza and Northern governorates. The second landfill (Deir El Balah Landfill), which is located east of Deir El Balah city, covers approximately 6 ha and receives about 300 tons of SW per day from both the Middle governorate and the Khan Younis governorate. El Fukhary-Sofa Landfill is the third landfill and it receives up to 130 tons of SW per day from Rafah governorate. El Fukhary-Sofa Landfill covers approximately 2.7 ha (AbdAlqader and Hamad, Citation2012).
Site description of El Fukhary landfill
Even though the three landfills Johr al Deek, Deir El Balah, and El Fukhary-Sofa reached their capacity many years ago, they are still receiving SW in increasing quantities. To improve this situation, the Gaza Solid Waste Management Project (GSWMP) has been initiated. The project is funded by Government of Japan (GoJ), World Bank (WB), European Union (EU), the Agence Francaise de Developpement (AFD) and the Islamic Development Bank (IsDB). Represented by the Municipal Development and Lending Fund (MDLF), the Palestinian National Authority (PNA) will be taking charge to carry out the project under the supervision of the United Nation Development Program (UNDP).
The GSWMP includes the establishment of a new municipal, nonhazardous landfill at the El Fukhary area in Rafah City with a capacity of approximately 16 million m3 (MDLF, 2012; SWEEP-Net, Citation2014). Up to the end of 2031, El Fukhary landfill will accept SW generated from the GS except Gaza and North governorates, but after that, it will accept all the SW generated in the GS from the five governorates. The open and closure dates for the landfill are the beginning of 2015 and the end of 2040, respectively (SWEEP-Net, Citation2014). shows the annual estimated solid waste quantities that will be disposed of in El Fukhary landfill for the period from 2015 to 2040.
Table 1. Expected annual SW quantities that El Fukhary landfill will receive from 2015 to 2040 (MDLF, 2012).
The landfill will be operated with a separate cells system, and will include a lining system consisting of a double-layer bentonite mat, a 1.5-mm high-density polyethylene (HDPE) layer, and a geotextile layer. A soil cover will be placed and compacted daily on the surface of the SW layer. In addition to the degassing system, the landfill will be facilitated with a leachate collection system. The leachate will be collected in a separate special pond and will be recycled (MDLF, 2012).
This study was conducted to quantify the total potential CH4 emissions from a proposed landfill in the GS, Palestine. The IPCC default methodology based on the IPCC 1996 revised guidelines and the LandGEM V3.02 model provided by EPA were used for this purpose. Then the triangular gas production model was selected in order to fulfill the second objective of the study, which was obtaining the variation in CH4 production with time.
Materials and methods
Three different methods for estimating CH4 quantities from the landfill were used in the study. Those methods are the IPCC default methodology, the LandGEM model, and the triangular gas production model. The first two methods aimed at estimating the total CH4 quantities that would be generated from El Fukhary landfill, whereas the triangular gas production model was used in order to obtain the variation in CH4 production with time.
The IPCC default methodology
The Revised 1996 IPCC guideline for national greenhouse gas inventories (IPCC guidelines) outlines two methods for estimating CH4 emissions from solid waste disposal sites (SWDS): the first order decay (FOD) method and the default methodology (IPCC, Citation2000). As the FOD method is the base of LandGEM model method, it is not described here, and is given a short description in the LandGEM section. The IPCC default methodology was derived first by H. G. Bingemer and P .J. Crutzen in Citation1987 (Bingemer and Crutzen, Citation1987) and has been adopted by IPCC as an accredited method for estimation of potential CH4 quantities from SWDS. The IPCC default methodology assumes that all the potential CH4 from the SW is released in the year the waste is placed in the SWDS. Among other methodologies, this one is considered the simplest. Equation 1 shows all the parameters that the method depends on:
where MSWT is the annual total municipal solid waste generated from a community in Gg; MSWF the municipal solid waste disposed of in SWDS (fraction); MCF the methane correction factor (fraction); DOC the degradable organic carbon (fraction); DOCF the fraction of DOC that can be decomposed; F is the volume fraction of CH4 in the generated landfill gas; (16/12) is the molecular weight ratio of CH4 to carbon; R is recovered CH4 in year T in Gg per year; and OX is an oxidation factor in year T (fraction) (Houghton, Citation1997; IPCC and Houghton, Citation1996). Equation 1 can also be written as eq 2:
where, Lo (Gg CH4 /Gg waste) is known as the CH4 generation potential. Lo can be calculated using eq 3 (IPCC, Citation2000). This value generally describes the total amount of CH4 that could ultimately be produced per unit mass of waste (Amini et al., Citation2013). Lo is primarily connected with waste composition:
By multiplying MSWT with MSWF, the annual total municipal solid waste disposed to El Fukhary landfill was obtained; these values are given in . The other parameters in eq 1 are presented in .
Table 2. Input parameters for the IPCC default methodology.
Depending on many factors, including the controlled placement of SW in the landfill and the use of cover materials at the site, El Fukhary landfill is classified as managed SWDS; hence, the MCF equals 1 (IPCC, Citation2006). MCF was set as 1 by (Abdulla and Al-Ghazzawi, Citation2000; Scarlat et al., Citation2015). Due to the lack of detailed data on the composition of the SW in the GS, the DOC value was taken as the same value as for Jordan, which is the country just next to Palestine and its waste stream has similar characteristics (Aljaradin and Persson, Citation2012). Based on the compositions of the solid waste in Jordan, a DOC value of 0.25 has been estimated (Al-Ghazawi and Abdulla, Citation2008). For the DOCF, the IPCC has concluded that 77% of the organic carbon is available for depredation. Following the IPCC guidelines, the oxidation factor was used as 0.10 (Kim and Yi, Citation2009; Mohareb et al., Citation2011; Oonk, Citation2012). This 10% of CH4 is oxidized in the soil in the top layers of landfills. The recovered CH4 amount was set to zero, as the aim of this study was to estimate the CH4 inventory for El Fukhary landfill. The proportion of CH4 volume in the landfill gas was taken as half, according to Tchobanoglous et al. (Citation1993).
LandGEM model methods
The LandGEM model is an automated estimation tool with Microsoft Excel interface. It is based on the FOD model as given in eq 4:
where is the annual CH4 emissions in the year of the calculation (m3/year); i and j are model indices; n is the duration of waste acceptance at landfill and equals the year of the calculation minus the initial year of waste acceptance; k is the CH4 generation rate constant (year−1); Lo is the CH4 potential generation capacity (m3/Mg waste); Mi is the mass of waste accepted in the ith year (Mg); and tij is the age of the jth section of waste mass Mi accepted in the ith year (IPCC, Citation2006). summarizes inputs for the model.
Table 3. El Fukhary landfill input values for LandGEM model.
The LandGEM model aims to estimate emission rates for the total landfill gas, methane, carbon dioxide, nonmethane organic compounds (NMOCs), and individual air pollutants from municipal SW landfills (Alexander et al., Citation2005). The model was developed by the EPA. Along with its ability to estimate the total quantities of different gases, LandGEM is also able to provide variation in production of these gases with time. The model assumed that the resulted gas from decomposition process will continue up to more than hundreds of years beyond SW landfills closure.
The value of CH4 generation rate (k) was taken as for tropical (mean annual temperature >20ºC) and dry areas (mean annual precipitation < 1000 mm/year) (IPCC, Citation2006). The GS mean annual temperature and precipitation were 20.5°C and 450 mm/year, respectively (PWA, Citation2013). Lo value was computed using eq 3. Lo and k values used in this work were compared with other relevant studies ().
Table 4. Comparison with related Malaysian and international studies.
Triangular gas production model
Even though the LandGEM model provides variation in gas production with time, the triangular gas production model has been selected, as the LandGEM model requires gas production data for a long duration. Moreover, the LandGEM model does not distinguish between rapid and slow biodegradable organics.
CH4 emissions, calculated using the IPCC default and the LandGEM models, were averaged and used as inputs for the triangular gas production model(according to A. Kumar and Sharma, Citation2014; S. Kumar et al., Citation2004; Mor et al., Citation2006). The triangular gas production model was developed by Tchobanoglous et al. (Citation1993). In this model, a linear growth of the LFG production rate is assumed until it reaches a peak, after which a linear decrement starts (). The area under the triangle equals the generated amount of LFG from the waste that has been placed in a landfill.
The area under the triangle is equal to one-half the base (the time in which LFG production lasts) multiplied by the altitude (the peak rate of LFG production) (Tchobanoglous et al., Citation1993). Therefore, total amount of gas produced from amount Ri of waste placed in a landfill at year i can be computed using eq 5 as follows:
Figure 4. Triangular gas production model distribution of LFG production rate (Velinni, Citation2007).
where Lo is the potential gas production (m3/t) from a solid waste; tend,i the time during which gas production take place (year); to,i the time at which LFG production starts from waste that has been placed at year i (year); QLFG,i,max the maximum gas production rate (m3/(t × year)); and Ri the amount of waste placed in landfill at year i (t) (Velinni, Citation2007).
The triangular gas production model classifies both the rapid and slow degradable organics fractions of MSW. Rapidly biodegradable organics (food waste, paper, cardboard, leaves and grass trimmings) get decomposed within few days after being placed in landfills and take up to 5 years for complete decomposition. On the other side, the slowly biodegradable organics (textile, leather, rubber, and wood) begin decomposing about 5 years after they get buried in a landfill and may last up to 50 years (Tchobanoglous et al., Citation1993). The model assumed that gas production starts at the end of first full year of landfill operation, and peak rates of gas production for rapid and slow biodegradable organics occur at 1 and 5 years, respectively, after gas production starts (Tchobanoglous et al., Citation1993; Velinni, Citation2007).
Due to a lack of detailed data on percentages of slow and rapid biodegradable organics in the solid waste stream, and hence, K and Lo for each type being unknown, the organic waste was assumed as slowly biodegradable organics. It is assumed that the waste needs 25 years for complete decomposition (EPA, Citation1996; Tchobanoglous et al., Citation1993) and the peak gas production would occur after 5 years of solid waste placement in the landfill.
Results and discussion
Landfills are widely used for solid waste disposal as they are a simple and cheap method compared to the other disposal methods such as incinerators or material recovery facilities (MRF). Depending on many parameters including organic content in SW, moisture content, and the initial compactions of SW, GHG would be generated as a result of anaerobic microbial decomposition. Especially in developing countries where unsanitary landfills are being widely used, GHG get emitted from landfills to the atmosphere, posing threat to the environment. Therefore, GHG emissions from SW landfills should be controlled and utilized effectively. Usually, LFG control systems start with quantifying GHG emissions first.
Estimation of total potential methane emissions
The total potential CH4 emissions from approximately 16 million m3 of MSW that will be disposed of in the El Fukhary landfill over 26 years are shown in . The emissions were computed using the IPCC default and the LandGEM models. shows that the El Fukhary landfill is expected to have 3.8294 ± 0.0556 × 10⁹ m3 of CH4 emissions. The values obtained from the two methods are in reasonable agreement with difference of 2.07% and therefore reliability of the results can be assured. The values estimated by the models show the volume of methane gas should be captured or utilized as source of energy in order to save the environment. Up to the year 2001, there were approximately 955 landfills throughout the world that recovered landfill gas (Themelis and Ulloa, Citation2007).
Table 5. Total CH4 volume generated from El Fukhary landfill.
The IPCC default methodology suggested that CH4 emissions will start in the first year of waste disposal into the landfill and will continue up to the year 2040. On the other hand, the LandGEM model showed that no emissions will be monitored in 2015; however, this will start in 2016. The LandGEM model illustrated that CH4 emissions are expected to continue up to 2155, 115 years after the closure of the landfill. In addition to CH4 gas, landfill gases usually contain approximately 0.5% of trace hazardous compounds including hydrogen sulfide, benzene, toluene, and argon (Giess et al., Citation1999; Zietsman et al., Citation2008). Hence, the El Fukhary landfill is expected to emit almost 3.8294 ± 0.0566 × 10⁷ m3 from disposed waste.
A. Kumar and Sharma (Citation2014) estimated methane emissions from Okhla landfill using the LandGEM model. The result was 7.3 Gg/year (A. Kumar and Sharma, Citation2014), which is only 2.6% lower than the value obtained by Chakraborty using the IPCC default methodology (Chakraborty et al., Citation2013) for the same landfill (7.5 Gg/year).
The value of Lo for the El Fukhary landfill equals 0.128 Gg CH4/Gg waste. This means that potential CH4 emissions of each Gg unit of MSW disposed of in the landfill and decomposed anaerobically equal 0.128 Gg unit. Because all the variables that control CH4 production are included in the Lo value and recovered CH4 value is set as zero, Lo becomes the only variable that determine CH4 production. Therefore, correlation between MSW quantities and CH4 emissions is linear and has the slope of 0.9 × Lo value. shows the annual CH4 emissions in the landfill from 2015 to 2040 using the IPCC default methodology.
Figure 5. Annual CH4 emissions from El Fukhary landfill from 2015 to 2040.
Relation between SW quantities and CH4 emissions is directly proportional. illustrates that CH4 emissions increase from 2015 to 2040. This is mainly due to yearly increase of SW quantities being dumped in the site. The sharp increase in CH4 emissions in 2032 is due to receiving solid waste from two additional governorates in the Gaza Strip. Starting in 2032, the El Fukhary landfill will be the main destination for all solid waste produced in the Gaza Strip.
The GWP was developed to compare the global warming impacts of different gases. More specifically, it measures how much energy GHG will absorb over a specified period of time, relative to the amount of energy absorbed by a similar mass of CO2 (Holtsmark, Citation2015). CH4 is estimated to have GWP of 72 and 25 over 20 and 100 years, respectively. According to the IPCC, the absolute GWP values of CO2 for the 20- and 100-year time horizon are 2.47 × 10⁻¹⁴ and 8.69 × 10⁻¹⁴ W m−2 year per 1 kg of CO2 (Solomon, Citation2007). Hence, 1 ton of CH4 has a GWP of 3.2184 × 10⁻⁹ and 2.1725 × 10⁻⁹ W m−2 year for the 20- and 100-year time horizon, respectively. The results estimated that approximately 2716.73 × 103 tons of methane will be generated from all the solid waste that will be dumped in the El Fukhary landfill. Therefore, total GWP of the El Fukhary landfill will be 8.74 × 10⁻³ W m−2 year for the 20-year timescale and 5.90 × 10⁻³ W m−2 year for the 100-year timescale.
Variation in methane production with time
The yearly CH4 production has been calculated using the triangular model. shows the concept of method used for the waste disposed of in the landfill in 2015.
Figure 6. Variation in CH4 production with time from 2015 to 2040 for the waste placed in 2015.
As shown in , gas production starts in 2016, 1 year after the placement of solid waste in the landfill. In early years of landfill operations, aerobic decomposition usually takes place due to availability of oxygen gas in the landfill cells.
The triangular model assumed that decomposition of all the biodegradable organic content of the SW takes 25 years, and after these years either no organics will remain or the leftover organics cannot be decomposed biologically (Tchobanoglous et al., Citation1993). The high rate of gas production during the first 5 years is due to availability of rapidly decomposed organics. The United Nations Development Program (UNDP) revealed that the percentage of organic waste in the solid waste of the Gaza Strip can go up to 60%, and food wastes are the main proportion of these organics (MDLF, 2012). The scenario illustrated in occurs for all SW quantities being placed in the landfill each year.
shows the variations in CH4 production for the total waste disposed of in the landfill. It can be seen that CH4 emissions will start in 2016 and will last into 2065. Year 2043 records the peak value of CH4 production of approximately 196,964,800 cubic meters. Although the LandGEM model has different gas production duration, it has shown close estimation with the result of the triangular gas production model in terms of the year that records the peak gas production. illustrates that the peak CH4 production would occur in 2041, only 2 years earlier than the triangular gas production model estimation.
Figure 7. Triangular model results of variation in CH4 production with time from 2015 to 2065.
Figure 8. LandGEM results of variation in LFG, CH4, and CO2 production with time from 2016 to 2155.
The triangular gas production model showed that approximately 90 % of the gas would be produced in the first 40 years of the total duration. In addition, 38% of the gas will be produced while the landfill is in operation, and the remaining 62% will need up to 25 years after closure of the landfill. The sudden increase in CH4 emissions after 2032 is the result of a high increase in the waste quantities being sent to the landfill. This meaningful increase is mainly due to the diversion of all the GS MSW to El Fukhary landfill starting from 2032. The time-series gas production of CH4 obtained using LandGEM is presented in .
According to LandGEM results, more than 95% of the gas will be produced within 66 years (~2080) after opening of the landfill. The model also showed that the amount of gas produced within the last 70 years represents only 3% of total CH4 emission. Comparing with the triangular gas production model, approximately 87% of the gas would be produced by 2065. LandGEM estimated that CH4 peak production would occur 27 years after the start of LFG generation, which is in agreement with the results obtained by other researchers (A. Kumar and Sharma, Citation2014). presents a summary of results obtained by the IPCC default methodology, the triangular gas production model, and the LandGEM model.
Table 6. Results summary of the three models.
It is clearly seen in that even though the default methodology, the triangular gas production model, and the LandGEM model each assumed a different period for CH4 production, they calculated close estimations of how much CH4 would be generated from the El Fukhary landfill. This is due to the fact that each model assumed a different decomposition rate for the biodegradable organic wastes. Similarly, the previous models have shown close prediction of the year in which peak CH4 generation would occur. It should be highlighted that previous models usually have dealt with CH4 quantities estimation produced inside landfill as a result of the anaerobic decomposition of the biodegradable organic fraction of SW. The percentage of CH4 quantities that would be captured and prevented from being emitted into the atmosphere basically depends on the efficiency of the proposed LFG collection system.
Conclusion
Rapid increase in population, changes in lifestyle, and large consumption of goods cause an increase in solid waste generation. This will resulted in health hazards (e.g., growth of microbial pathogens), economic (e.g., transportation) costs, and environmental threats (e.g., soil contamination). In the Gaza Strip, the solid waste generated used to be disposed of in unsanitary landfills. The El Fukhary landfill will be the first sanitary landfill in the area that is planned to be facilitated with an LFG control system. Either for quantifying the risk of GHG (mainly CH4 and CO2) that would emerge from El Fukhary landfill on the atmosphere or for evaluating the efficiency of recovering and utilizing of GHG, the amount of GHG must be approximated. The study showed that the potential CH4 emission would be about 1.9542 × 10⁹ m3 and gas generation would continue for 25 years after the closure of the landfill. These amounts of GHG should be removed or utilized properly for electricity generation.
Funding
The GSWMP will be funded by Government of Japan (GoJ), World Bank (WB), European Union (EU), the Agence Francaise de Developpement (AFD), and the Islamic Development Bank (IsDB). The analysis and interpretation of the El Fukhary landfill data have been supported by Universiti Teknologi PETRONAS (UTP). Many thanks to Samir Matar for his assistance in providing valuable information.
Additional information
Funding
Notes on contributors
Motasem S. Abualqumboz
Motasem S. Abualqumboz is a postgraduate student enrolled in a master of science by research degree at Universiti Teknologi PETRONAS (UTP), Department of Civil and Environmental Engineering.
Amirhossein Malakahmad
Amirhossein Malakahmad is an associate professor at Universiti Teknologi PETRONAS (UTP), Department of Civil and Environmental Engineering.
Nurul Izma Mohammed
Nurul Izma Mohammed is a senior lecturer at Universiti Teknologi PETRONAS (UTP), Department of Civil and Environmental Engineering.
References
- AbdAlqader, A., and J. Hamad. 2012. Municipal solid waste composition determination supporting the integrated solid waste management in Gaza Strip. Int. J. Environ. Sci. Dev. 3(2): 172–77. doi:10.7763/IJESD.2012.V3.210
- Abdulla, F.A., and Z.D. Al-Ghazzawi. 2000. Methane emissions from domestic waste management facilities in Jordan—Applicability of IPCC methodology. J. Air Waste Manage. Assoc. 50(2): 234–39. doi:10.1080/10473289.2000.10464011
- Abu-Jasser, A. 2014. Energy content in municipal reject materials in Rafah Governorate–Palestine. J. Appl. Sci. Environ. Sanit. 9(1): 51–56
- Abufoul, A.M., R.Y. Alkhatib, M.S. Abualqumboz, and T.J. AbuNamaJ. 2014. Effects of Irrigation with treated wastewater on the physical properties and chemical composition of white corn. IUG J. Nat. Eng. Stud. 22(1): 77–96
- Abushammala, M.F.M., N.E.A. Basri, H. Basri, A.A.H. Kadhum, and A.H. El-Shafie. 2012. Methane and carbon dioxide emissions from Sungai Sedu open dumping during wet season in Malaysia. Ecol. Eng. 49(0): 254–63. doi:10.1016/j.ecoleng.2012.08.013
- Al-Ghazawi, Z., and F. Abdulla. 2008. Mitigation of methane emissions from sanitary landfills and sewage treatment plants in Jordan. Clean Technol. Environ. Policy 10(4): 341–50. doi:10.1007/s10098-008-0145-8
- Alexander, A., C. Burklin, and A. Singleton. 2005. Landfill Gas Emissions Model (LandGEM) Version 3.02 User’s Guide. Washington, DC: EPA.
- Aljaradin, M., and Persson, K. M. 2012. Environmental impact of municipal solid waste landfills in semi-arid climates—Case study—Jordan. Open Waste Manage. J. 5(1): 28–39. doi:10.2174/1876400201205010028
- Ambade, B.R., S. Sharma, Y. Sharma, and Y. Sharma. 2014. Assessment of landfill gas and methane emission at Keru landfill site, Jodhpur (India). Int. J. Environ. Eng. 6(2): 239–47. doi:10.1504/IJEE.2014.062159
- Amini, H.R., D.R. Reinhart, and A. Niskanen. 2013. Comparison of first-order-decay modeled and actual field measured municipal solid waste landfill methane data. Waste Manage. 33(12): 2720–28. doi:10.1016/j.wasman.2013.07.025
- Bingemer, H.G., and P.J. Crutzen. 1987. The production of methane from solid wastes. J. Geophys. Res. Atmos. (1984–2012) 92(D2): 2181–87. doi:10.1029/JD092iD02p02181
- Chakraborty, M., C. Sharma, J. Pandey, and P.K. Gupta. 2013. Assessment of energy generation potentials of MSW in Delhi under different technological options. Energy Convers. Manage. 75: 249–55. doi:10.1016/j.enconman.2013.06.027
- Chalvatzaki, E., and M. Lazaridis. 2010. Estimation of greenhouse gas emissions from landfills: application to the Akrotiri landfill site (Chania, Greece). Global NEST 12(1): 108–16. doi:10.1177/0734242X09353060
- Chauhan, B.S., K. Prabhjyot, G. Mahajan, R.K. Randhawa, H. Singh, and M.S. Kang. 2014. Global warming and its possible impact on agriculture in India. In Advances in Agronomy, ed. L.S. Donald, vol. 123, 65–121. St. Louis, MO: Academic Press.
- de Nevers, N. 2010. Air Pollution Control Engineering, 2nd ed. Long Grove, IL: Waveland Press.
- Dhillon, R.S., and G. von Wuehlisch. 2013. Mitigation of global warming through renewable biomass. Biomass Bioenergy 48: 75–89. doi:10.1016/j.biombioe.2012.11.005
- El Baba, M.Y., and F. De Smedt. 2013, January. Solid Waste Management and Practices in Gaza Strip (Palestine). Paper presented at the 6th International Perspective on Water Resources & Environment, Izmir, Turkey.
- El-Fadel, M., A.N. Findikakis, and J.O. Leckie. 1997. Environmental impacts of solid waste landfilling. J. Environ. Manage. 50(1): 1–25. doi:10.1006/jema.1995.0131
- EPA. 1996. Turning a Liability into an Asset: A Landfill Gas-to-energy Project Development Handbook. Washington, DC: EPA.
- EPA. 2010. Methane and Nitrous Oxide Emissions From Natural Sources. Washington, DC: EPA.
- EPA. 2011. Available and Emerging Technologies for Reducing Greenhouse Gas Emissions from Municipal Solid Waste Landfills. Washington, DC: EPA.
- Galdos, M., O. Cavalett, J.E.A. Seabra, L.A.H. Nogueira, and A. Bonomi. 2013. Trends in global warming and human health impacts related to Brazilian sugarcane ethanol production considering black carbon emissions. Appl. Energy 104: 576–82. doi:10.1016/j.apenergy.2012.11.002
- Giess, P., A. Bush, and M. Dye. 1999. Trace gas measurements in landfill gas from closed landfill sites. Int. J. Environ. Stud. 57(1): 65–77. doi:10.1080/00207239908711256
- Hardy, J.T. 2003. Climate Change: Causes, Effects, and Solutions. Hoboken, NJ: John Wiley & Sons.
- Heyer, K.U., K. Hupe, and R. Stegmann. 2013. Methane emissions from MBT landfills. Waste Manage. 33(9): 1853–60. doi:10.1016/j.wasman.2013.05.012
- Holtsmark, B. 2015. Quantifying the global warming potential of CO2 emissions from wood fuels. GCB Bioenergy 7(2): 195–206. doi:10.1111/gcbb.12110
- Houghton, J.T. 1997. Revised 1996 IPCC Guidelines for National Greenhouse Gas Inventories. Paris, France: Intergovernmental Panel on Climate Change (IPCC ).
- Intergovernmental Panel on Climate Change. 2000. Good Practice Guidance and Uncertainty Management in National Greenhouse Gas Inventories. Paris, France: Intergovernmental Panel on Climate Change (IPCC).
- Intergovernmental Panel on Climate Change. 2006. IPCC Guidelines for National Greenhouse Gas Inventories. Hayama, Japan: Intergovernmental Panel on Climate Change (IPCC).
- Intergovernmental Panel on Climate Change and J. Houghton. 1996. Revised 1996 IPCC Guidelines for National Greenhouse Gas Inventories: Greenhouse Gas Inventory Reporting Instructions. Paris, France: Organisation for Economic Cooperation and Development (OECD).
- Jha, A.K., C. Sharma, N. Singh, R. Ramesh, R. Purvaja, and R.K. Gupta. 2008. Greenhouse gas emissions from municipal solid waste management in Indian mega-cities: A case study of Chennai landfill sites. Chemosphere 71(4): 750–58. doi:10.1016/j.chemosphere.2007.10.024
- Johari, A., S.I. Ahmed, H. Hashim, H. Alkali, and M. Ramli. 2012. Economic and environmental benefits of landfill gas from municipal solid waste in Malaysia. Renew. Sustain. Energy Rev. 16(5): 2907–12. doi:10.1016/j.rser.2012.02.005
- Khatib, I., and N. Al-Khateeb. 2009. Solid waste treatment opportunities in the Palestinian authority areas. Waste Manage. 29(5): 1680–84. doi:10.1016/j.wasman.2008.10.022
- Kim, H.-S., and S.-M. Yi. 2009. Methane emission estimation from landfills in Korea (1978–2004): Quantitative assessment of a new approach. J. Air Waste Manage. Assoc. 59(1): 70–77. doi:10.3155/1047-3289.59.1.70
- Kumar, A., and M.P. Sharma. 2014. Estimation of GHG emission and energy recovery potential from MSW landfill sites. Sustain. Energy Technol. Assess. 5: 50–61. doi:10.1016/j.seta.2013.11.004
- Kumar, S., S.A. Gaikwad, A.V. Shekdar, P.S. Kshirsagar, and R.N. Singh. 2004. Estimation method for national methane emission from solid waste landfills. Atmos. Environ. 38(21): 3481–87. doi:10.1016/j.atmosenv.2004.02.057
- Municipal Development and Lending Fund. 2012. Environmental and Social Impact Assessment (ESIA) for Gaza Solid Waste Management Project. Gaza, Palestine: Municipal Development and Lending Fund.
- Mohareb, E.A., H.L. MacLean, and C.A. Kennedy. 2011. Greenhouse gas emissions from waste management—Assessment of quantification methods. J. Air Waste Manage. Assoc. 61(5): 480–93. doi:10.3155/1047-3289.61.5.480
- Mor, S., K. Ravindra, A. De Visscher, R.P. Dahiya, and A. Chandra. 2006. Municipal solid waste characterization and its assessment for potential methane generation: A case study. Sci. Total Environ. 371(1–3): 1–10. doi:10.1016/j.scitotenv.2006.04.014
- Noor, Z.Z., R.O. Yusuf, A.H. Abba, M.A. Abu Hassan, and M.F. Mohd Din. 2013. An overview for energy recovery from municipal solid wastes (MSW) in Malaysia scenario. Renew. Sustain. Energy Rev. 20: 378–84. doi:10.1016/j.rser.2012.11.050
- Oh, T.H., S.Y. Pang, and S.C. Chua. 2010. Energy policy and alternative energy in Malaysia: Issues and challenges for sustainable growth. Renew. Sustain. Energy Rev. 14(4): 1241–52. doi:10.1016/j.rser.2009.12.003
- Oonk, H. 2012. Efficiency of landfill gas collection for methane emission reduction. Greenhouse Gas Measure. Manage. 2(2–3): 129–45. doi:10.1080/20430779.2012.730798
- Ouda, O.K. 2013. Assessment of the environmental values of waste-to-energy in the Gaza Strip. Curr. World Environ. 8(3): 355–64. doi:10.12944/CWE.8.3.03
- Palestinian Water Authority. 2013. Water resources in the Occupied State of Palestine—2012. Ramallah, Palestine: Palestinian Water Authority (PWA).
- Scarlat, N., V. Motola, J.F. Dallemand, F. Monforti-Ferrario, and L. Mofor. 2015. Evaluation of energy potential of municipal solid waste from African urban areas. Renew. Sustain. Energy Rev. 50:1269–86. doi:10.1016/j.rser.2015.05.067
- Solomon, S. 2007. Climate Change 2007—The Physical Science Basis. Working Group I Contribution to the Fourth Assessment Report of the IPCC (Vol. 4). Cambridge, UK: Cambridge University Press.
- SWEEP-Net. 2014. Country report on the solid waste management in the occupied Palestinian territory. Tunis, Tunisia: Deutsche Gesellschaft für Internationale Zusammenarbeit (GIZ) GmbH.
- Tchobanoglous, G., H. Theisen, and S. Vigil. 1993. Integrated Solid Waste Management: Engineering Principles and Management Issues. New York, NY: McGraw-Hill.
- Tercan, S.H., A.F. Cabalar, and G. Yaman. 2015. Analysis of a landfill gas to energy system at the municipal solid waste landfill in Gaziantep, Turkey. J. Air Waste Manage. Assoc. 65(8): 912–18. doi:10.1080/10962247.2015.1036178
- Themelis, N.J., and P.A. Ulloa. 2007. Methane generation in landfills. Renew. Energy 32(7): 1243–57. doi:10.1016/j.renene.2006.04.020
- United Nations. 2012. Gaza in 2020 A liveable place?: Jerusalem, Palestine: United Nations.
- United Nations Environment Programme. 2009. Environmental assessment of the Gaza Strip following the escalation of hostilities in December 2008–January 2009. Nairobi, Kenya: United Nations Environment Programme (UNEP).
- Velinni, A.A. 2007. Landfill Research Trends. New York: Nova Science Publishers.
- Yang, L., Z. Chen, X. Zhang, Y. Liu, and Y. Xie. 2015. Comparison study of landfill gas emissions from subtropical landfill with various phases: A case study in Wuhan, China. J. Air Waste Manage. Assoc. 65(8): 980–86. doi:10.1080/10962247.2015.1051605.
- Zhu, H., M.O. Letzel, M. Reiser, M. Kranert, W. Bächlin, and T. Flassak. 2013. A new approach to estimation of methane emission rates from landfills. Waste Manage. 33(12): 2713–19. doi:10.1016/j.wasman.2013.08.027
- Zietsman, J., M.E. Bari, A.J. Rand, B. Gokhale, D. Lord, and S. Kumar. 2008. Feasibility of landfill gas as a liquefied natural gas fuel source for refuse trucks. J. Air Waste Manage. Assoc. 58(5): 613–19. doi:10.3155/1047-3289.58.5.613.