
ABSTRACT
The global demand for water transmission and service pipelines is expected to more than double between 2012 and 2022. This study compared the carbon footprint of the two most common materials used for large-diameter water transmission pipelines, steel pipe (SP) and prestressed concrete cylinder pipe (PCCP). A planned water transmission pipeline in Texas was used as a case study. Four life-cycle phases for each material were considered: material production and pipeline fabrication, pipe transportation to the job site, pipe installation in the trench, and operation of the pipeline. In each phase, the energy consumed and the CO2-equivalent emissions were quantified. It was found that pipe manufacturing consumed a large amount of energy, and thus contributed more than 90% of life cycle carbon emissions for both kinds of pipe. Steel pipe had 64% larger CO2-eq emissions from manufacturing compared to PCCP. For the transportation phase, PCCP consumed more fuel due to its heavy weight, and therefore had larger CO2-eq emissions. Fuel consumption by construction equipment for installation of pipe was found to be similar for steel pipe and PCCP. Overall, steel had a 32% larger footprint due to greater energy used during manufacturing.
Implications: This study compared the carbon footprint of two large-diameter water transmission pipeline materials, steel and prestressed concrete cylinder, considering four life-cycle phases for each. The study provides information that project managers can incorporate into their decision-making process concerning pipeline materials. It also provides information concerning the most important phases of the pipeline life cycle to target for emission reductions.
Introduction
Pipelines provide substantial benefits for modern society, as they are the main source for transport of water to serve our communities. Water pipelines range from just a few inches to more than 20 feet in diameter and supply water over short and long distances via water distribution and water transmission, respectively. In the United States, increasing population and enormous industrial growth are putting increased pressure on aging water transmission pipelines, which will need to be rehabilitated or replaced in the near future. Globally, installation of new water pipelines will be required to serve the 750 million people on earth who currently do not have access to a safe and reliable water supply (Water Organization, Citation2014). The global demand for water transmission and service pipelines, which was 979 million meters in 2012, is expected to more than double to 2000 million meters in 2022. China will account for a large portion of this increase, along with other industrializing countries in Asia, including India and Indonesia, and in Africa and the Middle East (Freedonia Group, Citation2013).
Pipelines impact the environment and carbon emissions in particular, due to various energy-intensive activities, including pipe manufacturing, pipe transportation to the installation site, use of construction equipment during pipe installation, and pipeline operation and maintenance (Filion, Citation2004; Venkatesh and Brattebo, Citation2011). Installation of new water transmission and distribution pipelines presents an opportunity to choose materials, installation techniques, and operation techniques that reduce carbon emissions.
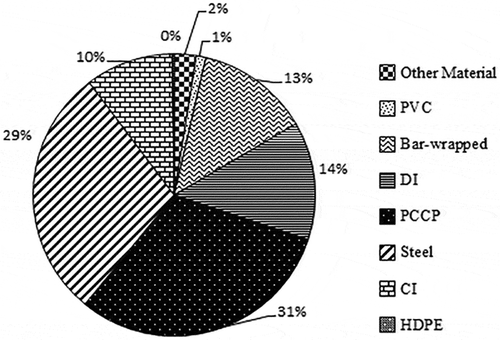
Few studies, however, have been conducted of pipeline carbon emissions. Piratla et al. (Citation2011) estimated life-cycle CO2 emissions from an underground 8-inch-diameter potable water distribution pipeline. The RSK Group quantified the climate impacts associated with the materials acquisition, construction, operation, and final disposal phases of a proposed 48-inch-diameter, 316-km natural gas steel pipeline between Felindre and Tirley, United Kingdom (National Grid, Citation2011). Several studies (Sihabuddin and Ariaratnam, Citation2009; McPherson, Citation2009) in the past have discussed the life-cycle analysis of steel, ductile iron, and plastic pipes; however, they typically did not address energy consumption and CO2 emissions related to large-diameter water transmission pipelines, which are commonly made from steel or prestressed concrete. Plastic pipes are typically only used up to a diameter of 2 feet, and ductile iron up to 4 feet. Steel pipe (SP) and prestressed concrete cylinder pipe (PCCP) diameters can be as large as 12 feet for water arterial mains (Nathanson, Citation2014). shows the pie chart distribution for 21 U.S. water utilities, serving a population of approximately 14 million (CUIRE, Citation2013).
Figure 1. U.S. pipe materials usage (CURIE, 2013).
The objective of the study presented here is thus to compare greenhouse gas emissions associated with the two primary pipe materials used for large-diameter water transmission pipelines, steel pipe and prestressed concrete cylinder pipe. World demand for steel water pipe is expected to more than double from 231 to 503 million meters from 2012 to 2022; similarly, world demand for concrete water pipe is expected to double from 80 to 161 million meters from 2012 to 2022 (Freedonia Group, Citation2013). The carbon footprint comparison of steel pipe and PCCP will provide information that project managers can incorporate into their decision-making process concerning pipeline materials. It will also provide information concerning the most important phases of the pipeline life cycle to target for emission reductions.
Methodology
An ongoing 150-mile water transmission pipeline project, called the Integrated Pipeline (IPL) Project, located in North Central Texas, was used to compare greenhouse gas emissions. The pipeline consists of eight segments A–I of various diameters ranging from 60 inches to 108 inches, as shown later in .
Table 1. Embodied energy coefficients for pipe component materials (Hammond and Jones, Citation2011).
Table 2. Embodied energy and CO2 emissions for pipe segments, steel pipe vs. PCCP.
The pipe diameters, based on hydraulic analysis, were required to be in the range of 66–108 inches. Steel and concrete are the only options for such large-diameter pipes. American Water Works Association (AWWA) pipe design guidelines were used in this study. The AWWA M11 and C200 manual outlined the standard design and manufacturing guidelines for steel pipe (AWWA, Citation2004, Citation2005). AWWA M9, C301, and C304 standards were used for PCCP (AWWA, Citation2007, Citation2008).
Four life-cycle phases for each material were considered in this study: material production and pipeline fabrication, pipe transportation to the job site, pipe installation in the trench, and operation of the pipeline. In each phase, the energy consumed and the CO2 emissions were quantified, for the entire 150 miles of pipeline, and per foot of pipeline (functional unit being foot of pipeline). Each phase is discussed in more detail in the following.
Material production and pipeline fabrication phase
The database entitled Inventory of Carbon and Energy (ICE) version 2.0 was used for this phase (Hammond and Jones, Citation2011). This database provides an embodied energy (MJ/kg) for each construction material. Although ICE contains both embodied energy and carbon data, the embodied energy coefficients are more accurate (Hammond and Jones, 2008). The system boundary in ICE version 2.0 is generally cradle-to-gate, or from resource extraction to the factory gate, before the product is transported to the consumer. The next step in the LCA is transport of the pipeline segments to the installation location. presents the embodied energy coefficients for steel pipe and PCCP components from ICE.
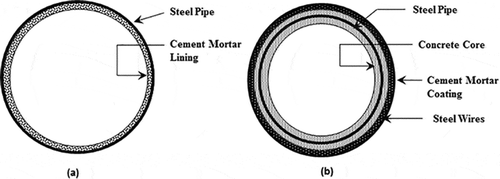
The embodied energy per foot of steel pipe, EE Steel Pipe, was calculated as per eq 1. Pipe cross sections have been provided in to show the presence of various materials.
Figure 2. Pipe cross sections: (a) steel and (b) PCCP.
where EESteel and EECement Mortar are embodied energy coefficients for steel and cement mortar, kWh/lb; and WSteel and WCement Mortar are weight of steel and cement mortar used per foot of pipeline, lb/ft.
Weight of steel and cement mortar per foot of pipeline was provided by Hanson, a PCCP manufacturer. shows EESteel Pipe values for the various pipeline diameters. EESteel Pipe was then multiplied by length of each pipe segment to find the total embodied energy for that segment in kilowatt-hours, as summarized in . For ERCT, the eGRID subregion that includes most of Texas, 2012 emission rates were 1143 lb CO2/MWh, 16.70 lb methane/GWh, and 12.33 lb nitrous oxide (N2O)/GWh (EPA, 2015a). The global warming potential values of methane and nitrous oxide are 28 and 265 times that of carbon dioxide, respectively, meaning that their emission rates must be multiplied by 28 and 265 to estimate CO2 equivalents (EPA, 2015b). Thus, emissions of CO2 equivalents for Texas are 1.147 lb/kWh, including contributions from CO2, methane, and nitrous oxide. The embodied energy was therefore multiplied by 1.147 lb CO2-eq/kWh of electricity usage to find CO2-eq emissions for each segment.
Similarly, the embodied energy per foot of PCCP was calculated using eq 2:
where EEConcrete, EESteel, EECement Mortar, and EESteel Wire are the embodied energy coefficients for concrete, steel, cement mortar, and prestressed steel wires, and WConcrete, WSteel, WCement Mortar, and WSteel Wire are the unit weight per foot length for concrete, steel, cement mortar, and prestressed steel wires, respectively.
summarizes embodied energy and CO2-eq emission values for each pipeline segment for steel pipe and PCCP.
Pipe transportation phase
This phase includes calculation of total fuel consumption during transport of the pipe to the actual job site, based on total distance traveled. presents the length and weight of each pipe section for different segments. A 48- to 53-foot flat-bed truck–trailer combination was selected on the basis of pipe section lengths and weights (16 feet and 24,000–52,000 lb for PCCP; 50 feet and 11,000 to 25,000 lb for steel pipe). Each truck–trailer unit could carry one steel pipe because of the length restriction of 50 feet and one PCCP due to weight restriction of maximum 52,000 lb. The truck–trailer, with fuel consumption of 5.4 miles per gallon (mpg; Davis and Diegel, Citation2010), will be able to carry one pipe section per trip; the number of trips required is thus equal to the number of pipe sections, calculated by dividing the segment length by the pipe section length.
Table 3. Diesel fuel required and CO2 emissions for pipe transportation, steel pipe vs. PCCP.
The steel pipe was assumed to be supplied by the Northwest Pipe Company, Saginaw, TX, and PCCP was assumed to be supplied by Hanson Pipe & Precast, Grand Prairie, TX. Locations of these facilities were used to determine the distance between the production plant and the segment center or midpoint, as given in . Total diesel consumption was calculated according to eq 3, which includes a factor of 2 since the truck must travel to and from the production plant each time it delivers a pipe section:
The diesel consumption was converted into CO2 emissions using an emission factor of 22.2 lb CO2 per gallon of diesel fuel (EPA, Citation2005). The carbon dioxide emission factors for diesel fuel consumption assume that 99% of the fuel is oxidized to form CO2, so any methane emissions of methane or nitrous oxide would be minimal.
Pipe installation phase
For this study, only major construction activities were considered, such as excavation, loading, backfilling, hauling, and compaction. The production rate of construction equipment depends on several factors listed below, related to the pipeline itself and trench, surrounding soil, and equipment used listed next.
Factors related to pipeline:
Weight of each pipe section;
Length of each pipe section;
Trench cross-section details;
Volume of earthwork (excavation and backfill).
Factors related to soil:
Topography of right-of-way;
Type of soil;
Soil compaction level.
Factors related to equipment:
Age;
Capacity;
Power requirement;
Efficiency.
An increase in equipment production efficiency, or decrease in operational hours, will proportionally decrease emissions, and thus decrease the carbon footprint. Production efficiency of equipment will vary by weight and length of a pipe section. Smaller pipe sections will consume less time for installation than larger sections. The right-of-way should allow uninterrupted installation activities for greater productivity (Dey, Citation2006). Soft soil is more easily excavated compared to hard soil or rock; moreover, soil that is lightly compacted will require less effort to excavate, compared with soil that is highly compacted. For a given soil type and density, the greater the volume of earthwork required, the greater is the number of hours of construction equipment use. Newer equipment with greater capacity, power, and efficiency will have a faster production rate.
Additional factors impacting production rate include hauling distance (shorter distance increases production rate), water table (higher water table decreases production rate), weather conditions (good weather increases production rate), and operator efficiency (the experienced person will take less time and be more efficient than a less experienced and inefficient person).
All of the factors impacting construction equipment productivity mentioned already would be the same for steel and PCCP pipeline, except for factors related to the pipes themselves, such as length and weight. Another example of a difference related to the pipes themselves is that joining two segments in the field is required for steel pipes but only a push for connecting concrete pipe segments via a rubber gasket. Such differences in installation were accounted for by using the different lengths of time for construction equipment operation of various types for the two kinds of pipe ( and ).
Table 4. Hours of construction equipment needed and CO2 emissions for installation of steel pipe.
Table 5. Hours of construction equipment needed and CO2 emissions for installation of prestressed concrete cylinder pipe (PCCP).
and show hours of construction equipment operation needed for installation of steel pipe and PCCP, respectively. The hours were estimated by first estimating various quantities, such as excavation and backfill material, needed for the project for each kind of pipe. These quantities were then multiplied by productivities obtained from previous projects executed by Garney Construction for the Lake Eagle Mountain Pipeline Project conducted by Tarrant Regional Water District in 2006–2007 to determine the total time spent by various types of construction equipment at the job site (see Supplemental Information). Finally, an average fuel consumption per hour value (8.37 gal/hr) provided by the contractor was multiplied by hours at the job site to calculate the total fuel consumption for each activity. CO2 emissions were estimated using an emission factor of 22.2 lb CO2 per gallon of diesel fuel (EPA, Citation2005).
The following equation, eq 4, can be used to calculate CO2 emissions for each activity for both pipes:
Pipeline operation phase
Energy consumption for operating the pipeline depends on various parameters independent of pipe material, such as water demand, season, terrain of pipeline, and pump’s efficiency, as well as parameters that depend on pipe material, including Manning’s coefficient, corrosion, and breaks and leakage in pipe (AWWA, Citation2011; McPherson et al., Citation2009). It was assumed that both pipes will be lined with cement mortar lining material inside, as this is considered the best lining material for water transmission pipelines (AWWA, Citation2012). Hence, energy consumption for both pipes will be same due to the same Manning’s coefficient of the lining material. Average annual energy consumption, as shown in , was estimated on the basis of energy consumption available from existing pipelines (Tarrant Regional Water District, Citation2010). The average annual energy consumption varies by decade, as water demand varies, causing changes in pumping energy requirements. The pipeline commissioning and operation are scheduled for the year 2020. Hence, the energy consumption was calculated from year 2020 to 2060, based on the project lifetime recommended by Tarrant Regional Water District. Finally, the energy consumption was multiplied by the Texas emission rate of 1.147 lb CO2/kWh of electricity usage (EPA, 2015a) to find CO2 emissions.
Table 6. Energy consumption and CO2 emissions for pipeline operation, both steel and PCCP.
The following equation, eq 5, can be used to calculate quantities in :
Results and discussion
CO2 emissions for total four life cycle phases for both pipe materials are provided as .
Figure 3. CO2 emissions for different phases for steel pipe and PCCP.
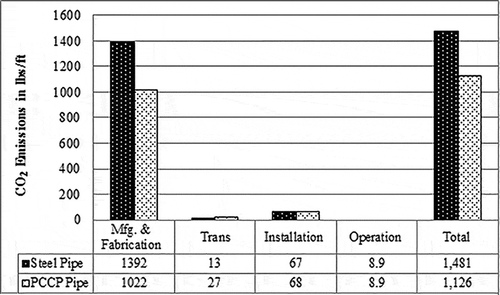
Figure 4. Energy consumption for material production and pipeline fabrication for steel and PCCP.
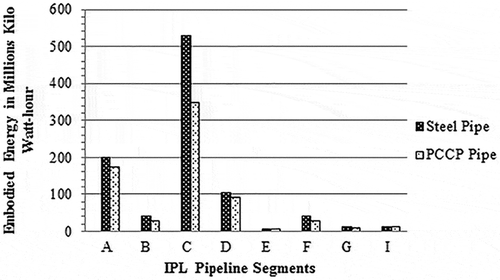
For the material production and pipeline fabrication phase, it was found that total energy consumption for steel pipe was greater than for PCCP, as shown in , for total length of the pipeline. The calculations for energy consumption and CO2 emissions for each pipe segment are provided in . For the total pipeline, steel pipe CO2 emissions were 36% greater than for PCCP (1392 vs. 1022 lb/ft, respectively). For each pipeline segment, the weight of materials used to make PCCP (steel, cement, concrete, and steel wire) was greater than the weight of materials used to make steel pipe (steel and cement). However, the embodied energy coefficient for steel is about 30 times higher than for concrete and cement (24.9 MJ/kg for steel vs. 0.95 MJ/kg for concrete and 1.33 for cement, as shown in ). Steel production from virgin materials is energy intensive, due primarily to chemical energy required to reduce iron ore to iron using reducing agents (Worldsteel Association, Citation2014). Since steel pipe contained a higher fraction of steel, this meant that the embodied energy for each steel pipeline segment was greater than for PCCP.
As mentioned previously, the embodied energy data from the ICE database for concrete and steel pipe represent global averages. In particular, the recycled content used for the embodied energy coefficient of steel pipe in the database was 39% (world average). However, some of the U.S. steel manufacturers, such as Nucor Corporation, use higher recycled content in manufacturing their steel. Producing a product from recycled materials takes less energy than producing a product from virgin materials; hence, a higher content of recycled steel would reduce the embodied energy coefficient.
For the transportation phase, shown in , the distance that steel pipe would have to be transported from the production plant to the installation location would be greater for seven of the eight pipeline segments than the distance for PCCP. However, due to the heavy weight of PCCP, a larger number of truck–trailer trips would be required (43,837 trips for PCCP, compared to 15,565 trips for steel). Although the PCCP sections are only around one-third as long as the steel sections (16 feet for PCCP compared to 50 feet for steel), the PCCP sections weigh almost 3 times as much (39,945 pounds for each PCCP section, compared to 13,979 pounds for each steel section). The greater number of truck–trailer trips required for PCCP would lead to greater fuel consumption and CO2 emissions that are over twice as high for PCCP (27.2 lb/ft) compared to steel pipe (13.3 lb/ft).
For the pipeline installation phase, as indicated in and for steel pipe and PCCP, respectively, excavation and backfilling were the primary contributors to the fuel consumption and thus CO2 emissions. Excavation contributed 33% and 31% of CO2 emissions, and backfilling contributed 24% and 21%, for steel pipe and PCCP, respectively. Large amounts of excavation and backfilling were required, and the productivity of equipment used in excavation and backfilling was low, resulting in a large number of hours of operation being required. The large number of hours of operation resulted in high fuel consumption and high CO2 emissions.
For the pipe installation phase, overall CO2-eq emissions were 1.1% higher for PCCP (68.6 lb/ft) compared to steel pipe (67.8 lb/ft). This is due to the lower productivity of certain activities such as trench support and pipe laying for PCCP compared to steel pipe. However, pipe segment C for steel pipe had slightly higher values of fuel consumption and CO2-eq emissions than PCCP due to longer durations for various activities such as excavation, pipe laying, compaction, and material handling and screening. This study assumed open cut installation for both kinds of pipe. Using alternate pipe installation methods, such as trenchless, would make a significant difference in the carbon footprint analysis.
shows emissions from pipeline operation and maintenance over a 40-year time period. As explained in the Methodology section, it was assumed that both pipes will be lined with the same lining material inside, and thus that energy consumption for both pipes will be same due to the same Manning’s coefficient of the lining material. The average annual energy consumption varies by decade based on water demand. The annual energy consumption drops during the 2030–2040 decade, presumably due to demand decreasing due to additional sources of water becoming available. During 2040–2060, energy consumption again increases, presumably due to continued population growth in the North Texas region.
and compare total CO2-eq emissions for steel pipe and PCCP, for all four phases. The manufacturing and fabrication of the pipe contributed more than 90% of CO2-eq emissions for both kinds of pipe. As mentioned earlier, the contribution of this phase was overestimated somewhat due to underestimation of percent recycled material used in steel pipe. However, even for concrete pipe, for which a higher recycling percent was assumed, more than 90% of emissions was due to the manufacturing and fabrication phase. This is primarily due to the embodied energy in the concrete. From a practical perspective, the only way to reduce embodied energy is to increase recycling percent (which is already high for concrete), or switch to another material with a lower embodied energy.
Table 7. Life-cycle CO2 emission summary for steel pipe and PCCP.
The phase with the second largest contribution to CO2-eq emissions, for both kinds of pipe, was installation. This contribution could be reduced by manufacturers increasing the productivity and/or fuel economy of the construction equipment. Alternative pipe installation techniques, such as trenchless technology, could also potentially reduce this contribution.
Total emissions for steel pipe exceeded that for PCCP by 32%, primarily due to the material production and pipeline fabrication phase, and the greater energy required to obtain raw materials for steel pipe and manufacture it. Even if the percent use of recycled steel were increased, total emissions for steel pipe would likely still exceed that for PCCP. Thus, to reduce CO2-eq emissions, this case study suggests that PCCP should be chosen instead of steel pipe.
Study assumptions and recommendations for future work
This study examined CO2-eq emissions from one particular case of a water transmission pipeline. Pipe lengths and weights, which impact emissions for several of the life cycle phases, were thus particular to this project.
CO2-eq emissions from the material production and pipeline fabrication phase predominated in the total emissions. CO2-eq emissions for this phase came from global averages, including global averages for percent recycled content. CO2-eq emissions for this phase could thus vary considerably if emissions specific to a particular pipeline manufacturer were used, rather than global averages. A particular manufacturer may use different material extraction methods and manufacturing technologies. Carbon emissions from electricity used to power the manufacturing process were specific to the ERCT U.S. subregion; a pipeline located in a different region of the United States, or outside the United States, would produce different emissions due to a different mix of fuels used to generate electricity.
For the transportation phase, distances that the pipe segments had to be transported were specific to this project. If pipe segments had to be transported longer distances on a different project, the transportation phase would be more significant in the overall life-cycle emissions. The transportation phase also assumed use of diesel fuel, and current fuel efficiencies. Use of alternate fuels, in the future in the United States, or currently in other parts of the world, would impact transport emissions, as would future increases in vehicle fuel efficiencies.
For the pipeline installation phase, hours of operation for construction equipment were based on quantities specific to the project, and equipment productivity specific to one company. These values would be expected to vary for other projects. The installation phase also assumed use of diesel fuel, and current fuel efficiencies. Use of alternate fuels or increases in vehicle fuel efficiencies would impact installation phase emissions. Finally, this study assumed open cut installation for both kinds of pipe. Alternate pipe installation methods would impact emissions from the installation phase.
Emissions from pipeline operation were specific to the pipe diameters, lengths, lining materials (cement mortar), water demand levels, and electricity generation subregion used in this study. Variations in these factors would impact emissions from the operation phase.
The pipeline operation phase for both kinds of pipe was assumed to last 40 years, which was the project lifetime specified by Tarrant Regional Water District (2020–2060). In actuality, the two kinds of pipe would likely have different life spans. Each time a pipeline has to be replaced, another large amount of emissions would occur from material production and fabrication. The pipeline that has a longer life span would need replacement less frequently, which would reduce its emissions due to material production and fabrication over the long term. Unfortunately, for multiple reasons, we were not able to viably compare PCCP and steel pipeline lifetimes in order to be able to include their life span in the analysis. Most PCCP water pipelines, installed in the 1940s in the United States, are still in service and has not yet reached the end of its lifetime; therefore, few data are available on PCCP life spans. For steel pipe, industries have shifted design requirements from wall thickness to the soil rather than pipe stiffness (Najafi and Gokhale, Citation2005). Consequently, older steel pipe with thicker walls would last longer than today’s steel pipe, due to sufficient steel to resist corrosion and extend its life span. Few data are available on the lifetime of steel pipe used today, because it has not yet reached the end of its lifetime. Furthermore, advances in condition assessment technologies for PCCP over the last 15 years have allowed owners to conduct PCCP surveys to determine PCCP pipeline conditions (Najafi, Citation2003). No similar technologies exist for steel pipe. Thus, it is difficult to provide a meaningful comparison of the anticipated lifetimes of newly installed PCCP and steel pipe.
A sensitivity analysis is recommended as future work, to examine how varying assumed factors already mentioned, for the four life-cycle phases, impact overall emissions. In addition, pipeline inspection and maintenance and the end-of-life phase were not included in this study, and could be examined in future work.
Regarding inspection and maintenance, steel pipe and concrete have differing requirements because of the way they are designed. Steel pipe is considered as flexible pipe, which can deflect under loads; concrete pipe is considered as rigid pipe. Therefore, the pipe–soil interaction and load transferring mechanism are different for the two kinds of pipe. Furthermore, steel pipes are joined in the field using welding, which can lead to failures due to poor quality or degradation, while concrete pipes are joined using bell and spigot, which eliminates the need for welding but has its own limitations. Finally, steel and precast concrete pipes are both subject to corrosion; therefore, cathodic protection along with frequent field inspection and maintenance is required. An in-depth study of inspection and maintenance frequency and material requirements is recommended in order to be able to quantify environmental impacts from the inspection and maintenance phase.
Conclusions
Among the four phases of the pipeline life cycle, the manufacturing and fabrication proved to be the most influential, contributing more than 90% of life cycle carbon emissions for both kinds of pipe. Steel pipe had 36% larger CO2-eq emissions from manufacturing compared to PCCP. For the transportation phase, PCCP consumed more fuel due to its heavy weight, and therefore had larger CO2-eq emissions. Fuel consumption by construction equipment for installation of pipe was found to be similar for steel pipe and PCCP. Overall, steel had a 32% larger footprint due primarily to greater energy used during manufacturing. Even if the percent use of recycled steel were increased, total emissions for steel pipe would likely still exceed that for PCCP. Thus, to reduce CO2-eq emissions, this case study suggests that PCCP should be chosen instead of steel pipe.
Funding
The authors thank Tarrant Regional Water District (TRWD) and Dallas Water Utilities (DWU) for the invaluable support and funding provided for this study. The authors would also like to thank Northwest Pipe Company, Hanson Pipe & Precast, and Garney Construction for providing information throughout this study. The authors thank the China Section of the Air & Waste Management Association for the generous scholarship they received to cover the cost of page charges and make the publication of this paper possible.
Supplemental data
Supplemental data for this paper can be accessed on the publisher’s Web site.
Supplemental Material
Download Zip (268.3 KB)Additional information
Notes on contributors
Lalit Chilana
Lalit Chilana is a senior pipeline engineer at Gulf Interstate Engineering.
Arpita H. Bhatt
Arpita H. Bhatt is a postdoctoral fellow in the Civil Engineering Department at the University of Texas at Arlington, TX.
Mohammad Najafi
Mohammad Najafi is a professor and director of construction management program in the Civil Engineering Department at the University of Texas at Arlington, TX.
Melanie Sattler
Melanie Sattler is an associate professor in the Civil Engineering Department at the University of Texas at Arlington, TX.
References
- American Water Works Association. 2004. M11 Steel Pipe: A Guide for Design and Installation, 4th ed. Denver, CO: AWWA.
- American Water Works Association. 2005. AWWA Manual C200, Standard for Steel Water Pipe. Denver, CO: AWWA.
- American Water Works Association. 2007. Standard for Design of Prestressed Concrete Cylinder Pipe. ANSI/AWWA c301-92. Denver, CO: AWWA.
- American Water Works Association. 2008. AWWA M9 Concrete Pressure Pipe, 3rd ed. Denver, CO: AWWA.
- American Water Works Association. 2011. Water Transmission and Distribution, 4th ed., Denver, CO: AWWA.
- American Water Works Association. 2012. AWWA Manual C205, Cement–Mortar Protective Lining and Coating for Steel Water Pipe 4 In. (100 mm) and Larger. Denver, CO: AWWA.
- CUIRE (Center for Underground Infrastructure Research and Education). 2013. Performance investigation of different large diameter water pipe materials. http://www.uta.edu/ce/cuire/CUIRE%20Report%20for%20Performance%20Investigation%20of%20Different%20Large%20Diameter%20Water%20Pipe%20Materials%20.pdf.
- Davis, S.C., and S.W. Diegel. 2010. Transportation Energy Data Book: Edition 29. Oak Ridge National Laboratory, U.S. Department of Energy Center for Transportation Analysis Engineering Science & Technology Division. http://cta.ornl.gov/data/index.shtml.
- Dey, P.K. 2006. Integrated project evaluation and selection using multiple-attribute decision-making technique. Int. J. Production Econ. 103(1): 90–103. doi:10.1016/j.ijpe.2004.11.018
- Filion, Y.R., H.L. MacLean, and B.W. Karney. 2004. Life-cycle energy analysis of a water distribution system. J. Infrastruct. Syst. 10(3): 120–130. doi:10.1061/(ASCE)1076-0342(2004)10:3(119)
- Freedonia Group, Inc. 2013. World water pipe. Study number 3004. www.freedonia.com
- Hammond, G., and C. Jones. 2011. Inventory of Carbon and Energy (ICE), Version 2.0. Sustainable Energy Research Team. Department of Mechanical Engineering, University of Bath. www.bath.ac.uk/mech-eng/sert/embodied
- McPherson, D. 2009. Choice of pipeline material: PVC or DI using a life cycle cost analysis. ASCE National Pipeline Conference, San Diego, CA, 1342–54.
- Najafi, M., and S. Gokhale. 2005. Trenchless Technology: Pipeline and Utility Design, Construction and Renewal. New York, NY: McGraw-Hill.
- Najafi, M., ed. 2003. New pipeline technologies, security and safety, two-volume. Proc. International Pipeline Conference, July 13–16, 2003, Baltimore, MD. Reston, VA: American Society of Civil Engineers.
- Nathanson, J.A. 2014. Water supply system. Encyclopedia Britannica. http://www.britannica.com/technology/water-supply-system ( accessed September 2, 2015).
- National Grid. 2011. Felindre to Tirley pipeline. http://www.nationalgrid.com/uk/Gas/Pipelines/milfordhaven/fs5 ( accessed July 10, 2012).
- Piratla, K.R., S.T. Ariaratnam, and A. Cohen. 2011. Estimation of CO2 emissions from the life cycle of a potable water pipeline project. J. Manage. Eng. 28( 1, special issue: Engineering Management for Sustainable Development): 22–30. doi:10.1061/(ASCE)ME.1943-5479.0000069
- Rehan, R., and M. Knight. 2007. Do trenchless pipeline construction methods reduce greenhouse gas emissions. Preliminary report. Waterloo, ON, Canada: Centre for the Advancement of Trenchless Technologies, Waterloo University.
- Sihabuddin, S., and S. Ariaratnam. 2009. Quantification of carbon footprint on underground utility projects. Construction Research Congress, 618–627. doi:10.1061/41020(339)63
- Tarrant Regional Water District. 2010. http://www.trwd.com (personal communication).
- U.S. Environmental Protection Agency. 2005. Emission facts: Average carbon dioxide emissions resulting from gasoline and diesel fuel. Washington, DC: Office of Transportation and Air Quality, EPA420-F-05-001.
- U.S. Environmental Protection Agency. 2015a. eGRID2012 GHG Annual Output Emission Rates. http://www.epa.gov/sites/production/files/2015-10/documents/egrid2012_ghgoutputrates_0.pdf, ( accessed January 17, 2016).
- U.S. Environmental Protection Agency. 2015b. Understanding global warming potentials. http://www3.epa.gov/climatechange/ghgemissions/gwps.html ( accessed January 17, 2016).
- Venkatesh, G., and H. Brattebo. 2011. Energy consumption, costs and environmental impacts for urban water cycle services: Case study of Oslo (Norway). Energy 36(2): 792–800. doi:10.1016/j.energy.2010.12.040
- Water Organization. 2014. Millions lack safe water. http://water.org/water-crisis/water-facts/water ( accessed August 5, 2015).
- Worldsteel Association. 2014. Fact sheet: Energy use in the steel energy. https://www.worldsteel.org/publications/fact-sheets/content/02/text_files/file0/document/fact_energy_2014.pdf ( accessed January 18, 2016).