
ABSTRACT
Environment and Climate Change Canada’s FireWork air quality (AQ) forecast system for North America with near-real-time biomass burning emissions has been running experimentally during the Canadian wildfire season since 2013. The system runs twice per day with model initializations at 00 UTC and 12 UTC, and produces numerical AQ forecast guidance with 48-hr lead time. In this work we describe the FireWork system, which incorporates near-real-time biomass burning emissions based on the Canadian Wildland Fire Information System (CWFIS) as an input to the operational Regional Air Quality Deterministic Prediction System (RAQDPS). To demonstrate the capability of the system we analyzed two forecast periods in 2015 (June 2–July 15, and August 15–31) when fire activity was high, and observed fire-smoke-impacted areas in western Canada and the western United States. Modeled PM2.5 surface concentrations were compared with surface measurements and benchmarked with results from the operational RAQDPS, which did not consider near-real-time biomass burning emissions. Model performance statistics showed that FireWork outperformed RAQDPS with improvements in forecast hourly PM2.5 across the region; the results were especially significant for stations near the path of fire plume trajectories. Although the hourly PM2.5 concentrations predicted by FireWork still displayed bias for areas with active fires for these two periods (mean bias [MB] of –7.3 µg m−3 and 3.1 µg m−3), it showed better forecast skill than the RAQDPS (MB of –11.7 µg m−3 and –5.8 µg m−3) and demonstrated a greater ability to capture temporal variability of episodic PM2.5 events (correlation coefficient values of 0.50 and 0.69 for FireWork compared to 0.03 and 0.11 for RAQDPS). A categorical forecast comparison based on an hourly PM2.5 threshold of 30 µg m−3 also showed improved scores for probability of detection (POD), critical success index (CSI), and false alarm rate (FAR).
Implications: Smoke from wildfires can have a large impact on regional air quality (AQ) and can expose populations to elevated pollution levels. Environment and Climate Change Canada has been producing operational air quality forecasts for all of Canada since 2009 and is now working to include near-real-time wildfire emissions (NRTWE) in its operational AQ forecasting system. An experimental forecast system named FireWork, which includes NRTWE, has been undergoing testing and evaluation since 2013. A performance analysis of FireWork forecasts for the 2015 wildfire season shows that FireWork provides significant improvements to surface PM2.5 forecasts and valuable guidance to regional forecasters and first responders.
Introduction
Biomass burning, including controlled prescribed fires or burns as well as wildfires, can emit significant amounts of pollutants that can adversely impact local and regional air quality (AQ). Emissions from fire include primary pollutants such as carbon monoxide (CO), particulate matter (PM), and ammonia (NH3), as well as ozone (O3) precursors such as nitrogen oxides (NOx) and nonmethane hydrocarbons (NMHC) (Crutzen et al., Citation1979; Crutzen and Andreae, Citation1990; Jaffe and Wigder, Citation2012). Large-scale fires have been shown to influence local meteorology through strong pyroconvective events and cause pollutants to be transported over hundreds of kilometers (Gatebe et al., Citation2012; Fromm et al., Citation2005; Fromm and Servranckx, Citation2003). The long-range transport of smoke plumes can impact AQ in communities from the regional to continental scale (Cottle et al., Citation2014; Millet et al., 2011; Mathur, Citation2008; Damoah et al., Citation2006). Locally, smoke from fires has been linked to significant increases in hospital visits from respiratory disease and respiratory morbidity (Liu et al., Citation2015, Henderson et al., Citation2011). Ground-level smoke can also reduce visibility to the extent that driving becomes hazardous (Miller Citation2015; Wise Citation2008). Furthermore, with climate change, there is growing evidence that the frequency, size, and duration of fire events are expected to increase in the coming decades due to higher temperature, increases in fire potential, and longer fire seasons across North America (Wang et al., Citation2015; Intergovernmental Panel on Climate Change [IPCC], 2014; Flannigan et al., Citation2013; Liu et al., Citation2013; Spracklen et al., Citation2009). Episodic air pollution as a result of fire-related events is therefore anticipated to increase in the near future.
To protect public health and welfare, many countries, including Canada, have established AQ standards for atmospheric pollutants such as CO, NOx, O3, and PM2.5 (PM with aerodynamic diameter less than 2.5 μm). In Canada, the Canadian Ambient Air Quality Standards (CAAQS), established in 2013, include an annual PM2.5 standard of 10 µg m−3 and a 24-hr PM2.5 standard of 28 µg m−3. The CAAQS also included a future, attainable target for 2020 to reduce the annual PM2.5 standard to 8.8 µg m−3 and the 24-hr PM2.5 standard to 27 µg m−3 (Canada Gazette, Citation2013). Exceedances of these standards due to the impact of smoke plumes from biomass burning, especially wildfires, which are natural and largely uncontrollable sources, must be considered by AQ managers.
In recent years, AQ forecasters have obtained additional guidance from numerical weather prediction (NWP) models and chemical transport models (CTM). These models simultaneously account for complex meteorology, numerous pollutant sources, and transport, chemistry, and removal processes occurring across large spatial and temporal scales. Current operational numerical AQ forecast systems vary greatly in their complexity, spatiotemporal resolutions and coverage, and source emissions considered. Many such systems were reviewed recently (e.g., El-Harbawi, Citation2013; Kukkonen et al., Citation2012; Zhang et al., Citation2012a; Zhang et al., Citation2012b).
In Canada, the Regional Air Quality Deterministic Prediction System (RAQDPS) of Environment and Climate Change Canada (ECCC), a Canadian federal government department, has been providing numerical guidance on atmospheric chemical conditions since 2001. Similar to most regional CTM systems, the RAQDPS focuses on urban smog events caused by anthropogenic-related emissions, as well as on long-range transport from anthropogenic-related transboundary pollutions (Moran et al., Citation2012, Citation2015; Im et al., Citation2015). To inform the Canadian public about expected next-day AQ, ECCC issues routine daily, location-specific Air Quality Health Index (AQHI) forecasts alongside weather forecasts for urban centers and rural communities (Stieb et al., Citation2008), as well as special AQ warning statements for predicted pollution episodes. These forecasts are continuously monitored and analyzed by experienced forecasters and meteorologists across the country.
Recently, with increasing contributions to PM2.5 from biomass burning, it is becoming clear that emissions from fire events should be incorporated into CTM forecast systems. Wildfire events, however, are sporadic and unpredictable, and emissions from wildfires depend on factors such weather, fuel loading, fuel condition, and fire suppression activities. As a consequence, detecting near-real-time (NRT) fire activity and quantifying NRT fire emissions has been very challenging and is an active area of ongoing research (Darmenov and de Silva, Citation2013; Kaiser et al., Citation2012; Zhang et al., Citation2012c; Al-Saadi et al., Citation2008).
There have been a number of case studies incorporating dynamic biomass burning emissions into regional CTMs; however, few such systems operate in NRT to provide AQ forecasts. For example, the National Center for Atmospheric Research (NCAR) operates a global atmospheric chemical forecast system with the MOZART-4 CTM (http://www.acom.ucar.edu/acresp/forecast; Emmons et al., Citation2010). The system runs daily using NRT biomass burning emissions from the Fire INventory from NCAR (FINN) model (Wiedinmyer et al., Citation2011) to produce 3-day chemical forecasts. Fire emissions are derived from the combined land-cover-specific emission factors and fuel loading, together with daily, global, 1-km fire activity measurements from Moderate Resolution Imaging Spectroradiometer (MODIS) Thermal Anomalies Product on the National Aeronautics and Space Administration (NASA) Terra and Aqua satellites (Giglio et al., Citation2003).
Regionally in the United States, the Air Information Report for Public Access and Community Tracking (AIRPACT) system developed by Washington State University produces daily 48-hr AQ forecasts for the Pacific Northwest region of the United States (http://www.lar.wsu.edu/airpact; Herron-Thorpe et al., Citation2012). The system produces NRT fire emissions with the BlueSky Modeling Framework (Larkin et al., Citation2009). BlueSky utilizes fire hotspot data from the National Oceanic and Atmospheric Administration (NOAA) Hazard Mapping System (HMS) and U.S. Forest Service fire incident reports, together with surface fuel loading and emission factors from the Fuel Characteristic Classification System (FCCS; Riccardi et al., Citation2007) and the Fire Emission Production Simulator (FEPS; Anderson et al., Citation2004), respectively, to produce NRT fire emissions. Fires are assumed to persist throughout the 48-hr forecast simulation period, and PM2.5 and O3 concentration forecasts are produced using the U.S. Environmental Protection Agency (EPA) CMAQ model.
Nationally in the United States, NOAA’s operational National Air Quality Forecast Capability produces 48-hr smoke predictions from fires with the BlueSky Modeling Framework and the NOAA HYSPLIT trajectory system (http://airquality.weather.gov; Stajner et al., Citation2012; Rolph et al., Citation2009). Similar NRT trajectory systems have been adopted in other regions, including western and eastern Canada (http://firesmoke.ca; Schigas and Stull, Citation2013) and for other subregions across the United States (http://www.airfire.org/data/bluesky-daily; Larkin et al., Citation2009).
In Canada, the Canadian Forest Service, part of the federal Department of Natural Resources, has operated the Canadian Wildland Fire Information System (CWFIS) since 1994 (Lee at al., Citation2002). This NRT system produces fire hotspot information and forecasts of fire behavior and fire danger using satellite data and forecast meteorology for areas across Canada. In this paper, we describe a new forecast system that inputs fire activity information from the CWFIS to produce NRT biomass-burning emission estimates, and that combines these into ECCC’s operational RAQDPS to produce AQ forecast guidance specific to biomass burning impacts on atmospheric PM2.5. The goal of this experimental system, named FireWork, is to provide timely information to regional forecasters, first responders, and local emergency agencies up to 2 days ahead on expected regional smoke impacts and atmospheric PM2.5 loadings from biomass burning.
The paper is structured as follows. The second section provides a detailed description of the Canadian numerical AQ forecast system, and the changes for the experimental FireWork system. The third section presents analyses of the forecast results for 2015 fire events, and examines two case studies by comparing FireWork forecast results against the benchmark RAQDPS system. A discussion about current limitations of the FireWork system and future plans are presented in the fourth section, followed by a summary and conclusions in the fifth section.
Canada’s national numerical air quality forecast systems
Regional air quality deterministic prediction system
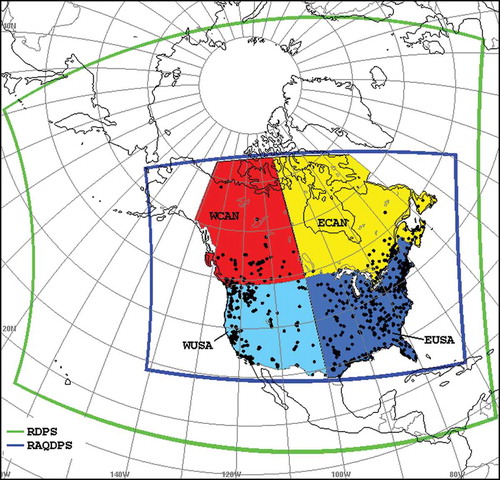
The RAQDPS is ECCC’s operational numerical regional AQ forecast system (Moran et al., Citation2012; Moran et al., Citation2015; Im et al., Citation2015). Since 2009, the heart of the RAQDPS has been a limited-area configuration of the GEM-MACH model, which consists of an online, one-way-coupled CTM embedded within the Global Environmental Multi-scale model (GEM), which is also ECCC’s operational regional and global NWP model (Coté et al., Citation1998a, Citation1998b; Charron et al., Citation2012). Operationally the RAQDPS is run twice daily with initializations at 00 UTC and 12 UTC. It produces 48-hr forecasts of hourly surface concentrations of O3, NO, NO2, CO, and other gas-phase species, as well as PM2.5 and PM10 bulk mass and nine PM2.5 and PM10 chemical components (elemental carbon; primary organic matter; secondary organic matter; sulfate; nitrate; ammonium; crustal material; sea salt; and particle-bound water). The RAQDPS domain covers nearly all of North America () with a rotated latitude–longitude grid at 10-km horizontal grid spacing and 80 vertical levels from the surface up to 0.1 hPa. The first terrain-following (hybrid σ–p) model layer has a thickness of 20 m.
Figure 1. Domain boundaries of the larger RDPS (green), and the inner RAQDPS and FireWork (blue). Superimposed on the map are locations of the 750 NRT PM2.5 surface measurement stations used in the model evaluation analysis, and the four geographical subregions used in the statistical analysis.
Emissions are a key input for any CTM model. The current version of the RAQDPS uses hourly emissions based on version 1 of the 2010 Canadian national criteria-air-contaminant (CAC) emissions inventory, version 1 of the 2011 U.S. national CAC emissions inventory, and the 1999 Mexican CAC emissions inventory (Moran et al., Citation2015). These are comprehensive inventories that include anthropogenic emissions from major and minor point sources, area sources, and on- and off- road mobile sources. The SMOKE (Sparse Matrix Operator Kernel Emissions) emissions processing system (Carolina Environmental Programs [CEP], 2012) was used to generate hourly, gridded fields of anthropogenic emissions that vary by month, and by day of the week. GEM-MACH employs an updated version of the ADOM-II gas-phase chemistry mechanism (Lurmann and Stockwell, Citation1989) with 42 gas-phase species and 114 reactions; the RAQDPS configuration of GEM-MACH assumes a simplified PM size distribution with two size bins, 0–2.5 μm and 2.5–10 μm, with each bin having nine chemical components. In total, 18 gas-phase species are emitted along with 12 size-bin-specific PM chemical components (elemental carbon, primary organic matter, crustal material, sulfate, nitrate, ammonium). Stationary point sources are allocated to model grid cells, and plume-rise and plume-spread calculations are performed at each model time step to determine the model vertical layers into which point-source emissions are injected. Biogenic emissions and sea-salt emissions are also calculated in the model at each time step based on meteorological fields forecast by the model. Algorithms from version 3.09 of the BEIS3 biogenic emissions model (Hanna et al., Citation2005) and from the sea-salt emissions scheme of Gong et al. (Citation2003) are used to estimate these natural emissions.
Chemical lateral boundary conditions are based on a seasonal chemical climatology that does not vary with time, except for O3, where location-specific monthly profiles were supplied from a global ozone climatology (Makar et al., Citation2010). Hourly meteorological boundary conditions are provided from 48-hr forecasts of ECCC’s operational regional 10-km configuration of GEM, the Regional Deterministic Prediction System (RDPS), on a larger domain than the RAQDPS domain (). Initial chemical conditions are specified from the 12-hr chemistry fields produced by the previous RAQDPS forecast, whereas initial meteorological conditions come from the same analysis fields used by the RDPS for the same forecast time.
Concentration forecasts from the GEM-MACH model are provided as numerical guidance products for operational AQ forecasters across the country, and selected products are also available to the public through the Government of Canada’s public weather information website (http://www.weather.gc.ca/aqfm).
The primary quantity used to communicate AQ conditions to the public is the AQHI, which is issued as part of weather predictions for cities across Canada. The AQHI is an index-based system used to disseminate warnings about poor AQ and its associated human health impacts. This hourly index was developed through epidemiological studies (Stieb et al., Citation2008). It expresses the total health risk due to exposure to a mixture of air pollutants and has a range of 1–10, with 10+ being used for values off the scale. The AQHI is calculated as a weighted sum of forecast O3, PM2.5, and NO2 surface concentrations, where NO2 is included in the index both because of its direct health impacts and as a proxy for other, nonmeasured pollutants with health impacts. Higher AQHI values indicate greater health risks, and forecast AQHI values can be interpreted in following manner: low risk (1–3), moderate risk (4–6), high risk (7–10), and very high risk (10+). In addition, each AQHI value has two associated health messages that are directed at either the at-risk population subgroup or the general healthy population.
The RAQDPS includes other components besides GEM-MACH. One postprocessing product is the Updateable Model Output Statistics for Air Quality (UMOS-AQ) package, which applies statistics for bias correction to compensate for systematic AQ model errors and account for unresolved subgrid-scale phenomena at particular locations, namely the locations of AQ measurement stations (Wilson and Vallée, Citation2002; Antonopoulos et al., Citation2010; Moran et al., Citation2012). Hourly model forecasts of both pollutant concentrations and meteorological quantities at specific locations are combined with available hourly surface AQ measurements to generate location-specific hourly statistical forecasts for areas where AQ is measured. The location-specific O3, PM2.5, and NO2 concentrations calculated by UMOS-AQ are also the ones used in the calculation of the AQHI values that are disseminated to the public.
Pollutant concentration fields predicted by GEM-MACH are also used as first-guess fields to generate hourly North American objective analyses (OA) of surface pollutants as part of the ECCC Regional Deterministic Air Quality Analysis (RDAQA) postprocessing package (Robichaud and Ménard, Citation2014). NRT objective analyses are currently available from the RDAQA for six pollutants (O3, PM2.5, PM10, SO2, NO2, and NO), and together with forecast products from RAQDPS, they represent a suite of numerical AQ guidance that is used to assist regional forecasters and meteorologists across Canada.
FireWork system
The FireWork system is identical to the RAQDPS except for the addition of biomass burning emissions. This system was developed by ECCC in collaboration with the Canadian Forest Service and with contributions from the U.S. Forest Service. FireWork has been running in experimental mode at the Canadian Centre for Meteorological and Environmental Prediction of ECCC during the Canadian wildfire season since 2013 in parallel with the RAQDPS. Because the two systems are run on identical grids with identical meteorological initializations, identical boundary conditions, and identical emissions except for biomass burning emissions, a simple subtraction of RAQDPS PM fields from FireWork PM fields yields a first-order estimate of biomass burning-related impacts on PM concentrations. This simple strategy allows the location and behavior of biomass burning smoke plumes to be isolated, forecast, and followed.
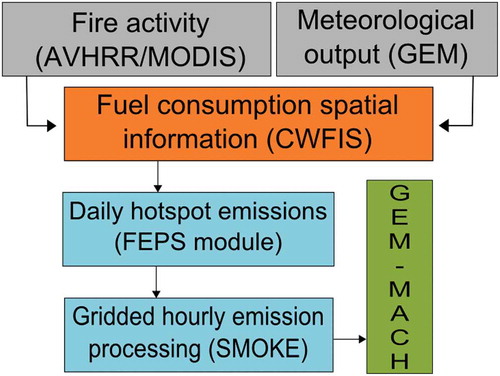
The overall FireWork framework specific to biomass burning emissions is depicted in . Since the model domain is the same as the RAQDPS, the system requires NRT fire activity and emissions information across both Canada and the continental U.S. The CWFIS is an operational system of the Canadian Forest Service (http://cwfis.cfs.nrcan.gc.ca; Lee et al. Citation2002). Based on the Canadian Forest Fire Danger Rating System (CFFDRS) (Stocks et al., Citation1989), the system provides fire activity and fire danger conditions across Canada and the continental United States during the active fire season.
Figure 2. FireWork model system framework and data flow.
Fire danger calculations in the CWFIS use daily weather observations and NWP forecasts from ECCC’s RDPS (up to 48 hr). Local noon station values are used to calculate the current and forecast fire weather indices as described by the Canadian Forest Fire Weather Index (FWI) System (Van Wagner Citation1987); station values are then interpolated spatially to produce daily fire weather maps.
Spatial fire weather conditions are combined with the Canadian Forest Fire Behavior Prediction (FBP) System Fuel Map (Simpson et al., Citation2010), a 1-km resolution gridded field based on the 16 fuel types described by the FBP system (Forestry Canada Fire Danger Group, Citation1992). This fuels map is an integration of three input data sets, including the 250-m North American Land Change Monitoring System (NALCMS) land cover 2010 (http://landcover.usgs.gov/nalcms.php), Terrestrial Ecozones and Ecoregions of Canada (Ecological Stratification Working Group Citation1995), and Canada’s National Forest Inventory (NFI; Gillis et al., Citation2005). Following the FBP system, CWFIS fire behavior maps are then produced spatially for each fuel grid cell using the interpolated fire weather observations.
The two primary input data sets needed by the CWFIS to capture NRT wildland fire activity come from NASA’s Moderate Resolution Imaging Spectroradiometer (MODIS) and NOAA’s Advanced Very High Resolution Radiometer (NOAA/AVHRR) satellite-based detection systems (Anderson et al., Citation2009). During the fire season, this satellite-detected fire activity is updated six times daily in the CWFIS, corresponding to the frequency of available data from MODIS and AVHRR. Relevant fire behavior information estimated by CWFIS for each fire hotspot includes surface fuel consumption (SFC), crown fuel consumption (CFC), and total fuel consumption (TFC) as defined by the FBP system, and forest floor fuel consumption (FFFC; de Groot et al. Citation2009). Fuel consumption values, measured in kilograms per square meter, are then multiplied by the approximate size of a hotspot to estimate the amount of smoke emissions per hotspot. In the current application of FireWork, an assumption of 38.5 ha consumed per hotspot (350 m burn radius) is used to estimate total rate of emissions per hotspot. This value was empirically derived from the national area burned and the number of hotspots observed during the 2010 fire season.
Given that emission factors vary significantly with combustion efficiency, which depends on the form of combustion, CWFIS parameterizes the fraction of smoldering versus flaming combustion using the Drought Code (DC), a unitless index in the FWI system indicating the dryness of the deep (5 cm+) organic forest floor (de Groot et al., Citation2009). Forest floor fuel consumption (FFFC in kg m−2) is parameterized as
where Load is the total fuel load (kg m−2), and a value of 5 kg m−2 is applied. The FFFC, which was determined from measurements collected months after a fire, represents the longer duration burning, including both the smoldering and flaming phases, as compared to fuel consumption measurements used by the FBP system, which were generally collected only hours after experimental burns. For the purposes of calculating smoke emissions, it is assumed that the TFC value from the FBP system represents flaming combustion, while the difference between the TFC and the FFFC captures smoldering combustion.
At the start of each FireWork run, the most recent fire activity information produced by the CWFIS is fetched. With FireWork initialization for the 12 UTC and 00 UTC, these generally correspond to CWFIS data from 13:30 UTC and 01:30 UTC, respectively. By sampling the CWFIS spatial data for each detected hotspot in real time, fuel type and fuel consumption estimated with forecast meteorology for the period are obtained. This information and the estimated fire size and fire location are incorporated as part of the FireWork emissions processing system. In order to convert the different fuel-consumption values from CWFIS to actual emissions, the Fire Emission Production Simulator (FEPS), a component of the BlueSky Modeling Framework (Larkin et al., Citation2009), is then applied to determine the daily total emissions per hotspot. The FEPS model uses the fuel type and the flaming and smoldering fuel consumptions to estimate hourly emissions of pollutants over the life of the burn.
As a last step to prepare model-ready input emissions for FireWork, the SMOKE emissions processing system is run to convert the daily total emissions per hotspot into the GEM-MACH major-point-source format, which provides hourly, chemically speciated, and grid-cell-specific emissions. Currently, the diurnal profile that is applied to convert daily emissions to hourly emissions is the SMOKE default profile for wildfire emissions, which is based on a study by the Western Regional Air Partnership (WRAP, 2005). This profile, for the state of Minnesota, assumes peak emissions (50.8%) between 10:00 and 19:00 local time, and lower values for the rest of the day and at night, following typical planetary-boundary-layer evolution. However, it is worth noting that a recent study by Saide et al. (Citation2015) suggests that the profile may over-emphasize afternoon emissions. The fire emissions from FEPS are also chemically speciated using default wildfire speciation profiles in SMOKE that are obtained from the U.S. EPA’s SPECIATE4.3 database (http://www.epa.gov/ttn/chief/software/speciate). The resulting speciation for bulk PM emissions from fires into chemical components is primary organic matter (79%), crustal material (10%), and elemental carbon (9%), with the remainder assigned to ammonium and sulfate. Apart from PM estimates, FireWork is also provided with VOC, NOx, SO2, CO, and NH3 estimated emissions from wildfires.
The final set of processed day-specific biomass burning emissions is provided to GEM-MACH in a combined daily point-source emissions file together with anthropogenic point-source emissions. This procedure allows FireWork to use the same emissions input infrastructure as the RAQDPS, except for the inclusion of NRT biomass burning emissions. Fire emissions are currently handled in the same way as anthropogenic major point source type, using the Briggs plume-rise parameterization to vertically redistribute the emissions (Briggs, Citation1975). This was done to facilitate the initial implementation of biomass burning emissions into an operational system, but it should be noted that there are studies that suggest that the Briggs scheme may not be applicable to fire emissions (Heilman et al., Citation2014; Session et al., Citation2011; Freitas et al., Citation2007).
FireWork air quality forecast products
The fact that the only difference between FireWork and the operational RAQDPS is the inclusion of wildfire emissions in FireWork means that any differences in concentration forecasts between the two systems are due solely to biomass burning emissions. Surface PM2.5 and PM10 concentration difference plots thus provide a straightforward way to determine the location, strength, and arrival and departure times of smoke plumes from individual hotspots or groups of hotspots as determined by CWFIS.
FireWork forecasts are available at approximately the same time as operational AQ forecasts from the RAQDPS. This makes it possible to produce additional forecast products related to PM2.5 and PM10 concentrations from FireWork, specifically addressing PM contributions from biomass burning. These products were developed at the request of ECCC operational AQ forecasters to help with preparing AQ forecasts and related advisories. These additional FireWork products include the following:
Surface PM2.5/PM10 maps and animations based on FireWork–RAQDPS differences,
Surface PM2.5/PM10 maps of the 24-hr sum of FireWork–RAQDPS differences.
Surface PM2.5/PM10 maps of the 24-hr mean of FireWork–RAQDPS differences.
PM2.5/PM10 total column maps and animations based on FireWork–RAQDPS differences.
Location-specific hourly AQHI, PM2.5, and PM10 values based on FireWork forecasts.
Maps of the surface PM2.5/PM10 concentrations with UMOS-AQ/MIST correction applied to the non-fire-related PM concentration.
Alternate RDAQA objective analyses for PM2.5 and PM10 based on FireWork output (RDAQA-FW).
CWFIS hotspot images showing current (last 24 hr) and recent (last 7 days) wildfires.
The first of the products just described isolates wildfires smoke plumes from PM contributed by other PM sources. The second and third products show the total area impacted by wildfire smoke over a 24-hr period and the magnitude of this impact, respectively. The total column maps indicate the total area affected by wildfire smoke transport even if the smoke does not mix to the surface everywhere, and provide an alternate way of reducing uncertainties associated with biomass burning plume-rise parameterization. The alternate hourly AQHI, PM2.5, and PM10 values include the contribution of smoke from wildfires, which is missing from the RAQDPS forecasts; if the FireWork forecast is accurate, then these alternate values are much more representative of actual health risks. The sixth product is obtained from RAQDPS UMOS-AQ/MIST PM2.5/PM10 fields and PM2.5/PM10 FireWork–RAQDPS differences, where the acronym MIST stands for Moteur d’Interpolation STatistique, an ECCC statistical interpolation package that uses the optimal-interpolation algorithm described by Mahfouf et al. (Citation2007) to interpolate UMOS-AQ predictions to locations without AQ measurement stations. The RDAQA-FW analyses can adjust FireWork PM fields to account for FireWork under- or overpredictions. Lastly, CWFIS composite hotspot images provide accurate information about locations of past and recent fire activity and the spatial variability of hotspot distributions across North America.
2015 FireWork performance analysis
2015 wildfire season
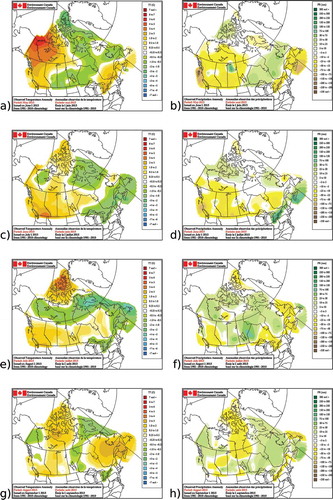
Weather conditions are an important factor in wildfire activity, from ignition (e.g., lightning from thunderstorms) to fire intensity and burn size (e.g., influence of winds, soil moisture, and precipitation). According to the Canadian Interagency Forest Fire Centre (CIFFC; http://www.ciffc.ca), in terms of total area burned in Canada, 2015 was the sixth most intense wildfire season in the past 33 years. This is partly attributable to warm and dry conditions that persisted through most of the spring and summer seasons. shows objective analyses of the monthly temperature and precipitation anomalies over Canada for May–August 2015 as compared to a 30-year climatology (1981–2010). There was a persistent positive temperature anomaly ranging from 0.25ºC to 7ºC across the three western provinces of British Columbia (BC), Alberta (AB), and Saskatchewan (SK), and extending northward into the Yukon Territory (YT), the Northwest Territories (NWT), and western Nunavut (NU) at the beginning of the summer, although it moderated by August, with some regions in northern BC returning to climatology. Similarly, precipitation in western Canada was below average through the spring and early summer, with up to 50 mm less precipitation than normal in parts of BC and AB. Precipitation then increased by August, with BC and SK returning to near normal. Overall, meteorological conditions in western Canada were very favorable for wildfires through much of the 2015 fire season, with unusually warm and dry conditions in spring and early summer, but moderating by the second half of August with precipitation closer to climatology.
Figure 3. Left column shows mean temperature anomalies from climatology (1981–2010) for May, June, July, and August 2015 (panels (a), (c), (e), (g)). Right column shows the corresponding precipitation anomalies from climatology (panels (b), (d), (f), (h)).
The prevalence of fire weather in 2015 contributed to extreme fire activity in Canada. Across the country, close to 4 million ha were consumed by fire, with the province of SK accounting for 45% of the total area burned, followed by 17% in the NWT. The westernmost provinces of BC and AB also experienced record high fire activity, with more than 1,810 and 1,698 wildfire events, respectively, as compared to a 25-year average of 967 and 676 fires per year (CIFFC, 2015). Given this significant fire activity, the availability of FireWork forecasts, and the availability of surface PM2.5 measurements in western Canada, the summer of 2015 is an excellent period to assess the performance of the FireWork system.
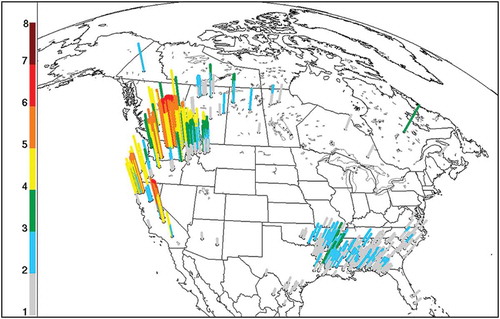
Fire intensity is measured as the rate of heat energy released per length of fire front. In the CWFIS parameterization, this quantity is correlated with the TFC per detected fire hotspot. Fire is more intense and corresponds to higher fuel consumptions in areas with favorable meteorological conditions combined with low fuel moisture and abundant fuels with tree types such as mature spruce or pine forest groups that can produce crown fires. For the period between June 2 and August 31, the cumulative TFC and monthly fire activity, as reported by CWFIS, is shown on A threshold filter is applied to show only those high-intensity events with TFC greater than 1 kg m−2. Recorded fire activity corresponds very closely to areas with favorable weather conditions. Fire activity was high across most of BC, northern AB, and central SK in June and July, but decreased rapidly in August. Many of the fires in western Canada were intense fires with high fuel consumption and TFC values exceeding 4 kg m−2. By contrast, fire activity was much lower and less extreme in eastern Canada (Ontario and Quebec) as result of cooler than normal temperatures and higher precipitation in the summer ().
Figure 4. Total fuel consumption (TFC) per hotspot (kg m−2) for the period from June 2 to August 31, 2015, as reported by CWFIS (a), and the month when fire was first reported (b). A threshold where TFC > 1.0 kg m−2 is applied.
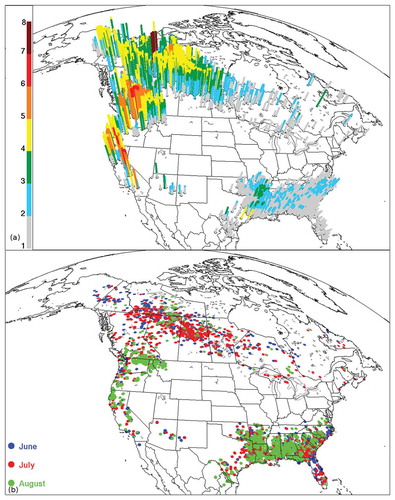
Fire regimes and fire activity were similar in the United States, with large fires recorded in the western United States and numerous smaller ones in the southeastern United States. Significant fire activity was recorded by CWFIS in August in northern Washington State, Idaho, and Montana, with TFC reaching 6 kg m−2. Very large fires were also recorded for northern California in Shasta, Trinity, and Humboldt counties, with TFC above 4 kg m−2. Numerous fires also occurred throughout the summer in the southeastern states, but most of these fires were small with TFC less than 2 kg m−2.
It is important to note that even though CWFIS estimates fire activity across the entire North American continent, the calculation of total fuel consumed can be different between the United States and Canada. This was due to differences in the underlying fuel categories used in the CWFIS for the two countries. For the 2015 FireWork simulations, CWFIS fuel map in the United States was based solely on NALCMS land cover without ecosystem- or forest inventory-specific adjustments. Land-use categories in NALCMS were reclassified into one of the 16 existing Canadian fuel types in the FBP’s System fuel map. In some cases assignments can be unsuitable, thus resulting in underestimations of TFC for similar fire weather conditions. One example can be found in for the state of Alaska (AK). Most of the state is mapped in CWFIS to one of two fuel types, either to a low-vegetation category attributed to tundra or barren ground, similar to grass type and with low fuel loading, or else to a spruce–lichen woodland category, which contains open spruce forest with low accumulated surface fuel and is less prone to crown fires. Both of these fuel types produce low fire spread and low TFC. Given the observed high-intensity fires that occurred in AK in 2015 (Alaska Interagency Coordination Center [AICC], 2015), this fuel mapping is likely incorrect and resulted in an underestimation of TFC. A new forest inventory for AK was recently applied to replace much of the low-vegetation class with the boreal spruce fuel type. This new update together with other fuel map revisions will be implemented in the 2016 fire season but has not been incorporated in this study.
FireWork performance analyses for the 2015 fire season
In 2015, FireWork was run for the period from June 2 to November 1. In this study, we focus on model performance during the peak wildfire season from June 2 to August 31. PM2.5 values were extracted from FireWork hourly forecasts for those grid cells that contain surface measurement stations reporting either to AIRNow (http://www.airnow.gov) or directly to the Canadian Centre for Meteorological and Environmental Prediction. These are measurements from the U.S. EPA Air Quality System (AQS) or the Canadian National Air Pollution Surveillance (NAPS) measurement networks. Pairing corresponding model values with NRT hourly measurement values was performed using the Verification of Air QUality Models (VAQUM) geospatial database system (Chen et al., Citation2010). In total, 770 PM2.5 surface measurement stations reported data during the 3-month period that were available for model evaluation using VAQUM. A completeness criterion requiring the number of valid measurements for a station to be at least 50% of the number of possible measurements was then applied to select the stations that were used for the evaluation. This criterion ensures that the stations considered are representative for the evaluation period and the measurement data set is relatively homogeneous in time. The locations of the 750 measurement stations that met this completeness criterion are shown in ; the four North American subregions for which model performance statistics were calculated are also shown in this figure.
Forecast results for this period from the RAQDPS, which did not consider NRT biomass-burning emissions, were also benchmarked in the same manner as FireWork. Comparing the statistics between FireWork and RAQDPS allowed a direct assessment of the impact of the NRT biomass-burning emissions used in the FireWork system on AQ forecasts.
summarizes the PM2.5 forecast performance for the two systems. The average PM2.5 concentration difference between FireWork and RAQDPS represents the modeled biomass-burning emission contributions to surface PM2.5 over the analysis period. Across the entire model domain, biomass burning contributed an average of 1.21 µg m−3 of surface PM2.5 concentrations. As expected from , this contribution is significantly larger over western North America, with differences of 3.10 µg m−3 for western Canada, and 2.24 µg m−3 for the western United States, compared to only 0.50 µg m−3 and 0.39 µg m−3 for eastern Canada and the eastern United States, respectively.
Table 1. RAQDPS and FireWork hourly performance statistics for surface PM2.5 for Canada and United States for period from June 2 to August 31, 2015.
Overall, FireWork showed better scores than RAQDPS for mean bias (MB) and the Pearson correlation coefficient (R), while unbiased root mean square error (URMSE) scores are very similar between the two systems. Performance differences are larger for the western regions, which experienced greater fire activity. Although FireWork still underpredicted mean surface PM2.5 concentration, the overall forecast performance increased with improved MB and better correlation with measurements.
Another routine evaluation tool is categorical comparisons, which are used to examine model skill in forecasting extreme values greater than a specified threshold. For PM2.5, a threshold of 30 µg m−3, the Canadian 24-hr PM2.5 standard prior to 2013, was selected. As shown in , an extreme-value forecast is considered correct, or a “hit,” when both measured and forecast PM2.5 surface concentrations are greater than or equal to 30 µg m−3. It is a “miss,” though, when the forecast value is below the threshold but the measured concentration exceeds it; it is a “false alarm” when the forecast concentration exceeds the threshold, but the observed concentration is less than the threshold.
Table 2. Categorical score definitions.
Three common categorical scores were considered: probability of detection (POD), false alarm ratio (FAR), and critical success index (CSI) (Mason, Citation2003; Stanski et al., Citation1989). They are defined as follows:
where Hit, Observed, False Alarm, Forecasted, and Miss represent the number of data pairs belonging to each of these categories. shows the categorical scores for the 3-month analysis period. Overall, FireWork had better categorical scores than the RAQDPS, with some large improvements in CSI and POD, and reductions in FAR. The improvements were again larger in western Canada and the western United States, where fire activity was much higher than in the eastern half of the continent. However, FireWork categorical scores for eastern Canada and the eastern United States were either unchanged or slightly improved when compared with those from RAQDPS, suggesting that the inclusion of NRT biomass-burning emissions in FireWork did not cause a deterioration in performance in areas with low fire activity.
Table 3. RAQDPS and FireWork categorical scores based on hourly PM2.5 forecast and concentration threshold of 30 µg m−3 for Canada and United States for period from June 2 to August 31, 2015.
FireWork performance analyses for the June 24 to July 15 period
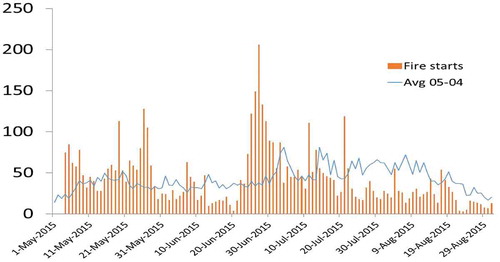
A first case study chosen to examine FireWork performance in more detail is the 3-week period from June 24 to July 15, when significant fire activity with high TFC was recorded by CWFIS (). The majority of Canadian wildfires in the 2015 season occurred during this period (), with high fire activity in western Canada, mainly in northern SK and AB but also in BC and the NWT. The number of new fires reported across Canada was consistently higher than the 10-year mean, with peak activity between June 26 and June 28, when more than 133 new fires per day were reported, compared to an average of about 35 new fires per day over the past 10 years (). Such high fire activity provided a good opportunity to stress test the experimental FireWork system.
Figure 5. Total fuel consumption (TFC) per hotspot (kg m−2) for the period from June 24 to July 15, 2015, as reported by CWFIS.
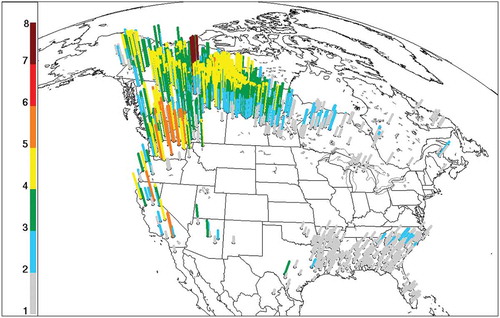
Figure 6. Number of wildfires started by day in Canada for the months of May, June, July, and August. The blue line represents values from a 10-year mean (2005–2014) (CIFFC, 2015).
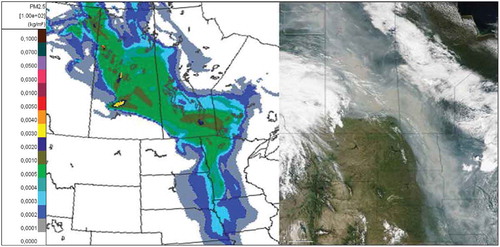
It is important to note that in early July it was discovered that when the number of hotspots per FireWork simulation exceeded a threshold of approximately 3,500, a fraction of daily hotspots, ranging from 10 to 50%, were dropped in order to keep up with operational run-time constraints on delivering forecast results. This system error was then corrected for FireWork runs after July 20, 2015. Despite the fact that a fraction of reported hotspots were excluded during this period, FireWork continued to provide useful PM2.5 forecast guidance across the fire-plume-impacted regions. shows a comparison of the forecast PM2.5 column total difference field between FireWork and RAQDPS against a true-color satellite image from the NOAA MODIS instrument valid for June 29. The MODIS snapshot shows a dense smoke plume covering SK and southern Manitoba, extending into the eastern Dakotas and western Minnesota in the central United States, and reaching as far south as northern Kansas and Missouri. This regional smoke-plume distribution was well represented by the FireWork forecast made the previous day. The model showed a very similar PM2.5 spatial distribution pattern, albeit with lesser southerly extent and lower spatial variability along the plume edge.
Figure 7. Total column PM2.5 concentration (left) forecast by FireWork (2015-06-28 00 UTC run), valid at June 29, 12 UTC, and (right) true color satellite image for June 29. Source: NASA Earth Observatory (http://earthobservatory.nasa.gov/NaturalHazards/view.php?id=86151).
and summarize the model performance statistics and categorical scores, respectively, for this analysis period. Quantitatively, FireWork model performance against hourly surface PM2.5 measurements was significantly improved when compared with the RAQDPS. For example, the PM2.5 correlation coefficient for western Canada, where fire emissions were large, was 0.50 for FireWork versus 0.03 for the RAQDPS. However, both systems underpredicted surface PM2.5 levels in western Canada, with MB values of –7.28 µg m−3 and –11.72 µg m−3 for FireWork and the RAQDPS, respectively. Part of the FireWork PM2.5 underprediction during this period may be due to the erroneous system limit on the number of CWFIS-reported hotspots that were considered. Similarly, FireWork outperformed the RAQDPS for all three categorical scores. In western Canada, POD increased from 0% to 26% and CSI increased from 0% to 23%, while FAR decreased from 96% to 34%. It is clear that in a period where there were large biomass-burning contributions to surface PM2.5 concentrations, the forecast system without biomass-burning emissions demonstrated no skill at forecasting occurrences of PM2.5 above the 30 µg m−3 threshold.
Table 4. RAQDPS and FireWork hourly performance statistics for surface PM2.5 for Canada and United States for period from June 24 to July 15, 2015.
Table 5. RAQDPS and FireWork categorical scores based on hourly PM2.5 forecast and concentration threshold of 30 µg m−3 for Canada and United States for period from June 24 to July 15, 2015.
The model estimate of the average contribution of fire emissions to surface PM2.5 loading over North America during the 3-week analysis period is presented in . This field was calculated as the average surface concentration difference between FireWork and RAQDPS forecasts. Large areas are shown to be impacted by fire plumes with accompanying high surface PM2.5 concentrations. As expected, the most heavily affected area is near the high-fire-activity region in central SK (see ), where the estimated wildfire contribution exceeded 30 µg m−3. Contributions were also high, up to 10 µg m−3, in neighboring provinces and northern U.S. states such as Montana and North Dakota.
Figure 8. Forecast wildfire emissions contribution to average surface PM2.5 concentrations (µg m3) for the period from June 24 to July 15, 2015. Graphical insert shows the zoomed region and measurement stations used for time-series analysis in .
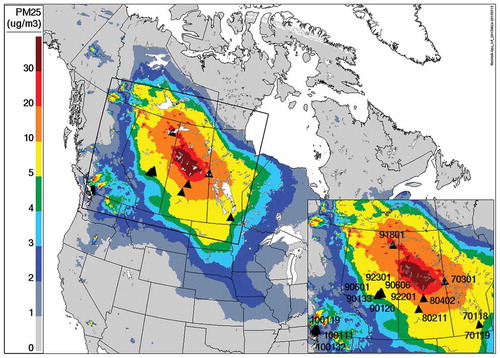
Figure 9. (a) Forecasted wildfire emissions contribution to average surface PM2.5 concentrations (μg m−3) at measurement stations, calculated by subtracting RAQDPS values from FireWork values, and (b) forecast PM2.5 correlation coefficient differences (FireWork – RAQDPS) when compared with hourly surface measurements for period from June 24 to July 15, 2015.
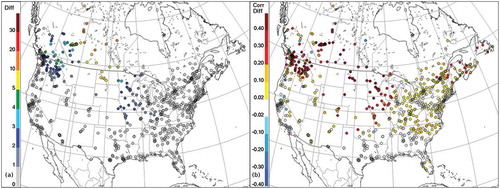
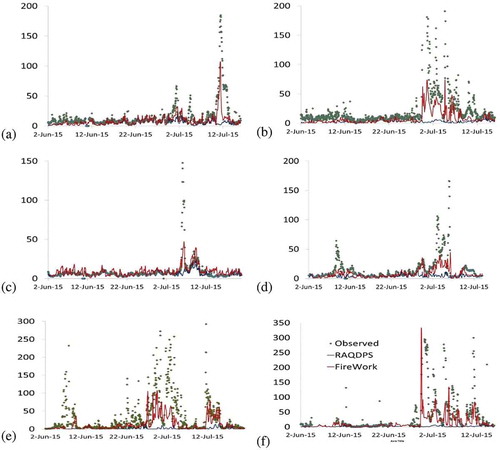
Figure 10. Time series of forecast and observed hourly PM2.5 surface concentrations (µg m3) in (a) Edmonton, AB (NAPS station 90120, 92201, 90601, 90606, 91101, 90133, 90130, 90121, and 92301), (b) Saskatoon, SK (NAPS station 80211), (c) Vancouver, BC (NAPS stations 100111, 100132, 100125, 100110, 100128, 100140, 101202, 100119 and 100134), (d) Winnipeg, MB (NAPS stations 70118 and 70119), (e) Fort Chipewyan, AB (NAPS station 91801), and (f) Prince Albert, SK (NAPS station 80402). FireWork forecasts are shown in red, RAQDPS forecasts are shown in blue, and observed concentrations are indicated by green points.
A related analysis to the plot of wildfire contributions to surface PM2.5 shown in is presented in , but for individual PM2.5 measurement stations across North America. shows a corresponding plot of station-specific correlation-coefficient differences between FireWork and RAQDPS. FireWork had better forecasts of temporal variability across almost all stations in the domain, but the improvements were larger for stations that had higher PM2.5 impacts from fire emissions. Nevertheless, minor improvements of between 0.02 and 0.20 were also realized for stations further away from areas of fire activity in eastern North America.
Four major Canadian urban centers, Edmonton, Saskatoon, Vancouver, and Winnipeg, were heavily impacted by smoke from wildfires during this period, with measured mean hourly surface PM2.5 concentrations exceeding 150 µg m−3. These mean hourly surface PM2.5 concentrations in each city were obtained by averaging measurements from all stations located within a 25-km radius of the city center: Nine stations were considered for Edmonton, one for Saskatoon, nine for Vancouver, and two for Winnipeg. – shows the mean measured hourly PM2.5 concentration time series for these four cities together with a continuous sequence of 12-hr PM2.5 forecasts from both FireWork and RAQDPS. Wildfire impacts on surface PM2.5 concentrations are generally associated with a sudden spike in observed PM2.5 concentrations and large concentration differences between FireWork and RAQDPS. shows that FireWork, but not the RAQDPS, was able to capture sudden onsets of elevated surface PM2.5 events as a result of wildfire plume impingements. The event timing was well represented for all four cities, although FireWork consistently underpredicted the observed peak PM2.5 concentrations. The measured maximum hourly PM2.5 concentrations over the period for Edmonton, Saskatoon, Vancouver, and Winnipeg were 183 µg m−3, 191 µg m−3, 148 µg m−3, and 166 µg m−3, respectively, whereas FireWork forecast hourly peak PM2.5 concentrations of 108 µg m−3, 73 µg m−3, 47 µg m−3, and 45 µg m−3.
Similar behavior was found at three other measurement stations in western Canada where hourly PM2.5 concentrations reached or exceeded 300 µg m−3: Fort Chipewyan, AB; Prince Albert, SK; and Flin Flon in Manitoba. Hourly PM2.5 concentration time series for Fort Chipewyan and Prince Albert are also shown in . Maximum hourly measured PM2.5 concentrations for this period were 292 µg m−3 and 300 µg m−3, respectively, compared to FireWork forecast period-maximum PM2.5 concentrations of 108 µg m−3 and 333 µg m−3. The Flin Flon station did not have observations for the period July 5–14 and hence is not presented in , but for the period June 24–July 5 the maximum hourly measured PM2.5 concentration at this station was 281 µg m−3 as compared to the FireWork forecast maximum of 127 µg m−3.
FireWork performance analysis for the August 15–31 period
The 2-week period of August 15–31 was chosen for a second case study. This period is marked by the most intense wildfires in terms of highest estimated TFC values from CWFIS over the entire 2015 fire season. These large fires took place in northern Washington state, northern Idaho and Montana, and parts of the southern BC interior (). These fire events contributed to very high PM2.5 loading across the region and resulted in several stations measuring peak hourly PM2.5 concentrations reaching or exceeding 200 µg m−3.
Figure 11. Total fuel consumption (TFC) per hotspot (kg m−2) for the period from August 15 to August 31, 2015, as reported by CWFIS.
PM2.5 forecast performance statistics and categorical scores for FireWork and RAQDPS for this period are summarized in and . Similar to the first case study, FireWork improved MB and R statistics as well as all three categorical scores for both the western United States and western Canada. In the western United States, FireWork reduced the MB from –12.23 µg m−3 in RAQDPS to –3.96 µg m−3, whereas in western Canada, FireWork had a slight overprediction, with a MB of 3.10 µg m−3 versus a MB of –5.80 for RAQDPS. The one exception is URMSE, where FireWork showed slightly higher error than RAQDPS in both regions.
Table 6. RAQDPS and FireWork hourly performance statistics for surface PM2.5 for Canada and United States for period from August 15 to August 31, 2015.
Table 7. RAQDPS and FireWork categorical scores based on hourly PM2.5 forecast and concentration threshold of 30 µg m−3 for Canada and United States for period from August 15 to August 31, 2015.
The model estimate of the average contribution of fire emissions to surface PM2.5 loading during this period is presented in . Very high PM2.5 loadings, exceeding 30 µg m−3, were estimated for regions with active fires: northeastern Washington State, northern Idaho, and southern BC. Loadings over 5 µg m−3 extended northeast over much of Montana and southern AB and SK. Two additional areas with PM2.5 loadings of more than 30 µg m−3 PM2.5 can also be seen in California as a result of separate large fires in Trinity and Fresno counties. Overall, fire activity during this 2-week period was estimated to contribute to elevated surface PM2.5 loading over large areas of the Pacific Northwest and southwestern Canada.
Figure 12. Forecast wildfire emissions contribution to average surface PM2.5 concentrations (µg m3) for the period from August 15–31, 2015. Time series for the selected stations, presented on the zoomed image, are presented on .
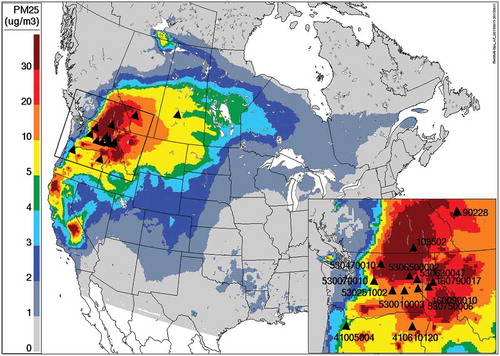
Figure 13. Same as , but for period August 15–31, 2015.
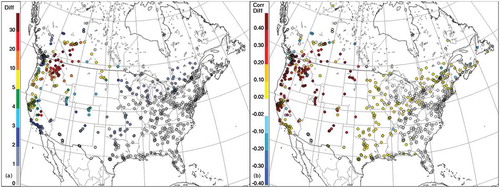
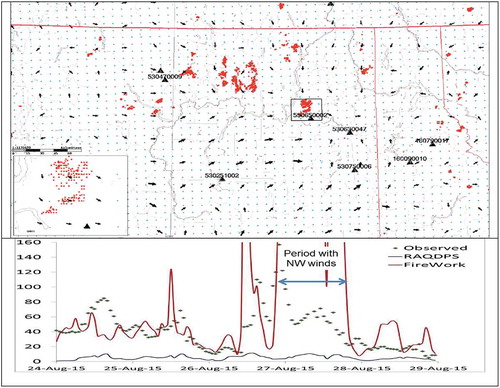
Figure 14. Upper figure represents forecast surface wind vectors and locations of FireWork hotspots (in red) valid at August 27, 06UTC. Blue dots represent FireWork model grid cell centers. Bottom figure represents time series of forecast and observed hourly PM2.5 surface concentrations (µg m3) for the Willpinit station (AQS station: 53060002). FireWork forecasts are shown in red, RAQDPS forecasts in blue, and the observed concentrations are in green points.
The PM2.5 contribution from wildfires at individual stations is shown in together with the correlation-coefficient differences between FireWork and RAQDPS at these same stations when forecast PM2.5 concentrations were compared against surface measurements (). It is evident from this figure that FireWork showed improved skill in forecasting temporal variability for stations closer to areas with high fire activity. FireWork’s R values for some AQS measurement stations in Washington State, northern Idaho, and California were more than 0.30 higher than corresponding RAQDPS values. Improvements in forecast PM2.5 correlation continued to be positive for stations further downwind from sources of fires, extending to central and eastern Canada. These results suggest the importance, and strong influence of, source emissions on PM2.5 forecast skill over a regional CTM domain.
The higher error in FireWork forecast performance in this period compared to the first case study may be partly explained by the occurrence of extreme fire intensities during the August 15–31 period, which resulted in very high TFC values and thus high rates of PM emissions at individual hotspot locations. Fire emissions were included in FireWork as point sources (see second section). These emissions were assigned to specific grid cells, and their plume rise was parameterized with an algorithm more appropriate for anthropogenic facilities. With a model grid spacing of 10 km, in regions of complex topography, errors in meteorology, particularly when sources are close to receptor locations, can cause large directional errors in modelled plume dispersion. This can lead to higher model errors as a consequence of predicted plumes either missing receptors altogether or causing unrealistically high PM2.5 concentrations when plume centerlines impact receptor locations. Furthermore, sub-grid-scale plume dispersion is not considered in the current model; without a plume-in-grid parameterization, emissions from point sources are assumed to be immediately and uniformly distributed across an entire grid cell, which results locally in an overprediction of the rate of dispersion and the zone of influence of the source.
An example of such local overpredictions can be seen during this period for an AQS measurement station at Willpinit Ford Rd, located about 50 km northwest of Spokane, WA (AQS station 530650002, latitude 47.89, longitude 117.99). shows the CWFIS-estimated hotspots for August 27 and the locations of the Willpinit and other nearby measurement stations. The insert in shows that fire hotspots were located within a grid cell from the Willpinit station under prevailing northwesterly winds. The resulting PM2.5 concentrations forecast for the day was extremely high, reaching 2,604 µg m−3, when the measured peak concentration was only 97 µg m−3. Large changes in forecast PM2.5 concentration were observed that were associated with shifting wind direction throughout the period. Forecast concentrations were heavily influenced by meteorological conditions close to the fire locations and peak PM2.5 concentrations were overpredicted for many stations. However, not all stations showed PM2.5 overpredictions at this time. For example, the Monroe Street station in Spokane, WA (AQS station ID 530630047: latitude 47.70, longitude 117.43), had an underprediction of the daily peak on August 27, with a FireWork PM2.5 concentration of 100 µg m−3 versus an observed peak concentration of 153 µg m−3. Given the proximity of several large fires close to measurement stations, uncertainties in fire-related PM emissions, and errors in plume dispersion, FireWork showed higher PM2.5 URMSE values than the RAQDPS for this period. Furthermore, intense heat fluxes from some fires were likely to influence local meteorology, causing pyroconvective events (Gatebe et al., Citation2012). These feedbacks are not currently accounted in FireWork.
– presents mean hourly time series of measured PM2.5 concentrations and the corresponding sequences of 12-hr forecasts from FireWork and RAQDPS for selected cities and stations with high PM2.5 influence from fire events for the August 15–31 period. In Canada, the station with the highest observed PM2.5 hourly concentration was at Castlegar, BC, which is located about 150 km southeast of Kelowna and 30 km north of the U.S. border. This station had a measured peak PM2.5 concentration of 243 µg m−3, while FireWork overpredicted with a peak value of 403 µg m−3. The cities of Calgary, AB, and Saskatoon, SK, were also heavily affected by fire plumes, with observed PM2.5 concentrations above 65 µg m−3. The PM2.5 concentration time series for these cities are based on measurements at two stations and one station, respectively, considering those stations within a 25-km radius of the city center. Measured peak PM2.5 concentration values were 184 µg m−3 and 67 µg m−3 for Calgary and Saskatoon, respectively, while FireWork overpredicted for both cities with peak predicted PM2.5 values of 284 µg m−3 and 91 µg m−3, respectively.
Figure 15. Time series of forecast and observed hourly PM2.5 surface concentrations (µg m3) in (a) Castlegar Zinio Park (NAPS station 103502) near Kelowna, BC, (b) Saskatoon, SK (NAPS station 80211), (c) Calgary, AB (NAPS stations 90228 and 9022), and AQS stations in the U.S.: (d) Spokane, WA (AQS station 530630047), (e) Winthrop, WA (AQS station 530470010), (f) Moses Lake, ID (AQS station 530251002), (g) Cove, OR (AQS station 410610120, (h) Willpinit, WA (AQS station 530650002), (i) Portland, OR (AQS stations 41005004 and 4100510080), and (j) Saint Maries, ID (AQS station160090010). FireWork forecasts are shown in red, RAQDPS forecasts are shown in blue, and observed concentrations are indicated by green points.
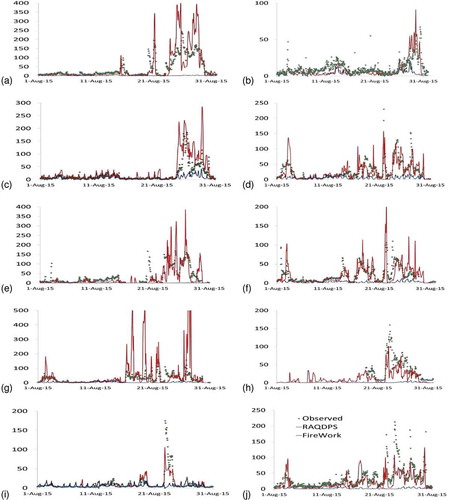
In the United States, our analysis focused on 18 AQS stations, six in Oregon, eight in Washington, and four in Idaho. These stations were selected by choosing all PM2.5 stations located within a 200-km radius centred on the western U.S. area most affected by wildfires during this period. shows PM2.5 concentration time series for seven of these selected AQS stations. The measured maximum hourly PM2.5 concentration over this period for the stations at Spokane, Winthrop, Moses Lake, and Willpinit in Washington State, at Cove and Portland in Oregon, and at Saint Maries in Idaho are 229 µg m−3, 166 µg m−3, 110 µg m−3, 160 µg m−3, 160 µg m−3, 174 µg m−3, and 213 µg m−3, respectively, while FireWork forecast hourly peak PM2.5 concentrations of 158 µg m−3, 383 µg m−3, 213 µg m−3, 2604 µg m−3, 102 µg m−3, 106 µg m−3, and 132 µg m−3. For most of these stations, FireWork produced mixed results, with daily peak values either largely overpredicted, or missed altogether. Nevertheless, these time series also show that FireWork is generally able to predict the timing of wildfire smoke events at particular locations.
Discussion and future work
It is clear from the performance evaluation shown in the previous section that the inclusion of NRT biomass-burning emissions can improve AQ forecast skill significantly during the wildfire season. Moreover, the case studies presented in the third section provide clear evidence that every summer the inhabitants of major North American population centers may be exposed to unhealthy levels of air pollution due to wildfire smoke, particularly in the West. However, as FireWork was built as a spin-off of the Canadian operational regional AQ forecast model, it benefited from the comprehensive representation of aerosols and detailed meteorological and chemical processes found in the RAQDPS. However, as one of the first operational AQ forecast models to include NRT biomass-burning emissions, a number of compromises were made in the development of FireWork in terms of both emissions processing and process algorithms in order to deliver it for initial testing. Here are some of the known limitations of the current approach:
Some fires may be undetected as satellite remote sensing is limited by cloud cover.
Hotspot algorithms have sensitivity issues (active burning emissions vs. smoldering emissions) and temporal limitations (satellite overpasses occur over North America either in late morning or early afternoon).
Fires starting after satellite overpasses will not be considered until the next day.
A uniform burn area per detected fire event is applied.
Emission factors used to estimate wildfire emissions have large uncertainties.
A basic plume-rise algorithm (Briggs) developed for smokestack emissions is applied for wildfire emissions.
No modeling of fire spread/growth is included, only an assumed diurnal pattern.
Fire suppression activity (i.e., “fire fighting”) is not accounted for.
The impact of fire activity on meteorology is not taken into account. Intense wildfires can affect the weather, with important releases of heat and water vapor generating strong updrafts and horizontal winds. The magnitude of the meteorological impact is correlated with the intensity of the fires.
PM2.5 observations are frequently unavailable or less accurate when heavily affected by wildfire smoke, making AQ forecast performance analysis more difficult and less precise.
Despite these simplifications and limitations, overall performance in forecasting PM2.5 concentrations has shown significant improvements with FireWork when compared to RAQDPS. From the perspective of delivering a national AQ forecast program, the FireWork system has demonstrated an ability to add value to the existing forecast guidance tools.
Also, this study focused entirely on PM2.5 forecasts. Biomass burning emits many other pollutants and pollutant precursors, including NOx, VOC, CO, and NH3, that are also likely to impact AQ. FireWork currently does include emissions of these other pollutants and it does model their transport, chemical transformation, and removal, but more work is required to evaluate their impact on observed AQ levels of such species as O3 and NO2 and secondary PM. More work is also required on retrospective evaluations of FireWork, where a wider range of quality-assured AQ measurements, including speciated PM2.5 measurements of such chemical components as elemental carbon and organic carbon, can be considered.
Going forward, the next release of both the RAQDPS and FireWork will likely include a major update to the model source code. RAQDPS and FireWork versions that have been used to date were built on version 3 of the GEM numerical weather prediction model. However, a new generation of the GEM model, version 4, has been available for several years and a GEMv4-based version of the RAQDPS source code has been developed and is currently under testing. Work is also underway on an improved plume-rise algorithm for wildfire emissions. Also, research on different approaches to estimate wildfire emissions are also underway. For example, ECCC is testing U.S. Forest Service (USFS) estimates of biomass-burning emissions for the United States, as our objective is to use USFS wildfire emissions estimates for the U.S. and CWFIS emissions for Canada.
Active research is also under way toward establishing a comprehensive chemical data assimilation system as part of ECCC’s chemical composition model systems strategy. The chemical data assimilation system, based on an optimal interpolation scheme, will ultimately improve atmosphere chemical forecasts by assimilating NRT measurement data from across North America, including Canadian and U.S. surface measurements and satellite measurements of such quantities as O3, NO2, and SO2 tropospheric vertical column density and aerosol optical depth.
Conclusions
The FireWork North American AQ forecasting system with NRT biomass-burning emissions has been under development since 2011at ECCC, and it has been run experimentally twice per day since 2013 to provide 48-hr forecasts during the wildfire season. FireWork is very closely related to ECCC’s existing operational AQ forecasting system, the RAQDPS, and differs only in the inclusion of biomass-burning emissions. The NRT estimates of biomass-burning emissions input to FireWork are obtained using fuel-consumption values from the CWFIS and emission factors from the Fire Emission Production Simulator, a component of the BlueSky Modeling Framework. This paper has examined the performance of FireWork PM2.5 forecasts during the 2015 Canadian wildfire season in both Canada and the United States and has compared those forecasts with forecasts made by the RAQDPS, which does not consider NRT biomass-burning emissions.
From an operational AQ forecasting perspective, this evaluation has shown FireWork to be a very useful tool for forecasting wildfires impacts on AQ, surface level PM2.5. Significant improvements were observed for FireWork for most hourly PM2.5 continuous and categorical statistics presented in this work as compared to RAQDPS statistics for the period June 2– August 31, 2015. These improvements included the correlation coefficient R for every region and every period considered in this study. For western Canada and the western United States, the regions most heavily affected in 2015 by smoke from wildfires, values of R for RAQDPS and FireWork were 0.09 versus 0.49 in western Canada and 0.09 versus 0.42 in the western United States. Mean bias was generally reduced with FireWork, but peak concentrations can be either overpredicted or underpredicted, sometimes by large amounts. Regional URMSE statistics were mixed, but URMSE differences between FireWork and RAQDPS were generally not very significant. A closer analysis indicates, however, that an improvement was seen in URMSE scores for most western stations, but greatly deteriorated for a few stations with high overpredictions. FireWork also outperformed the RAQDPS in forecasting PM2.5 concentrations above 30 µg m−3 for three categorical scores: POD, FAR, and CSI. POD and CSI values were higher and FAR values were lower for FireWork versus RAQDPS. Forecasting such extreme pollution events is an important objective for operational AQ forecasting.
The very close relationship between FireWork and the RAQDPS and the fact that they are run in tandem means that the differences between their forecasts are due entirely to biomass-burning emissions. This allows wildfire plumes to be identified and analyzed separately from other pollutant sources. Two periods from summer 2015, June 24–July 15 and August 15–31, were examined in more detail. The first period was dominated by wildfires in western Canada, while the second period was dominated by wildfires in the western United States. For both periods, smoke from wildfires was predicted to impact large portions of these two regions and also to be transported eastward into central and eastern North America. A comparison of modeled and observed time series of surface PM2.5 concentration at a number of individual AQ measurement stations showed very high observed values, ranging from 150 to 400 µg m−3, in a number of western Canadian and U.S. cities, including Vancouver, Edmonton, Calgary, Saskatoon, Spokane, WA, and Portland, OR. FireWork was able to forecast many of these site-specific PM2.5 pollution events in terms of both timing (i.e., arrival and departure times) and intensity, although the predicted peak PM2.5 concentration value was frequently overpredicted or underpredicted. The RAQDPS, on the other hand, was not able to predict any of these events, implicating wildfire emissions directly since both models considered the same anthropogenic pollutant emissions and predicted identical meteorological conditions.
The results presented in this work show the complicated relationship between wildfire emission estimates, model spatial resolution, forecast meteorology, and the parameterization used for wildfire pollution dispersion. In order to obtain more accurate AQ forecasts that take into account NRT biomass burning emissions, further improvements are needed to a number of FireWork system components, including the analysis of satellite measurements, the estimation of the magnitude and temporal behavior of wildfire emissions, the smoke plume-rise algorithm, local-scale transport and diffusion, and in-plume chemistry. In the meantime, ECCC AQ forecasters and other users of daily AQ prediction are already benefiting from FireWork forecasts, even while recognizing current limitations inherent in such AQ modeling.
Supplementary Material
Download Zip (16.9 KB)Acknowledgment
The ECCC FireWork team is very grateful to the Natural Resources Canada team behind CWFIS, who provided crucial assistance in the development of the FireWork system. We are particularly grateful to Peter Englefield, who provided useful analyses and guidance about the CWFIS system. We also thank the U.S. Forest Service BlueSky team, who helped us in building the FireWork system, and particularly Drs. Susan O’Neill and Tara Strand, who provided guidance about the BlueSky system and with different analyses, advice, and wildfire emission estimates for the United States. We are indebted as well to other members of ECCC’s Air Quality Modelling Applications Section team, particularly Hugo Landry, who worked on FireWork system optimization, Mourad Sassi, who helped us with the treatment of wildfire emissions, Samuel Gilbert, who helped us to analyze and evaluate model performance, and Jacinthe Racine, who helped us to analyze and visualize model results. Lastly, special thanks are due to Dr. Sylvie Gravel of ECCC’s Air Quality Research Division, for supporting this project, for helping us to analyze FireWork performance, and for providing comments on the paper.
Funding
This work was supported, in part, by the Canadian Safety and Security Program (CSSP-2012-CP-1182), which is managed by Defence Research and Development Canada’s Centre for Security Science.
Supplemental Material
Supplemental data for this article cab be accessed on the publisher’s website.
Additional information
Funding
Notes on contributors
Radenko Pavlovic
Radenko Pavlovic is a meteorologist in environmental applications in the Air Quality Modelling and Applications Section (AQMAS), Canadian Meteorological Centre Operations (CMCO), Environment and Climate Change Canada (ECCC), Montreal, Quebec, Canada.
Jack Chen
Jack Chen is a modeling scientist with the Air Quality Research Division (AQRD) of ECCC in Ottawa, Ontario, Canada.
Kerry Anderson
Kerry Anderson is a fire research scientist with the Canadian Forest Service, Natural Resources Canada, Edmonton, Alberta, Canada.
Michael D. Moran
Michael D. Moran is a research scientist with the AQRD of ECCC in Toronto, Ontario, Canada.
Paul-André Beaulieu
Paul-André Beaulieu is a scientific programmer analyst at the AQMAS, CMCO, ECCC, Montreal, Quebec, Canada.
Didier Davignon
Didier Davignon is acting chief of Data, Performance and Standards, CMCO, ECCC, Montreal, Quebec, Canada.
Sophie Cousineau
Sophie Cousineau is acting chief of the AQMAS, CMCO, ECCC, Montreal, Quebec, Canada.
Related Research Data
References
- Alaska Interagency Coordination Center. 2015. Alaska Interagency Coordination Center 2015 fall fire review statistics summary. http://fire.ak.blm.gov/predsvcs/intel.php (accessed December 2, 2015).
- Al-Saadi, J., A.J. Soja, R.B. Pierce, J. Szykman, C. Wiedinmyer, L. Emmons, S. Kondragunta, X. Zhang, C. Kittaka, T. Schaack, and K. Bowman. 2008. Intercomparison of near-real-time biomass burning emissions estimates constrained by satellite fire data. J. Appl. Remote Sens. 2(1): 021504. doi:10.1117/1.2948785
- Anderson, G.K., D.V. Sandberg, and R.A. Norheim. 2004. Fire Emission Production Simulator (FEPS) User’s Guide. USDA Forest Service 99, Seattle, WA. http://www.fs.fed.us/pnw/fera/feps/FEPS_users_guide.pdf
- Anderson, K.R., P. Englefield, J.M. Little, and G. Reuter. 2009. An approach to operational forest fire growth predictions for Canada. Int. J. Wildland Fire 18:893–905. doi:10.1071/WF08046
- Antonopoulos, S., P. Bourgouin, J. Montpetit, and G. Croteau. 2010. Forecasting O3, PM2.5 and NO2 hourly spot concentrations using an updatable MOS methodology. Proc. 31st NATO/SPS ITM on Air Pollution Modelling and Its Application, 27 September–1 October 2010, Turin, Italy.
- Briggs, G.A. 1975. Plume rise predictions. In Lectures on Air Pollution and Environmental Impact Analysis, D.A. Haugen, ed. 59–111. Boston, MA: American Meteorological Society.
- Canada Gazette. 2013. Amendment to Canadian Environmental Protection Act. Canada Gazette, Part I 147(21): 17–20, May 25. http://www.gazette.gc.ca/rp-pr/p1/2013/2013-05-25/html/notice-avis-eng.html#d106 (accessed December 13, 2015).
- Carolina Environmental Programs. 2012. Sparse matrix operator kernel emission. Modeling system. University of Carolina, Carolina Environmental Programs, Research Triangle Park, NC. https://www.cmascenter.org/smoke (accessed December 2, 2015).
- Charron, M., S. Polavarapu, M. Buehner, P.A. Vaillancourt, C. Charrette, M. Roch, J. Morneau, L. Garand, J.M. Aparicio, S. MacPherson, S. Pellerin, J. St-James, and S. Heilliette. 2012. The stratospheric extension of the Canadian global deterministic medium-range weather forecasting system and its impact on tropospheric forecasts. Month. Weather Rev. 140:1924–44. doi:10.1175/MWR-D-11-00097.1
- Chen, J., V. Bouchet, S. Cousineau, D. Davignon, A. Duhamel, S. Gilbert, S. Ménard, J. Racine, M. Samaali and M. Sassi. 2010. 2006 Annual operational evaluation of the Environment Canada Air Quality Modelling System. 9th CMAS Conference, Chapel Hill, NC. https://www.cmascenter.org/conference/2010/abstracts/chen_2006_annual_2010.pdf
- Canadian Interagency Forest Fire Centre. 2015. Canadian Interagency Forest Fire Centre current fire situation report. http://www.ciffc.ca/index.php?option=com_content&task=view&id=25&Itemid=27 (accessed December 2, 2015).
- Côté, J., S. Gravel, A. Méthot, A. Patoine, M. Roch, and A. Staniforth. 1998a. The operational CMC/MRB Global Environmental Multiscale (GEM) model. Part 1. Design considerations and formulation, Month. Weather Rev. 126:1373–95. doi:10.1175/1520-0493(1998)126%3C1373: TOCMGE%3E2.0.CO;2
- Côté, J., J.-G. Desmarais, S. Gravel, A. Méthot, A. Patoine, M. Roch, and A. Staniforth. 1998b. The operational CMC-MRB Global Environment Multiscale (GEM) model. Part 2. Results. Month. Weather Rev. 126:1397–418. doi:10.1175/1520-0493(1998)126%3C1397: TOCMGE%3E2.0.CO;2
- Cottle, P., K. Strawbridge, and I. McKendry. 2014. Long-range transport of Siberian wildfire smoke to British Columbia: Lidar observations and air quality impacts. Atmos. Environ. 90:71–77. doi:10.1016/j.atmosenv.2014.03.005
- Crutzen, P.J., and M.O. Andreae. 1990. Biomass burning in the tropics: Impact on atmospheric chemistry and biogeochemical cycles. Science 250:1669–78. doi:10.1126/science.250.4988.1669
- Crutzen, P. J, L. Heidt, J. Krasnec, W. Pollock, and W. Seiler. 1979. Biomass burning as a source of atmospheric gases CO, H2, N2O, NO, CH3Cl and COS. Nature 282(5736): 253–56. doi:10.1038/282253a0
- Damoah R., N. Spichtinger, R. Servranckx, M. Fromm, E.W. Eloranta, I.A. Razenkov, P. James, M. Shulski, C. Forster, and A. Stohl. 2006. A case study of pyro-convection using transport model and remote sensing data. Atmos. Chem. Phys. 6:173–85. doi:10.5194/acp-6-173-2006
- Darmenov, A., and A. da Silva. 2013. The quick fire emissions dataset (QFED)—Documentation of versions 2.1, 2.2 and 2.4. NASA Technical Report Series on Global Modeling and Data Assimilation, NASA TM-2013-104606, 32, 183, Greenbelt, MD. doi:10.1007/978-1-935704-23-2
- de Groot W.J., J.M. Pritchard, and T.J. Lynham. 2009. Forest floor fuel consumption and carbon emissions in Canadian boreal forest fires. Can. J. For. Res. 39:367–82. doi:10.1139/X08-192
- Ecological Stratification Working Group. 1995. A national ecological framework for Canada. Ottawa, ON, Canada: Agriculture and Agri-Food Canada, Research Branch, Centre for Land and Biological Resources Research and Environment Canada, State of Environment Directorate.
- El-Harbawi, M. 2013. Air quality modelling, simulation, and computational methods: A review. Environ. Rev. 21(3): 149–79. doi:10.1139/er-2012-0056
- Emmons, L.K., S. Walters, P.G. Hess, J.-F. Lamarque, G.G. Pfister, D. Fillmore, C. Granier, A. Guenther, D. Kinnison, T. Laepple, J. Orlando, X. Tie, G. Tyndall, C. Wiedinmyer, S.L. Baughcum, and S. Kloster, S., 2010. Description and evaluation of the model for ozone and related chemical tracers, version 4 (MOZART-4), Geosci. Model Dev. 3:43–67. doi:10.5194/gmd-3-43-2010
- Flannigan, M., A.S. Cantin, W.J. de Groot, M. Wotton, A. Newbery, and L.M. Gowman, 2013. Global wildland fire season severity in the 21st century. For. Ecol. Manage. 294:54–61. doi:10.1016/j.foreco.2012.10.022
- Forestry Canada Fire Danger Group. 1992. Development and structure of the Canadian Forest Fire Behavior Prediction System. Science and Sustainable Development Directorate, Information Report ST-X-3, Vol. 3. Forestry Canada, Science and Sustainable Development Directorate, Ottawa, Canada. http://cfs.nrcan.gc.ca/pubwarehouse/pdfs/10068.pdf
- Freitas, S.R., K.M. Longo, R. Chatfield, D. Latham, M.A.F. Silva Dias, M.O. Andreae, E. Prins., J.C. Santos, R. Gielow, and J.A. Carvalho, Jr. 2007. Including the sub-grid scale plume rise of vegetation fires in low resolution atmospheric transport models. Atmos. Chem. Phys. 7:3385–98, doi:10.5194/acp-7-3385-2007
- Fromm M., and R. Servranckx. 2003. Transport of forest fire smoke above the tropopause by supercell convection. Geophys. Res. Lett., 30:1542. doi:10.1029/2002GL016820
- Fromm M., R. Bevilacqua, R. Servranckx, J. Rosen, J. Thayer, J. Herman, and D. Larko. 2005. Pyrocumulonimbus injection of smoke to the stratosphere: Observations and impact of a super blowup in northwestern Canada on 3–4 August 1998. J. Geophys. Res. 110:D08205. doi:10.1029/2004JD005350
- Gatebe, C.K., T. Varnai, R. Poudyal, C. Ichoku, and M.D. King. 2012. Taking the pulse of pyrocumulus clouds. Atmos. Environ. 52:121. doi:10.1016/j.atmosenv.2012.01.045
- Giglio, L, J. Descloitres, C.O. Justice, and Y.J. Kaufman. 2003. An enhanced contextual fire detection algorithm for MODIS. Remote Sens. Environ. 87(2): 273–82. doi:10.1016/S0034-4257(03)00184-6
- Gillis M.D., A.Y. Omule, and T. Brierley, 2005. Monitoring Canada’s forests: The National Forest Inventory. For. Chron. 81:214–21. doi:10.5558/tfc81214-2
- Gong, S.L., L.A. Barrie, J.-P. Blanchet, K. von Salzen, U. Lohmann, G. Lesins, L. Spacek, L.M. Zhang, E. Girard, H. Lin, R. Leaitch, H. Leighton, P. Chylek, and P. Huang, 2003. Canadian Aerosol Module: A size segregated simulation of atmospheric aerosol processes for climate and air quality models: Part 1. Module development. J. Geophys. Res., 108(D1): 4007. doi:10.1029/2001JD002002
- Hanna, S.R., A.G. Russell, J.G. Wilkinson, J. Vukovich, and D.A. Hansen. 2005. Monte Carlo estimation of uncertainties in BEIS3 emission outputs and their effects on uncertainties in chemical transport model predictions. J. Geophys. Res. 110:D01302. doi:10.1029/2004JD004986
- Heilman, W.E., Y. Liu, S. Urbanski, V. Kovalev, and R. Mickler. 2014. Wildland fire emissions, carbon, and climate: Plume rise, atmospheric transport, and chemistry processes. For. Ecol. Manage. 317:70–79. doi:10.1016/j.foreco.2013.02.001
- Henderson B.S., M. Brauer, Y.C. MacNab, and S.M. Kennedy. 2011. Three measures of forest fire smoke exposure and their associations with respiratory and cardiovascular health outcomes in a population-based cohort. Environ. Health Perspect. 119:1266–71. doi:10.1289/ehp.1002288
- Herron-Thorpe, F.L., G.H. Mount, L. Emmons, B.K. Lamb, S.H. Chung, and J.K. Vaughan. 2012. Regional air-quality forecasting for the Pacific Northwest using MOPITT/TERRA assimilated carbon monoxide MOZART-4 forecasts as a near real-time boundary condition, Atmos. Chem. Phys. 12:5603–15. doi:10.5194/acp-12-5603-2012
- Im, U., R. Bianconi, E. Solazzo, I. Kioutsioukis, A. Badia, A. Balzarini, R. Baro, R. Bellasio, D. Brunner, C. Chemel, G. Curci, J. Flemming, R. Forkel, L. Giordano, P. Jimenez-Guerrero, M. Hirtl, A. Hodzic, L. Honzak, O. Jorba, C. Knote, J.J.P. Kuenen, P.A. Makar, A. Manders-Groot, L. Neal, J.L. Perez, G. Pirovano, G. Pouliot, R. San Jose, N. Savage, W. Schroder, R.S. Sokhi, D. Syrakov, A. Torian, P. Tuccella, K. Werhahn, R. Wolke, K. Yahya, R. Zabkar, Y. Zhang, J. Zhang, J., C. Hogrefe, and S. Galmarini. 2015. Evaluation of operational online-coupled regional air quality models over Europe and North America in the context of AQMEII phase 2. Part I: Ozone. Atmos. Environ. 115:404–20. doi:10.1016/j.atmosenv.2014.09.042
- Intergovernmental Panel on Climate Change. 2014. Climate change 2014: Synthesis report. Contribution of Working Groups I, II and III to the Fifth Assessment Report of the Intergovernmental Panel on Climate Change. Core Writing Team, ed. R.K. Pachauri and L.A. Meyer. Geneva, Switzerland: IPCC.
- Jaffe, D., and N. Wigder. 2012. Ozone production from wildfires: A critical review. Atmos. Environ. 51:1–10. doi:10.1016/j.atmosenv.2011.11.063
- Kaiser, J. W., A. Heil, M. O. Andreae, A. Benedetti, N. Chubarova, L. Jones, J-J. Morcrette, M. Razinger, M.G. Schultz, M. Suttie, and G.R. van der Werf. 2012. Biomass burning emissions estimated with a global fire assimilation system based on observed fire radiative power. Biogeosciences 9:527–54. doi:10.5194/bg-9-527-2012
- Kukkonen, J., T. Olsson, D.M. Schultz, A. Baklanov, T. Klein, A.I. Miranda, A. Monteiro, M. Hirtl, V. Tarvainen, M. Boy, V.-H. Peuch, A. Poupkou, I. Kioutsioukis, S. Finardi, M. Sofiev, R. Sokhi, K.E.J. Lehtinen, K. Karatzas, R. San José, M. Astitha, G. Kallos, M. Schaap, E. Reimer, H. Jakobs, and K. Eben. 2012. A review of operational, regional-scale, chemical weather forecasting models in Europe, Atmos. Chem. Phys. 12:1–87. doi:10.5194/acp-12-1-2012
- Larkin, N.K., S.M. O’Neill, R. Solomon, S. Raffuse, T. Strand, D. Sullivan, C. Krull, M. Rorig, J. Peterson, and S.A. Ferguson. 2009, The BlueSky smoke modeling framework. Int. J. Wildland Fire 18:906–20. doi:10.1071/WF07086
- Lee, B.S., M.E. Alexander, B.C. Hawkes, T.J. Lynham, B.J. Stocks, and P. Englefield. 2002. Information systems in support of wildland fire management decision-making in Canada. Comput. Electron. Agric. 37:185–98. doi:10.1016/S0168-1699(02)00120-5
- Liu Y., S.L. Goodrick, and J.A. Stanturf. 2013. Future U.S. wildfire potential trends projected using a dynamically downscaled climate change scenario. For. Ecol. Manage. 294:120–35. doi:10.1016/j.foreco.2012.06.049
- Liu J.C., G. Pereira, S.A. Uhl, M.A. Bravo, and M.L. Bell. 2015. A systematic review of the physical health impacts from non-occupational exposure to wildfire smoke, Environ. Res. (136):120–32. doi:10.1016/j.envres.2014.10.015
- Lurmann, F.W., and W.R. Stockwell. 1989. Intercomparison of the ADOM and RADM gas-phase chemical mechanisms. Electrical Power Research Institute Topical Report. Palo Alto, CA: EPRI.
- Mahfouf, J.-F., B. Brasnett, and S. Gagnon. 2007. A Canadian precipitation analysis (CaPA) project: Description and preliminary results. Atmos. Ocean 45:1–17. doi:10.3137/ao.v450101
- Makar, P.A., W. Gong, C. Mooney, J. Zhang, D. Davignon, M. Samaali, M.D. Moran, H. He, D.W. Tarasick, D. Sills, and J. Chen. 2010. Dynamic adjustment of climatological ozone boundary conditions for air-quality forecasts. Atmos. Chem. Phys. 10(8): 997–1015. doi:10.5194/acpd-10-13643-2010
- Mason, I. 2003. Binary events. In Forecast Verification: A Practitioner’s Guide in Atmospheric Science, ed. I.T. Jolliffe and D.B. Stephenson, 37–76. Chichester, UK: John Wiley & Sons.
- Mathur, R. 2008. Estimating the impact of the 2004 Alaskan forest fires on episodic particulate matter pollution over the eastern United States through assimilation of satellite-derived aerosol optical depths in a regional air quality model. J. Geophys. Res. 113:D17302. doi:10.1029/2007JD009767
- Miller, S.R. 2015. Using prescribed fire to reduce the risk of smoke related traffic problems on I-95. In Proceedings of The Large Wildland Fires Conference; May 19-23, 2014; Missoula, MT. Proc. RMRS-P-73, ed. R.E. Keane, M. Jolly R. Parsons, and K. Riley, 163–67. Fort Collins, CO: U.S. Department of Agriculture, Forest Service, Rocky Mountain Research Station.
- Miller, D.J., K. Sun, M.A. Zondlo, D. Kanter, O. Dubovik, E.J. Welton, D.M. Winker, and P. Ginoux. 2011. Assessing boreal forest fire smoke aerosol impacts on U.S. air quality: A case study using multiple data sets. J. Geophys. Res. 116:D22209. doi:10.1029/2011JD0161
- Moran, M.D., S. Ménard, R. Pavlovic, D. Anselmo, S. Antonopoulos, P.A. Makar, W. Gong, C. Stroud, J. Zhang, Q. Zheng, A. Robichaud, H. Landry, P.-A. Beaulieu, S. Gilbert, J. Chen, and A. Kallaur. 2012. Recent advances in Canada’s National Operational AQ Forecasting System. Proc. 32nd NATO/SPS ITM on Air Pollution Modelling and Its Application, 7–11 May 2012, Utrecht, The Netherlands, 215–20.
- Moran, M., Q. Zheng, J. Zhang, and R. Pavlovic. 2015. RAQDPS version 013: Upgrades to the CMC Operational Regional Air Quality Deterministic Prediction System. June. http://collaboration.cmc.ec.gc.ca/cmc/cmoi/product_guide/docs/lib/op_systems/doc_opchanges/ (accessed December 2, 2015)
- Riccardi, C.L., S.J. Prichard, D.V. Sandberg, and R.D. Ottmar. 2007. Quantifying physical characteristics of wildland fuels using the Fuel Characteristic Classification System. Can. J. Forest Res. 37(12): 2413–20. doi:10.1139/X07-175
- Robichaud, A., and R. Ménard. 2014. Multi-year objective analyses of warm season ground-level ozone and PM2.5 over North America using real-time observations and Canadian operational air quality models. Atmos. Chem. Phys. 14:1769–800, doi:10.5194/acp-14-1769-2014
- Rolph, G.D., R.R. Draxler, A.F. Stein, A.Taylor, M.G. Ruminski, S.Kondragunta, J. Zeng, H-C. Huang, G. Manikin, J.T. McQueen, and P.M. Davidson. 2009. Description and verification of the NOAA smoke forecasting system: The 2007 fire season. Weather Forecast. 24(2): 361–78. doi:10.1175/2008WAF2222165.1
- Saide, P. E., D. Peterson, D., A. da Silva, B. Anderson, L. D. Ziemba, G. Diskin, G. Sachse, J. Hair, C. Butler, M. Fenn, J. L. Jimenez, P. Campuzano-Jost, A. Perring, J. Schwarz, M. Z. Markovic, P. Russell, J. Redemann, Y. Shinozuka, D. G. Streets, F. Yan, J. Dibb, R. Yokelson, O. B. Toon, E. Hyer, and G.R. Carmichael. 2015. Revealing important nocturnal and day-to-day variations in fire smoke emissions through a novel multiplatform inversion, Geophys. Res. Lett. 42:3609–18, doi:10.1002/2015GL063737, 2015
- Schigas, R., and R. Stull. 2013. BlueSky Canada Part 3—BlueSky Canada wildfire smoke: Status at UBC. Can. Smoke Newslett. 2013:29–32.
- Sessions, W.R., H.E. Fuelberg, R.A. Kahn, and D.M. Winker. 2011. An investigation of methods for injecting emissions from boreal wildfires using WRF-Chem during ARCTAS. Atmos. Chem. Phys. 11:5719–44. doi:10.5194/acp-11-5719-2011
- Simpson, B., P. Englefield, and K. Anderson. 2010. Fuel-type mapping for the CWFIS: Past, present, and future. Can. Smoke Newslett. Spring/Summer:4–9.
- Spracklen, D.V., L.J. Mickley, J.A. Logan, R.C. Hudman, R. Yevich, M.D. Flannigan, and A.L. Westerling. 2009. Impacts of climate change from 2000 to 2050 on wildfire activity and carbonaceous aerosol concentrations in the western United States. J. Geophys. Res. 114:D20301. doi:10.1029/2008JD010966
- Stajner, I., P. Davidson, D. Byun, J. McQueen, R. Draxler, P. Dickerson, and J. Meagher. 2012. U.S. national air quality forecast capability: expanding coverage to include particulate matter. Air Pollution Modeling and its Application XXI, 379–84. Dordrecht, The Netherlands: Springer.
- Stanski R.H., L.J. Wilson, and W.R. Burrows, 1989. Survey of common verification methods in meteorology. Atmospheric Research, Environment Canada. Research Report no. (MSRB) 89-5. www.cawcr.gov.au/projects/verification/Stanski_et…/Stanski_et_al.html
- Stieb, D.M., R.T. Burnett, M. Smith-Doiron, O. Brion, H. Hyun Shin, and V. Economou. 2008. A new multipollutant, no-threshold air quality health index based on short-term associations observed in daily time-series analyses. J. Air Waste Manage. Assoc. 58:435–501. doi:10.3155-1047-3289.58.3.435
- Stocks, B.J, B.D. Lawson, M.E. Alexander, C.E. Van Wagner, R.S. McAlpine R.S., T.J. Lynham, and D.E. Dubé. 1989. The Canadian Forest Fire Danger Rating System: An overview. For. Chron. 65: 450–57. doi:10.5558/tfc65258-4
- Van Wagner C.E. 1987. Development and structure of the Canadian Forest Fire Weather Index System. Ottawa, ON, Canada: Canadian Forestry Service, Forestry Technology Report 35.
- Wang X., D.K. Thompson, G.A. Marshall, C. Tymstra, R. Carr, and M.D. Flannigan. 2015. Increasing frequency of extreme fire weather in Canada with climate change. Climatic Change 30(4): 573–86. doi:10.1007/s10584-015-1375-5
- Western Regional Air Partnership. 2005. 2002 Fire Emission Inventory for the WRAP Region—Phase II, Project No. 178-6. http://www.wrapair.org/forums/fejf/documents/WRAP_2002_PhII_EI_Report_20050722.pdf (accessed December 2, 2015).
- Wiedinmyer, C., S.K. Akagi, R.J. Yokelson, L.K. Emmons, J.A. Al-Saadi, J.J. Orlando, and A.J. Soja. 2011. The Fire INventory from NCAR (FINN): A high resolution global model to estimate the emissions from open burning. Geosci. Model Dev. 4:625–41. doi:10.5194/gmd-4-625-2011
- Wilson, L.J., and M. Vallée. 2002. The Canadian Updateable Model Output Statistics (UMOS) system: design and development tests. Weather Forecast. 17:206–22. doi:10.1175/1520-0434(2002)017<0206: TCUMOS>2.0.CO;2
- Wise, E.K. 2008. Meteorologically influenced wildfire impacts on urban particulate matter and visibility in Tucson, Arizona, USA. Int. J. Wildland Fire 17:214–23. doi:10.1071/WF06111
- Zhang, Y., M. Bocquet, V. Mallet, C. Seigneur, and A. Baklanov. 2012a. Real-time air quality forecasting, part I: History, techniques, and current status. Atmos. Environ. 60:632–55. doi:10.1016/j.atmosenv.2012.06.031
- Zhang, Y., M. Bocquet, V. Mallet, C. Seigneur, and A. Baklanov. 2012b. Real-time air quality forecasting, part II: State of the science, current research needs, and future prospects. Atmos. Environ. 60:656–76. doi:10.1016/j.atmosenv.2012.02.041
- Zhang, X., S. Kondragunta, J. Ram, C. Schmidt, and H.-C. Huang. 2012c. Near-real-time global biomass burning emissions product from geostationary satellite constellation, J. Geophys. Res. 117:D14201. doi:10.1029/2012JD017459